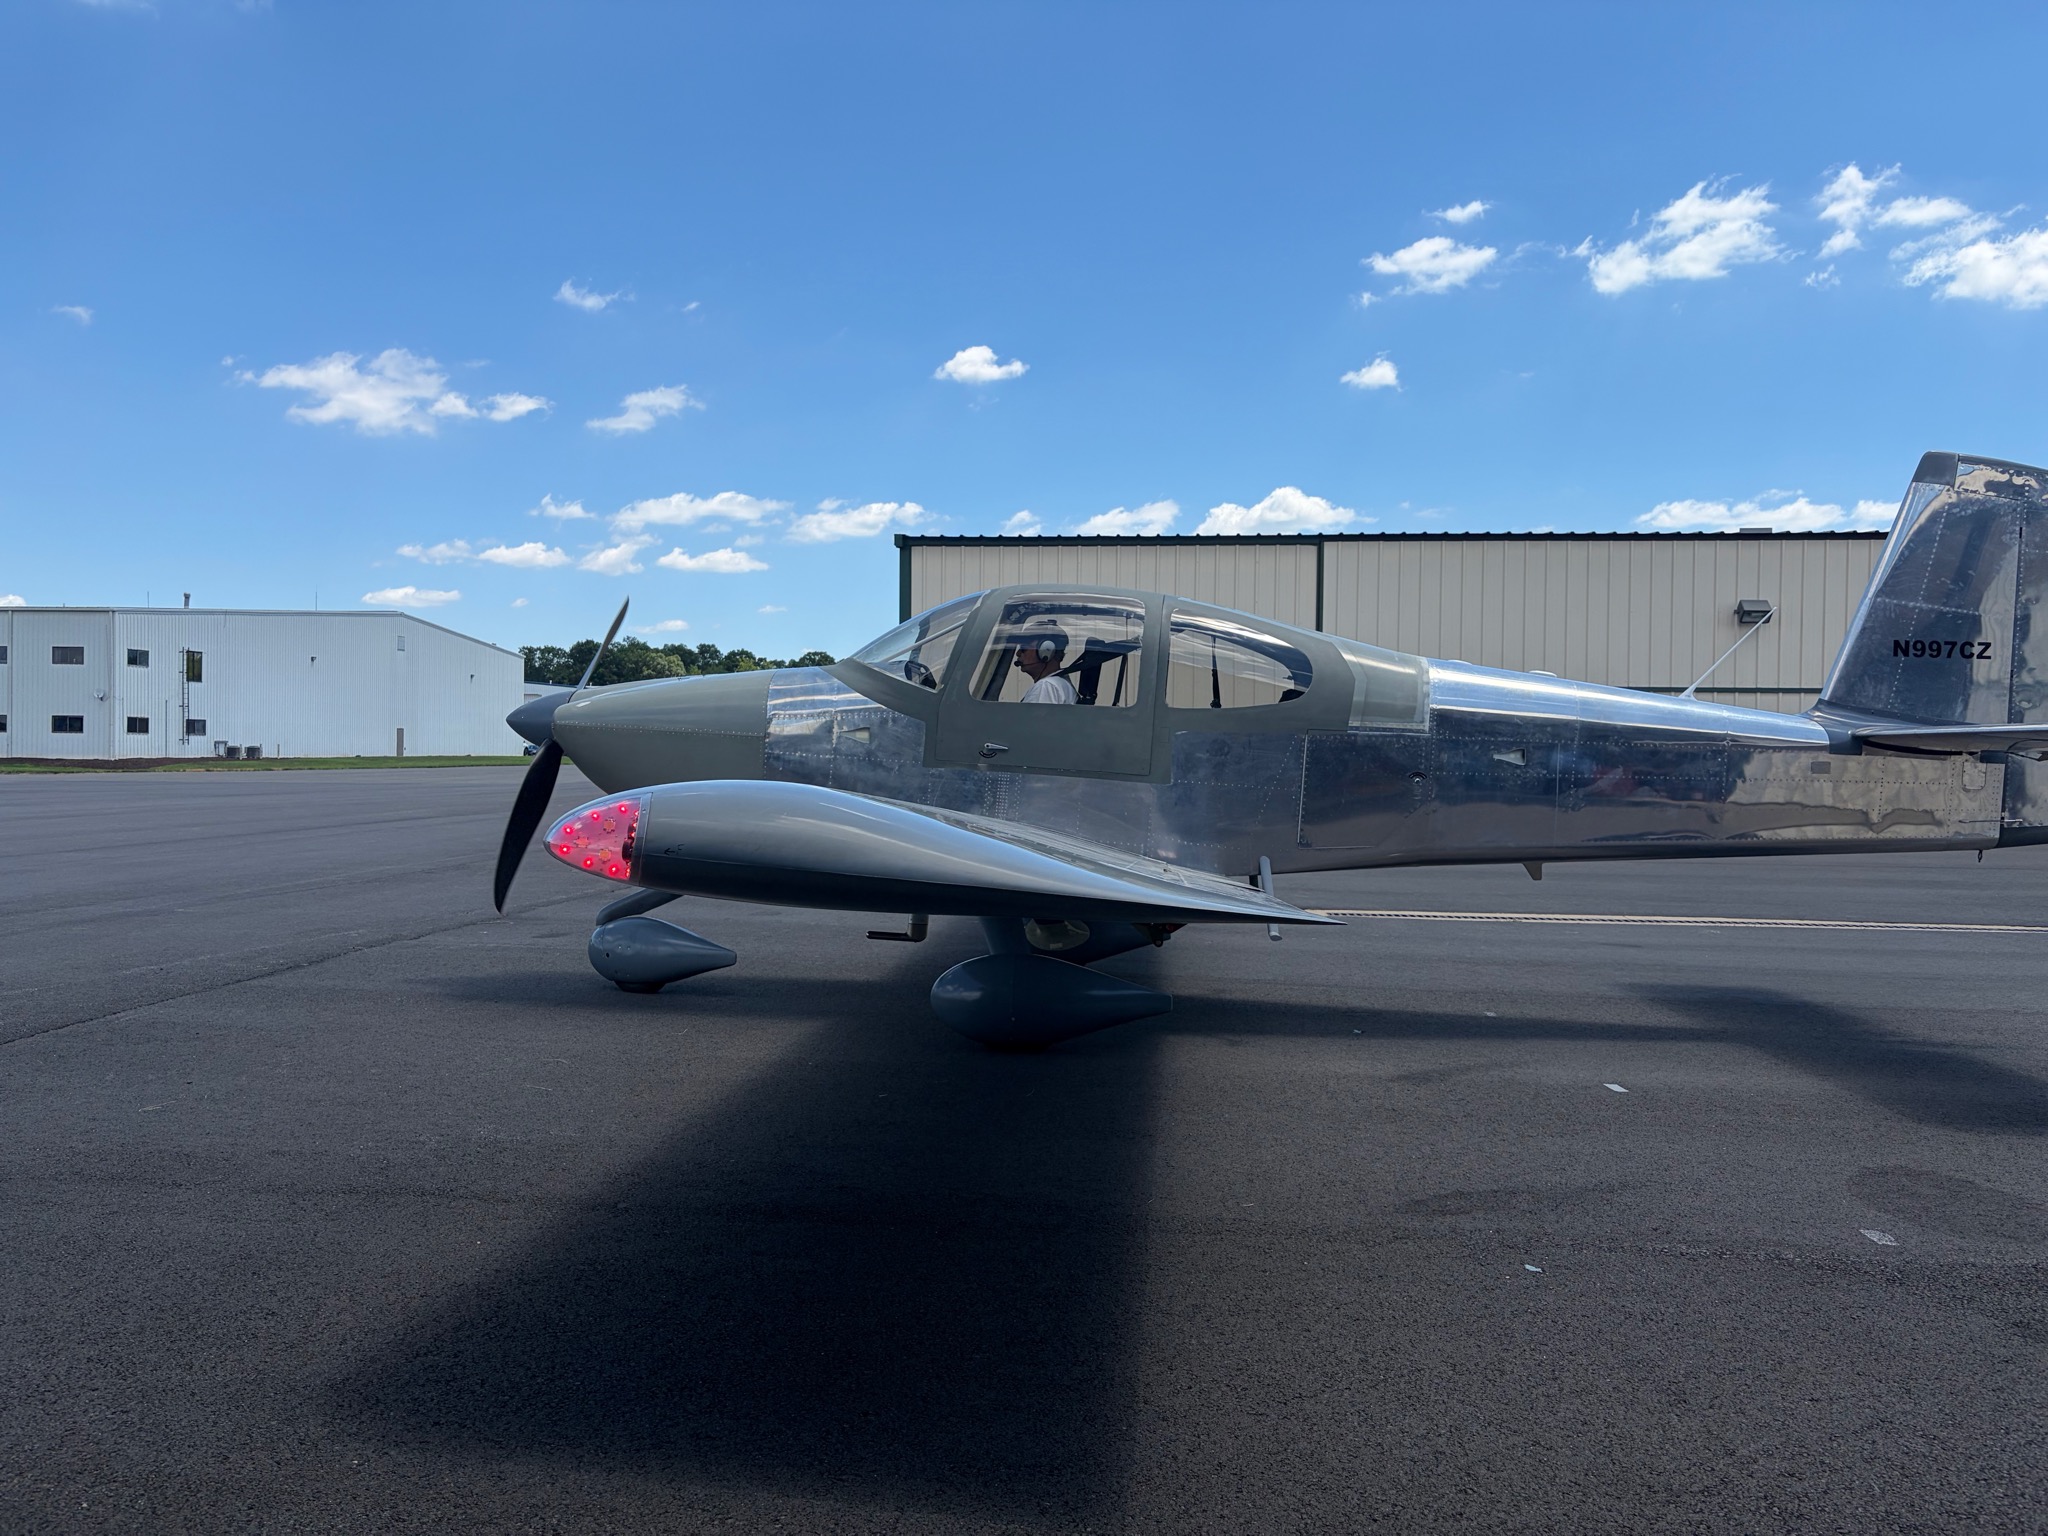
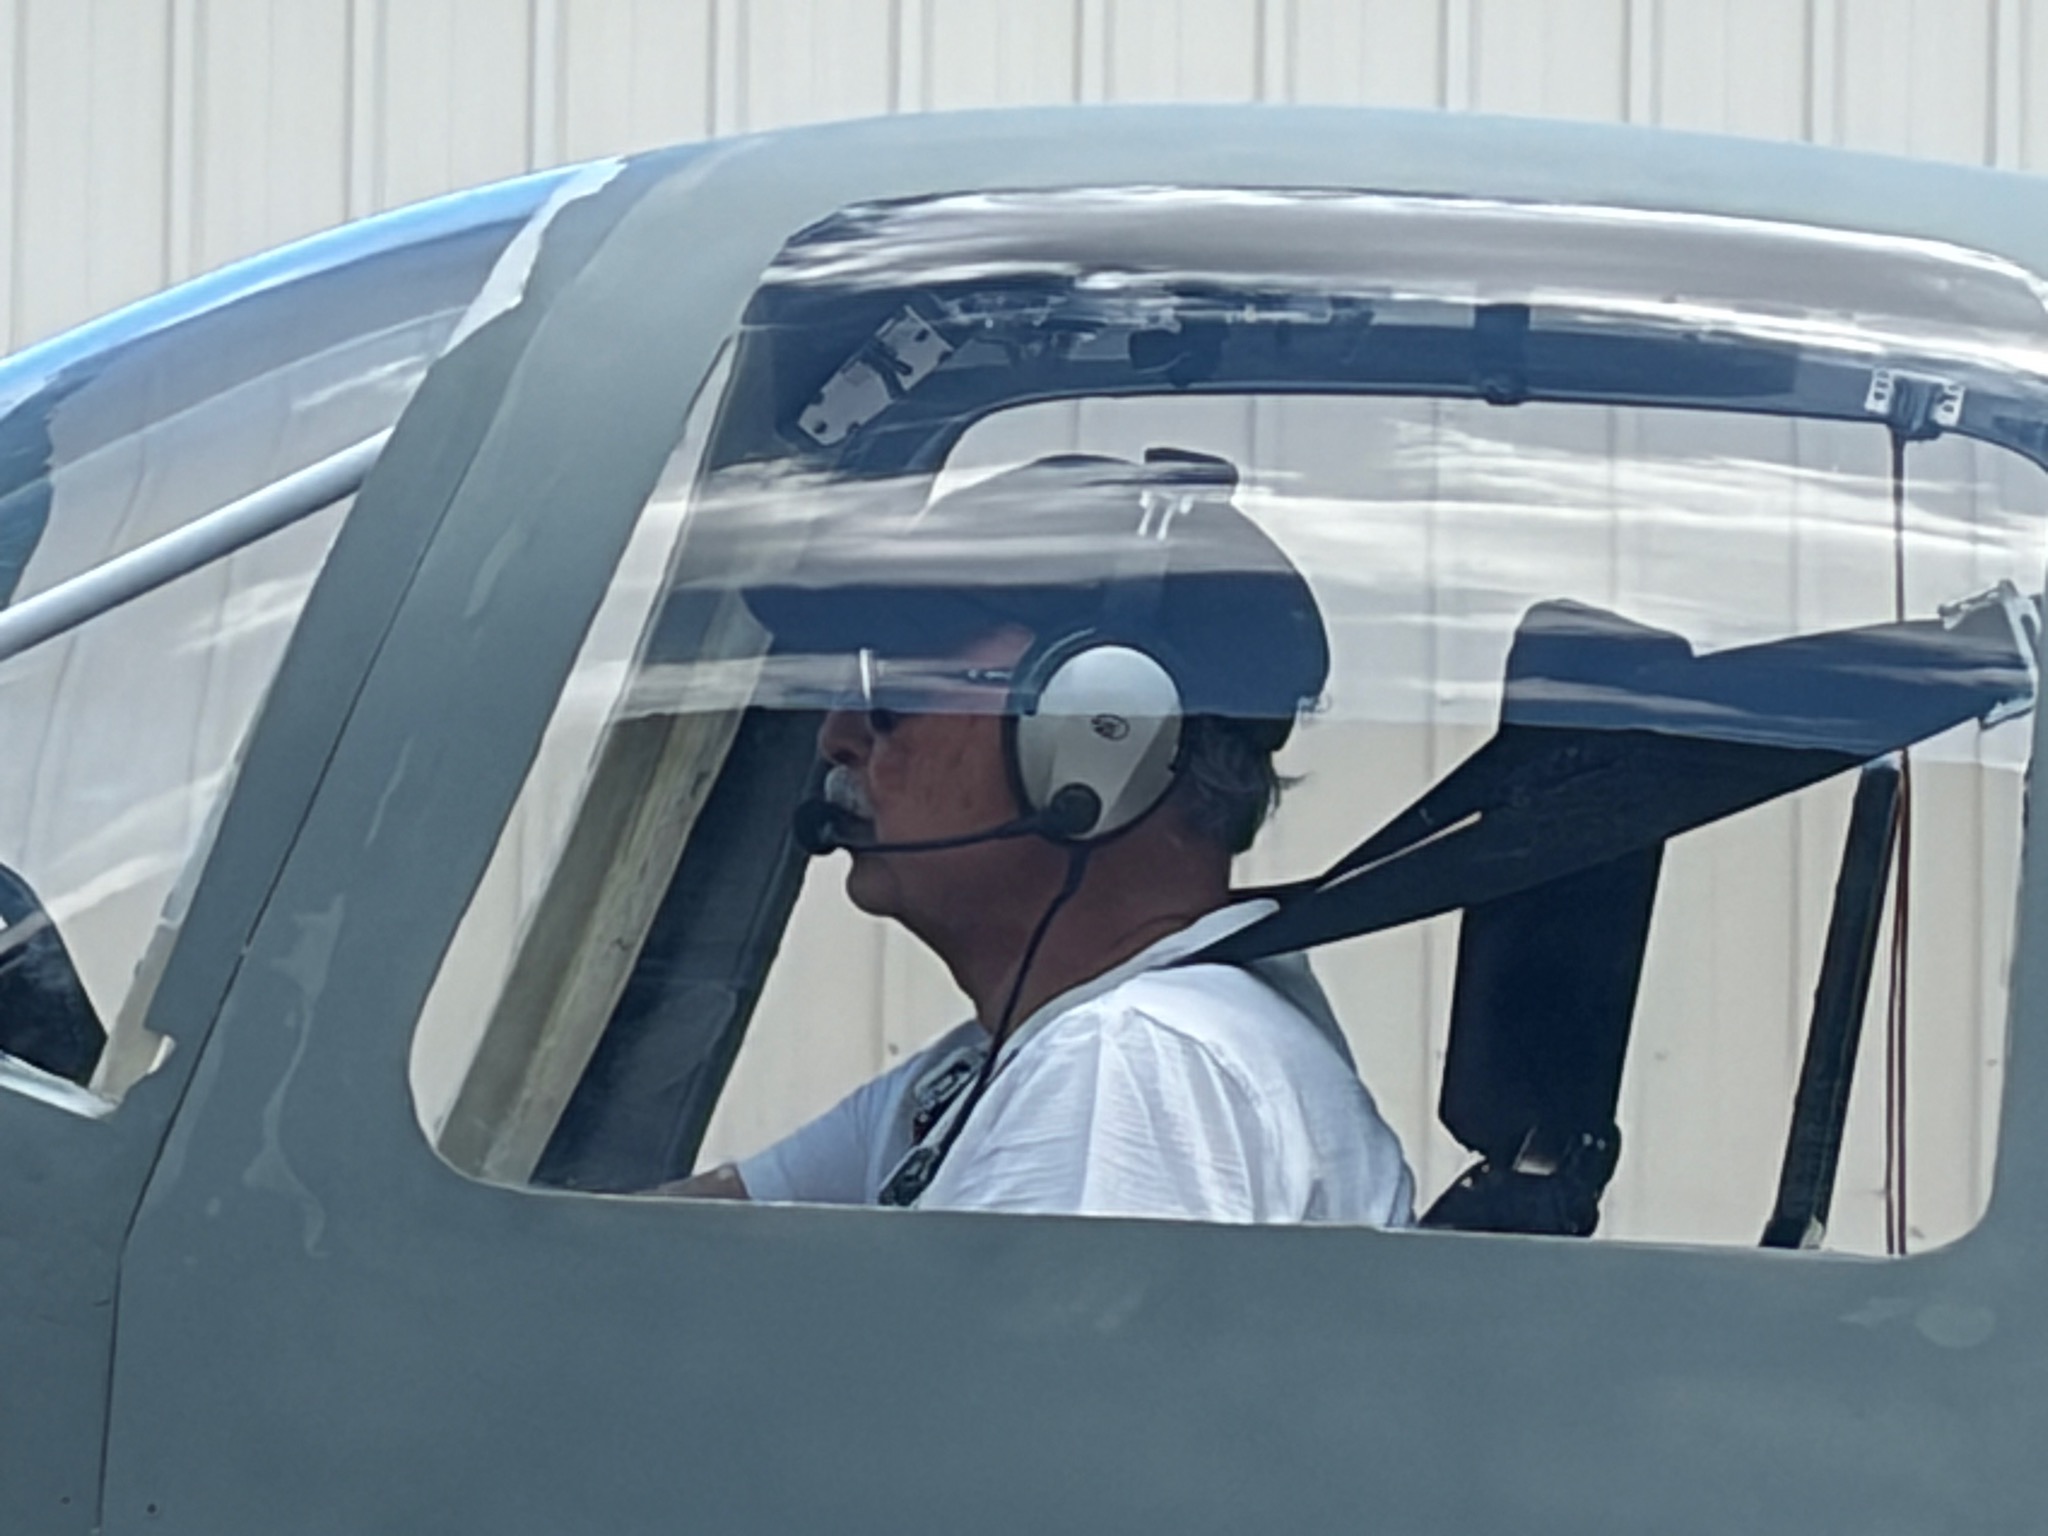
Flight 19 put Harry Tsepelias back in the left seat for another go in N997CZ. It wasn’t a formal test card — more of a shakedown and stick time — but it gave the autopilot a long, honest workout, and that finally pinned down a roll-autopilot squawk we’ve been chasing: it just wasn’t aggressive enough rolling into turns. The good news is everything else on the airplane behaved beautifully.
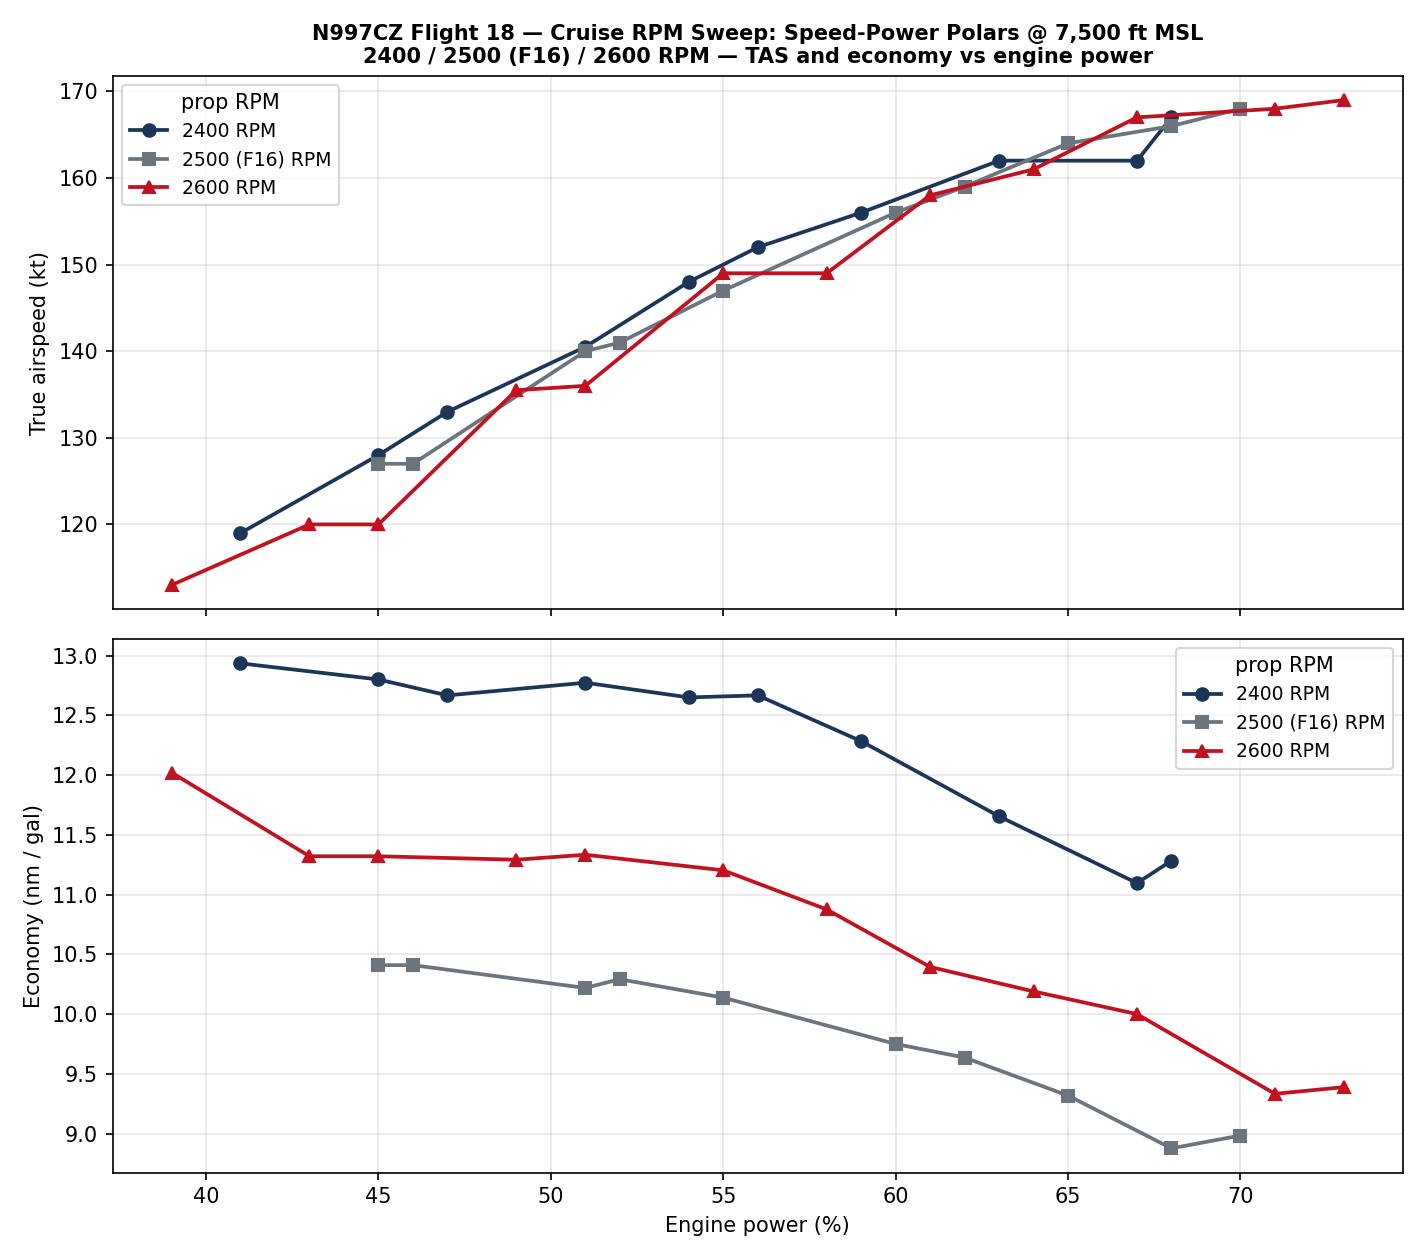
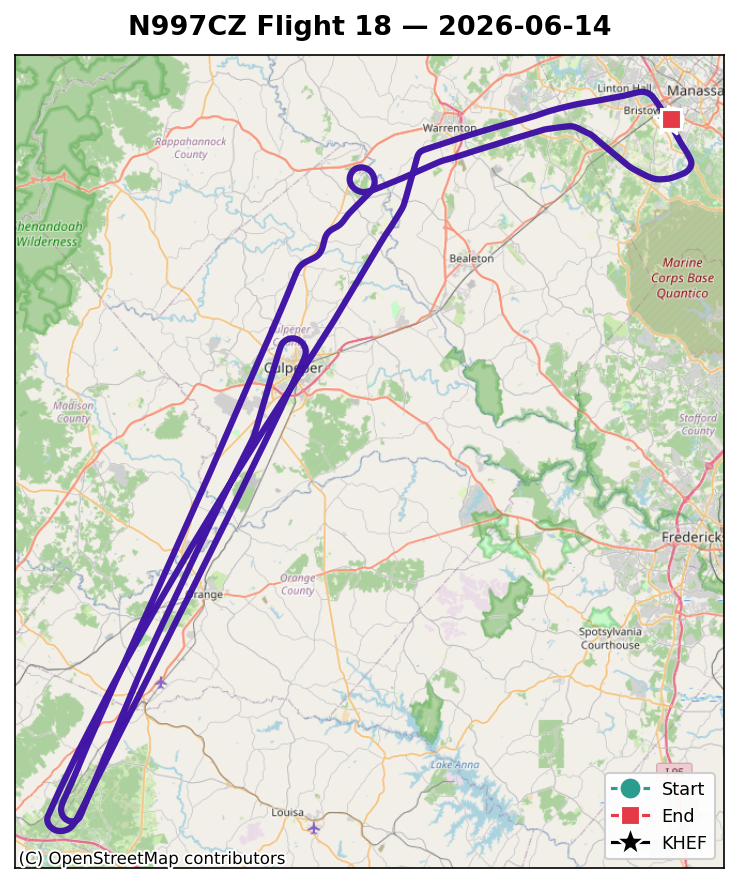
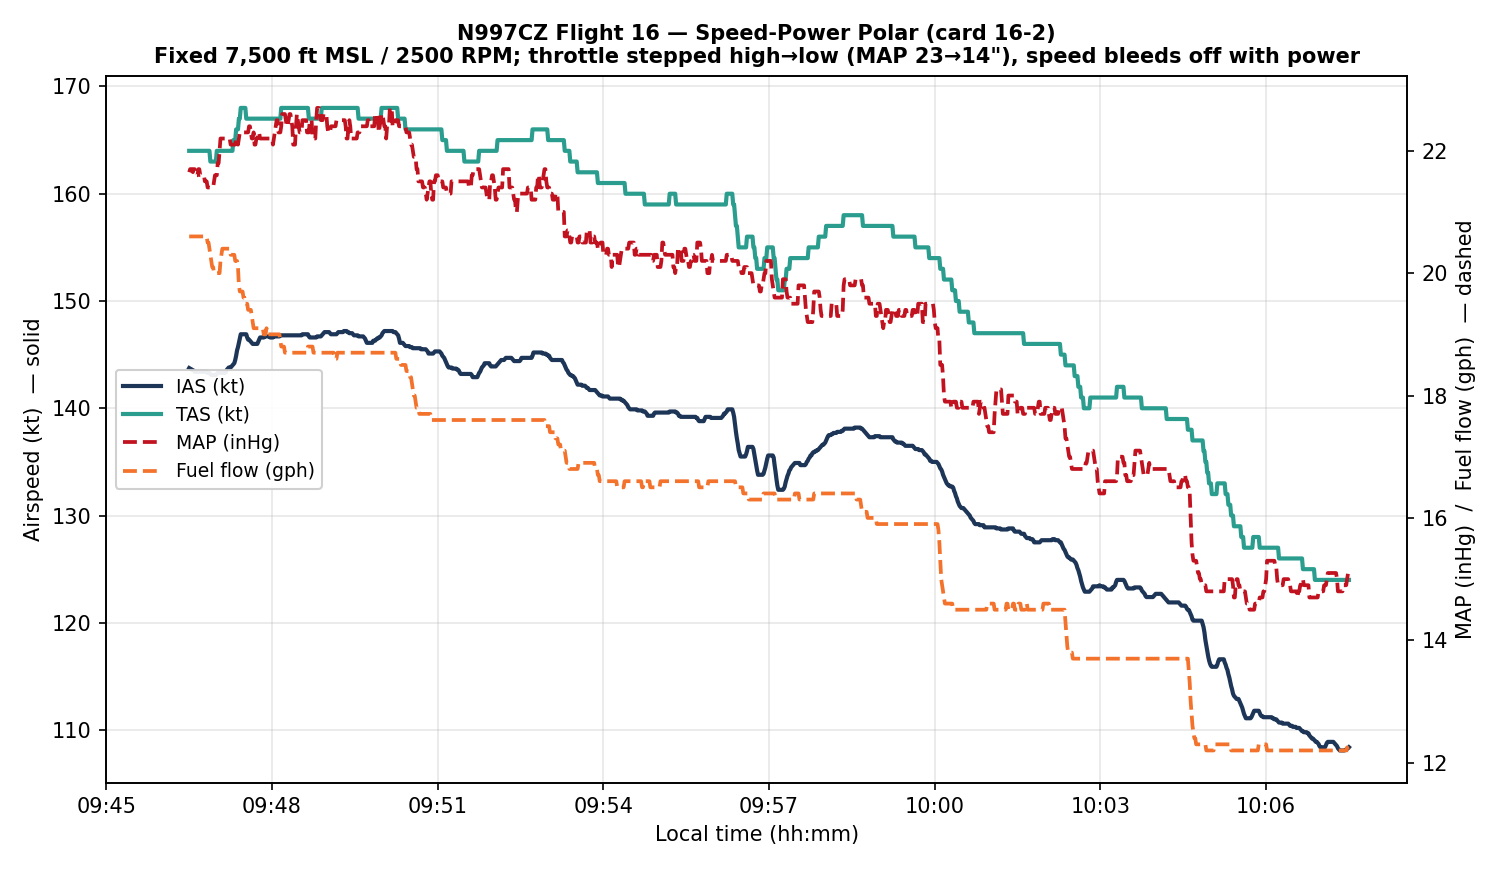
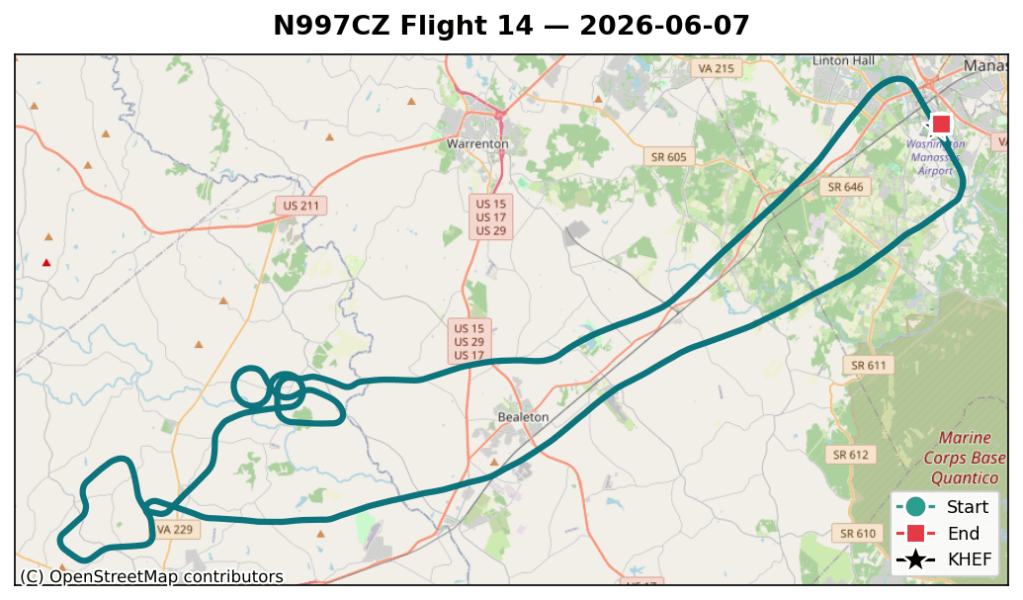
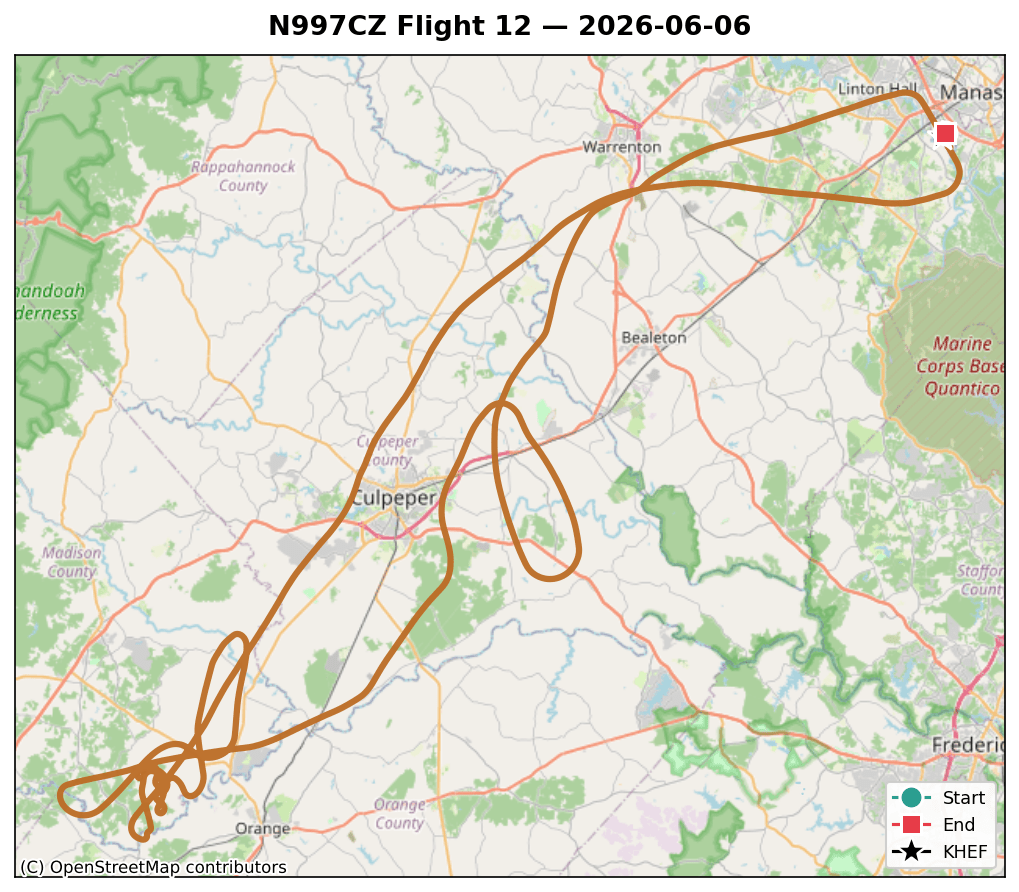
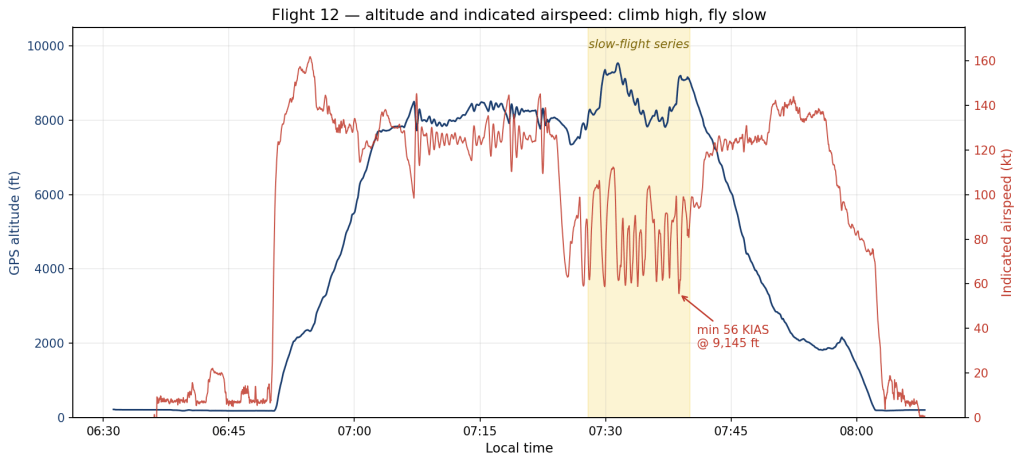
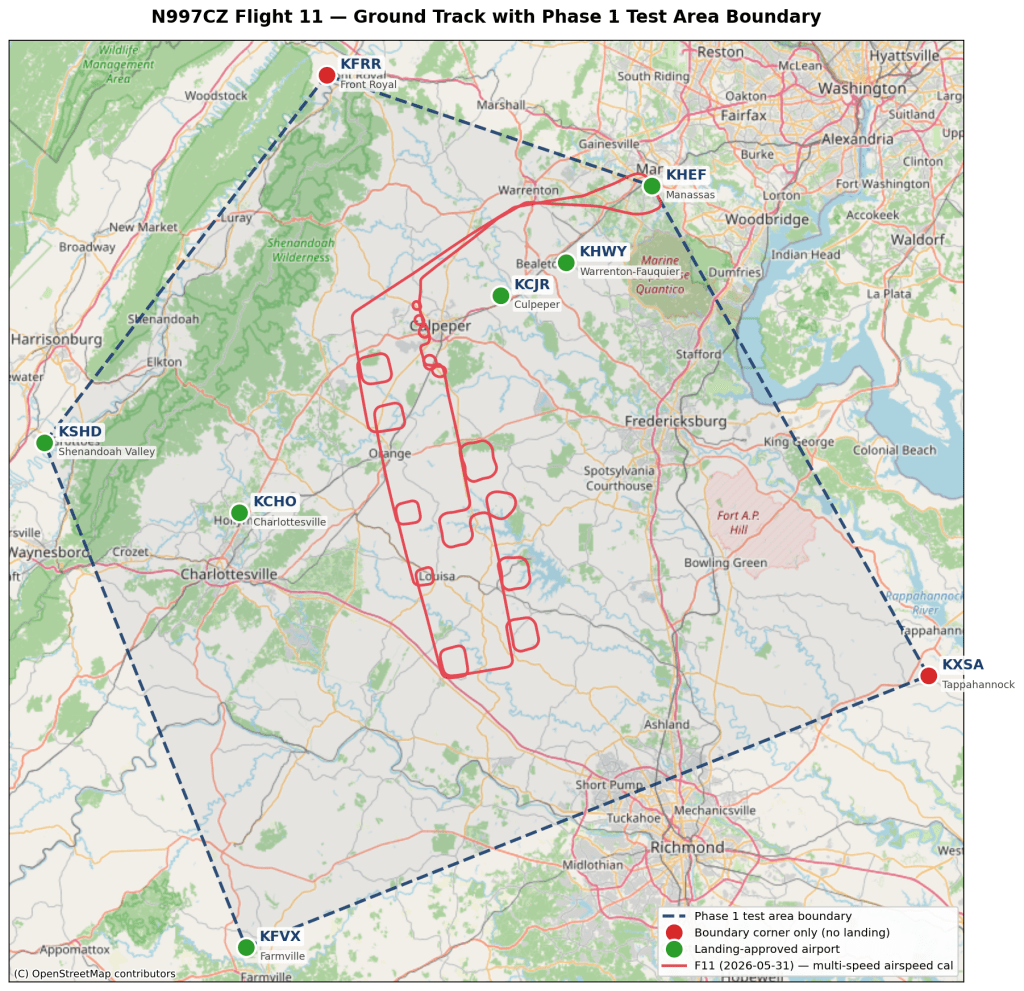
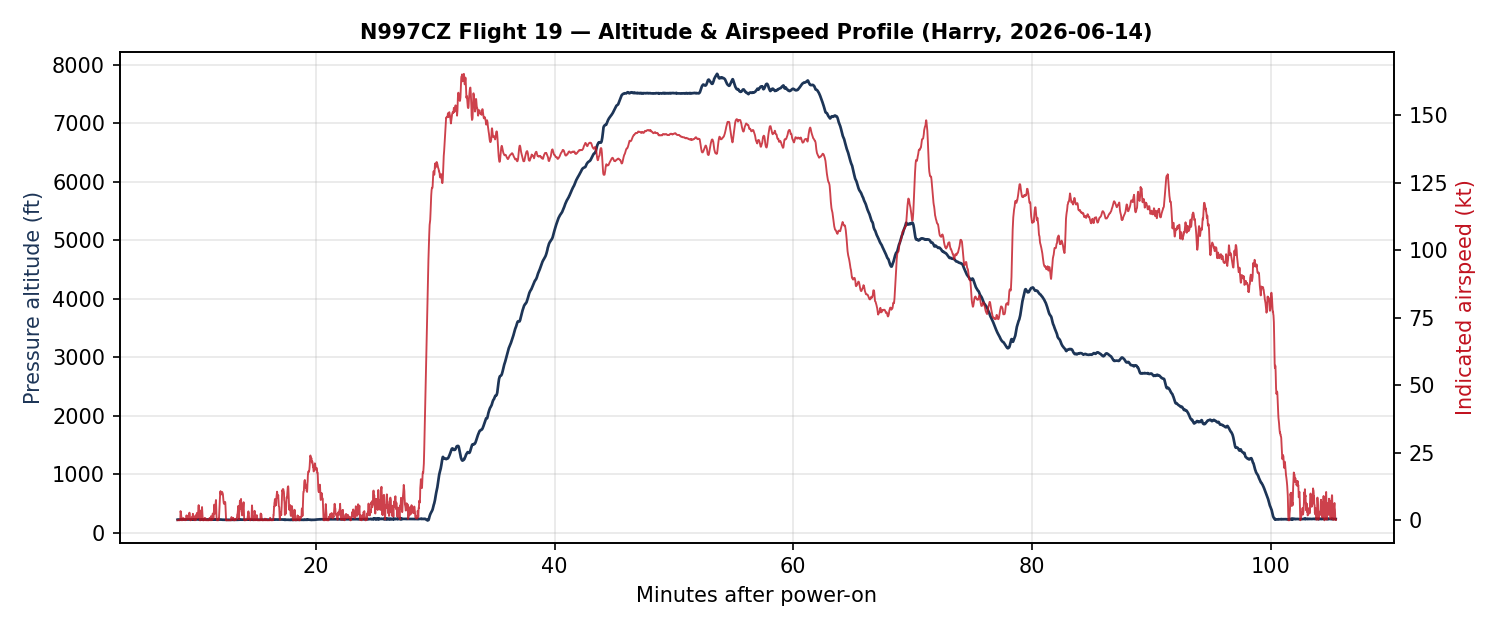
A quick snapshot of the flight: engine start 09:42, shutdown 11:19 — about 1.6 hours — out of KHEF, up to 7,830 ft MSL (8,238 ft GPS), 165 KIAS / 172 kt true at the fast end, 18.6 gallons burned (all from the right tank, no switch).
The autopilot is slow to roll into a turn
The squawk is easy to feel from the seat: dial in a big heading change with the heading bug, and the flight director snaps to a commanded bank — but the airplane is slow to roll into it, as if the servo can’t push the ailerons over. I’d been chasing it for a few flights mostly by adding muscle, walking the roll-servo maximum torque up 15% → ~40% → 90%. It helped, but never quite cured it. So I went digging in the logs to settle the real question: is the autopilot short on muscle, or just using it badly?
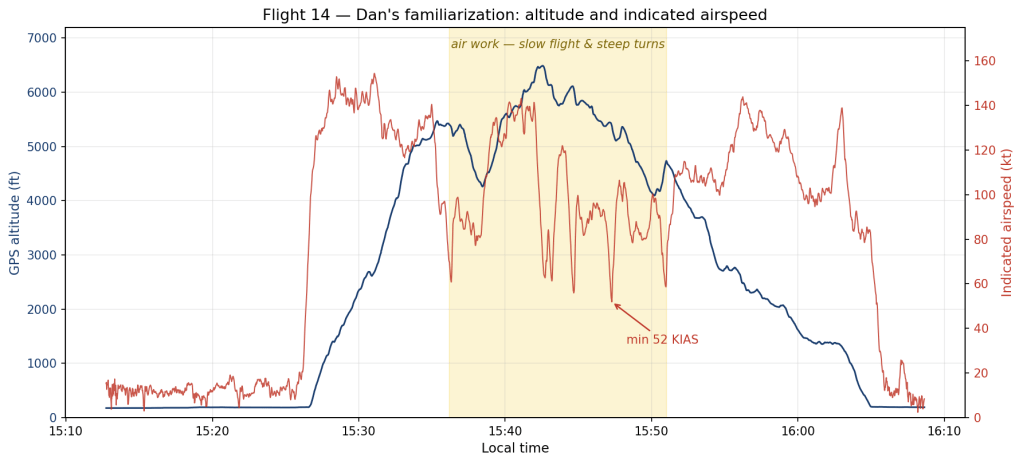
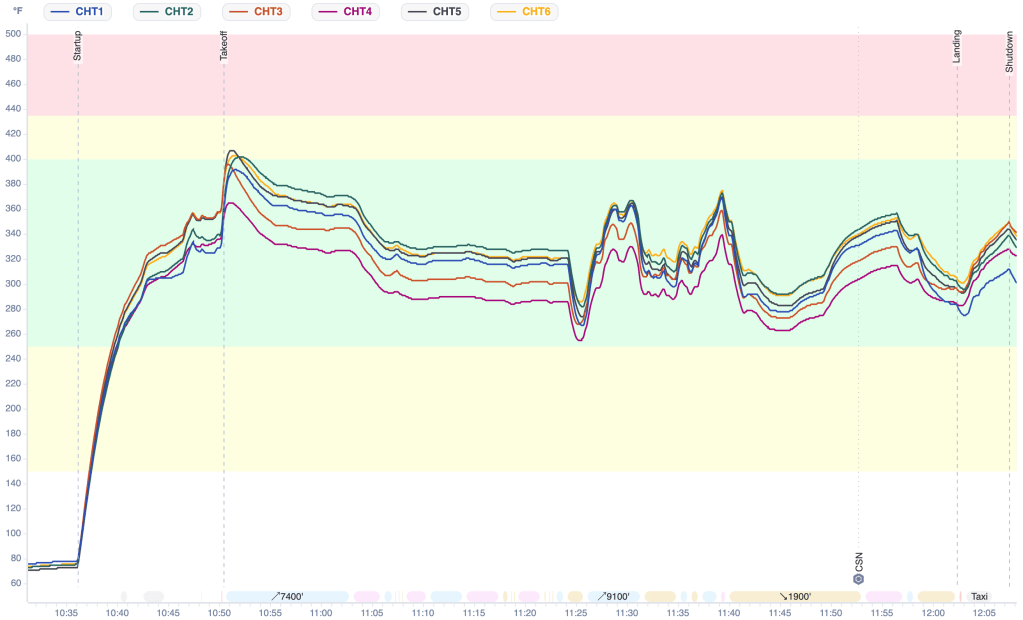
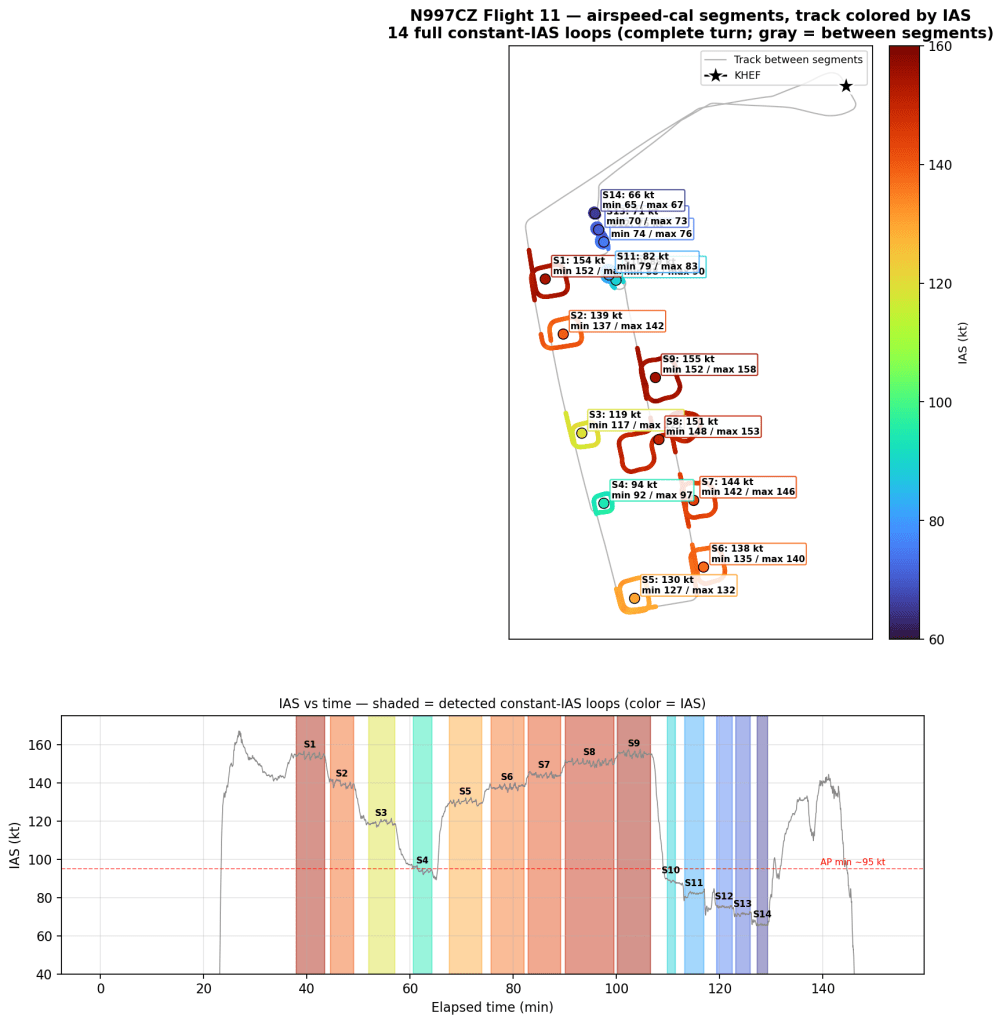
One other autopilot note worth logging: during a slower segment the system briefly went to its “minimum airspeed” protection (it annunciated for about 38 seconds, along with nose-up trim commands). That’s the autopilot refusing to fly slower than its configured floor — and it’s exactly why lowering that minimum-airspeed setting is on the to-do list, so the AP can fly the slower approaches we want for upcoming testing.
Following the thread: muscle or gain?
Early on, the sluggishness was real torque starvation. Back on Flight 9 the roll servo’s max torque was set to just 15%, and on a big heading-bug turn the servo pegged that 15% ceiling and the airplane rolled in at about 1° per second — never even reaching the commanded bank. That’s the “no strength to move the ailerons” feeling, and it’s exactly why I kept raising the torque.
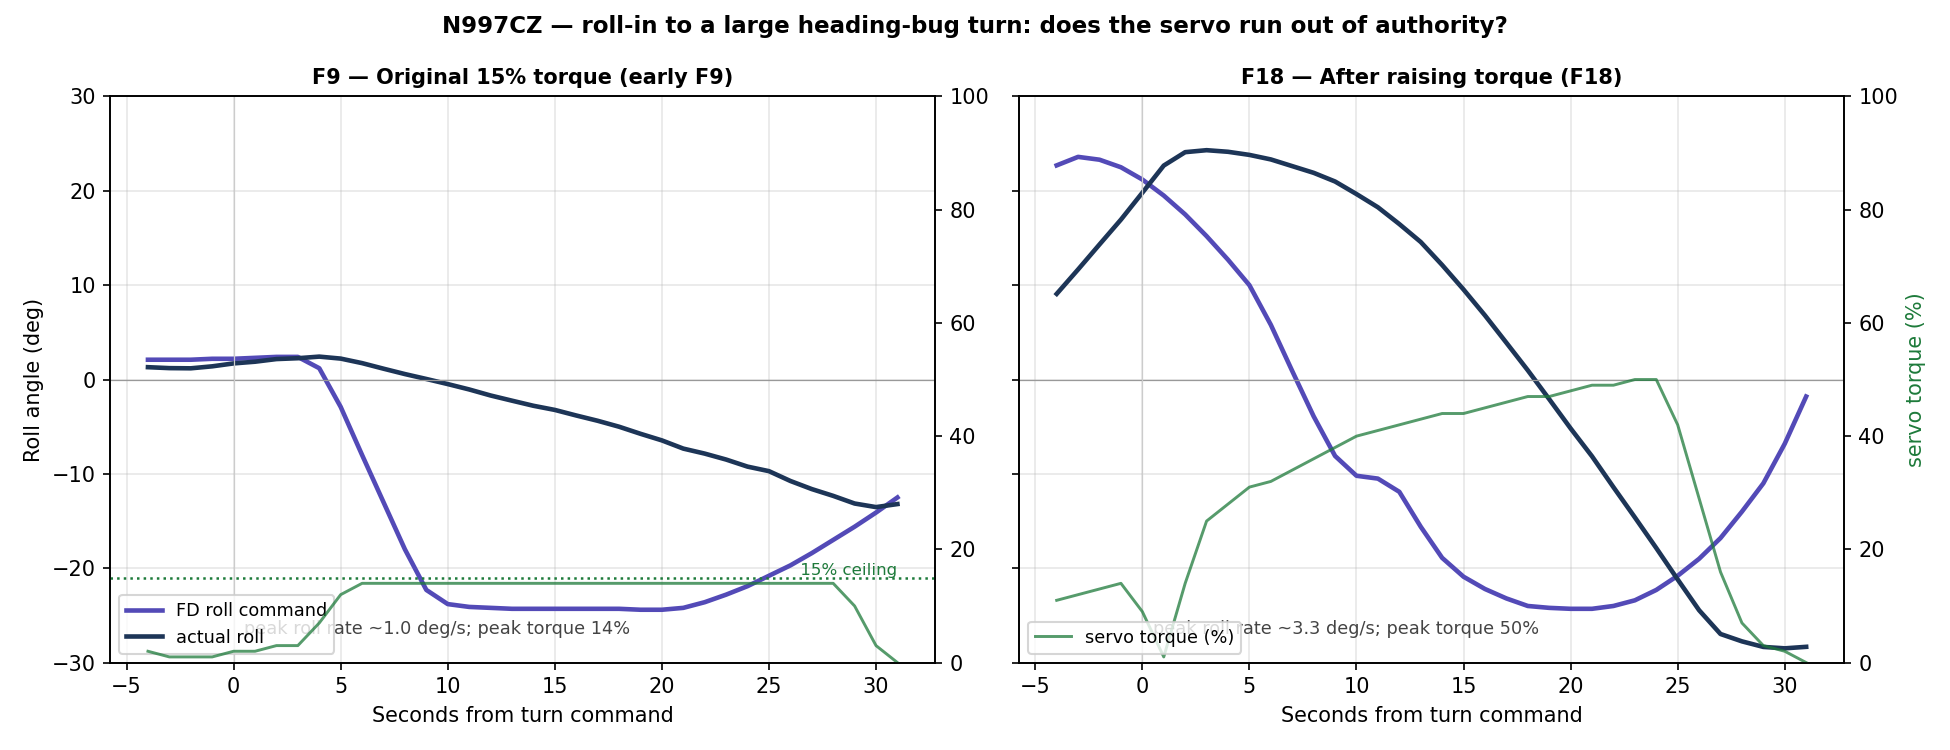
Raising the torque fixed the authority problem. But here’s the catch: at the current 90% setting the roll-in is still gentle — and when I pull the numbers, the servo is only using about 20–45% of its torque during those turns. It never gets near 90%. It’s no longer out of muscle; it has plenty in reserve and simply isn’t using it.
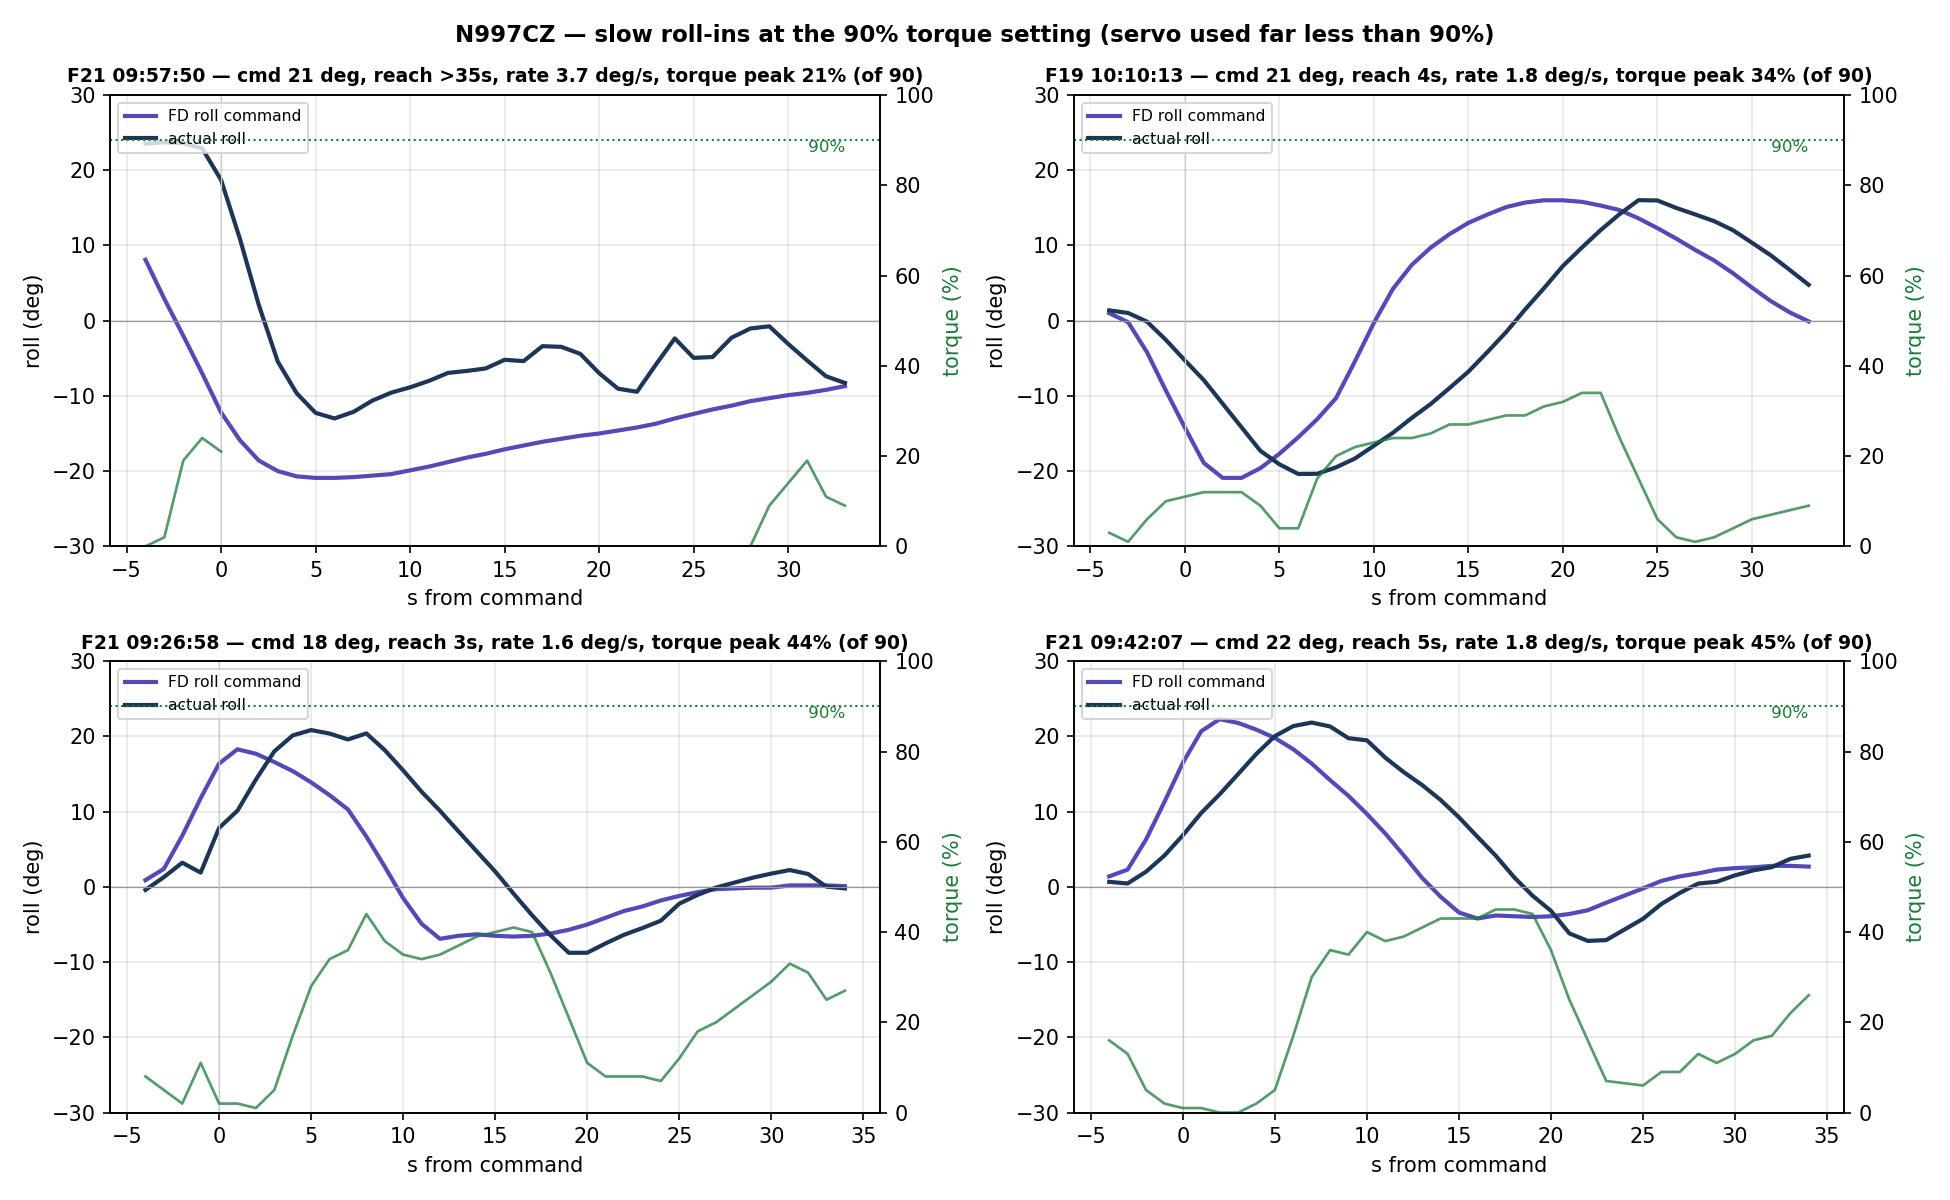
In each of these four heading-bug turns, the actual roll trails the flight director’s commanded bank by several seconds, rolling in at only ~1–3° per second — and the servo torque sits far below the 90% line the whole time. The autopilot has authority to spare and just isn’t asking for it.
The clincher is the autopilot’s torque-versus-bank-error curve. Pooling every autopilot-flown turn on the recent flights, the servo commands only about 2% torque for every degree the airplane is off the commanded bank, and it plateaus around 25% even when the wing is more than 10° from where it should be:
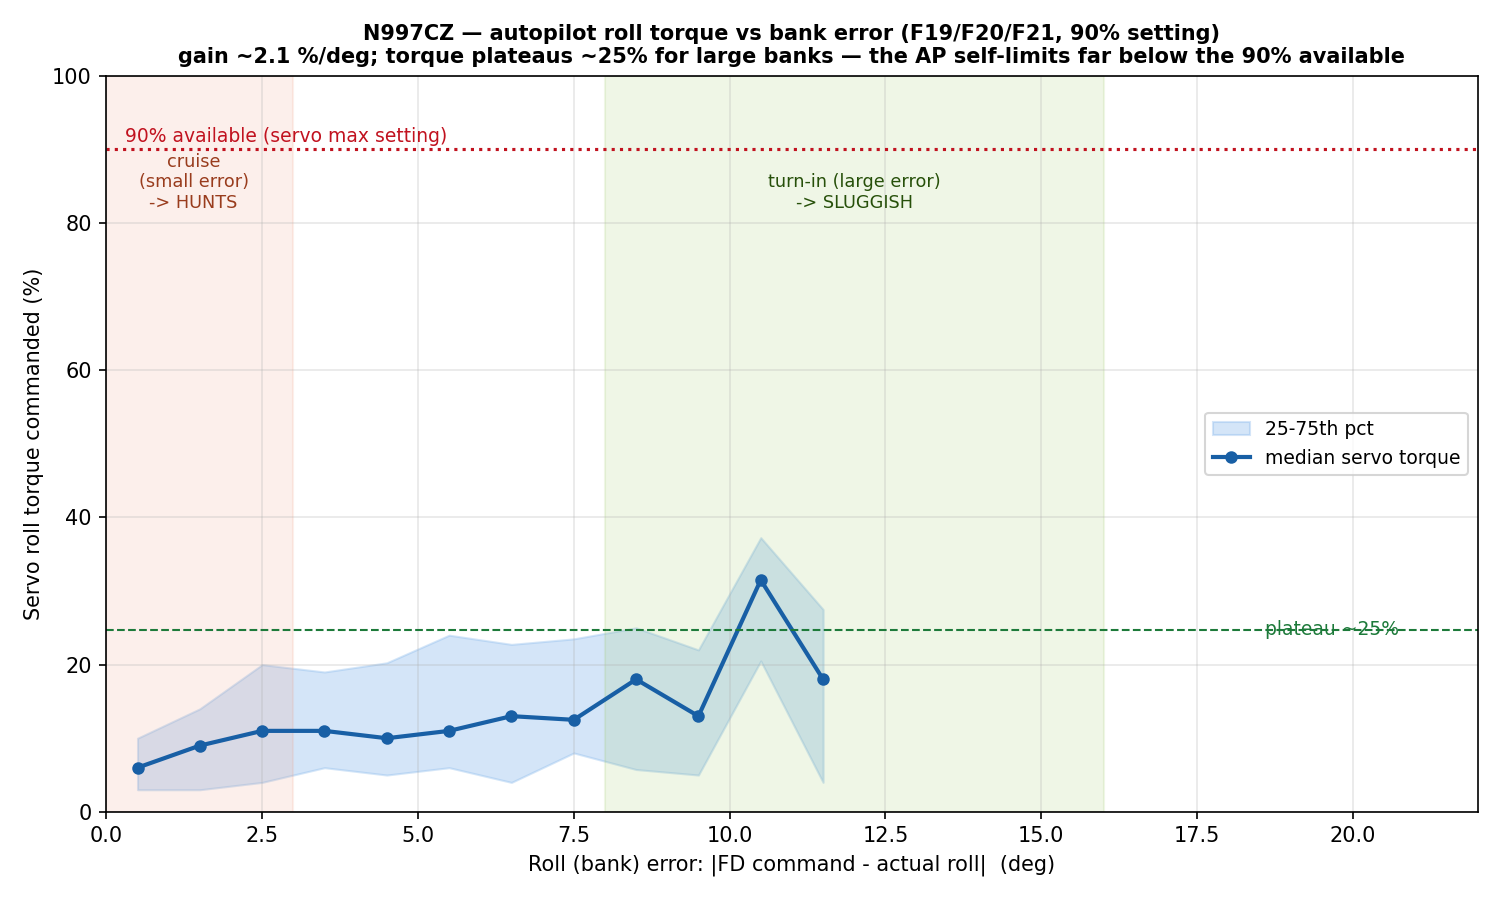
That’s the signature of a roll gain set too low — the autopilot is under-driving a servo that has torque to spare. And Garmin’s roll servo has exactly two knobs: Max Torque (the muscle, which I’d been raising) and Roll Servo Gain — literally “how aggressively the servo moves the ailerons,” adjustable from 0.05 to 10.00. Mine is sitting around 0.6, down near the bottom of the range.
So I’d been turning the wrong knob. The fix for the sluggish turns isn’t more torque, it’s more gain — telling the servo to use the authority it already has. If raising the gain doesn’t crisp up the roll-in, the next suspect is mechanical friction in the aileron circuit, which the Garmin servo can test for with a clutch-slip check.
Everything else: healthy
While I chase the autopilot tuning, the rest of the airplane turned in one of its cleaner data sets:
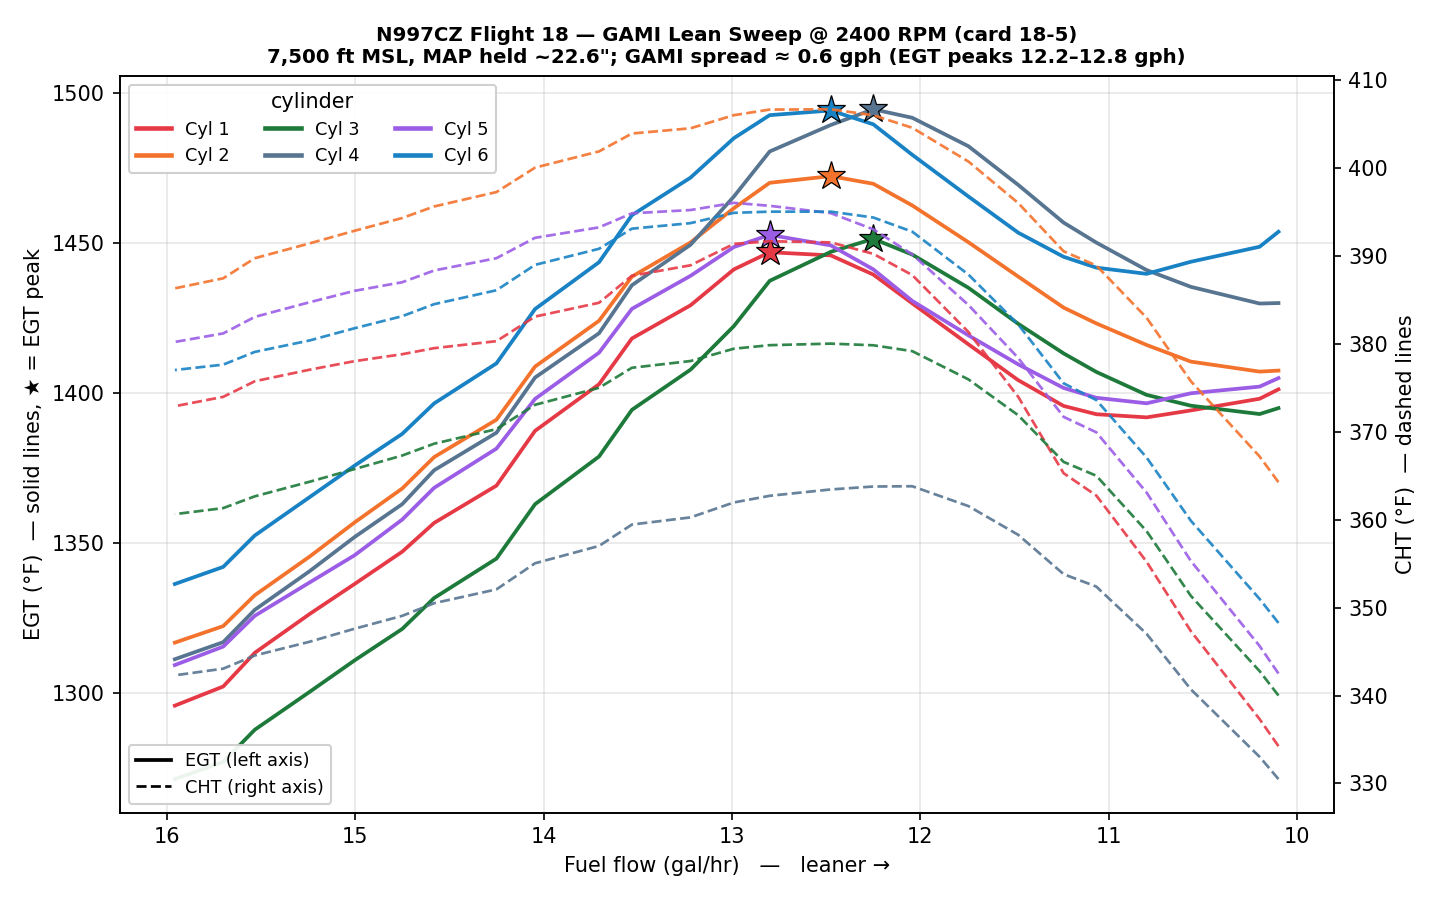
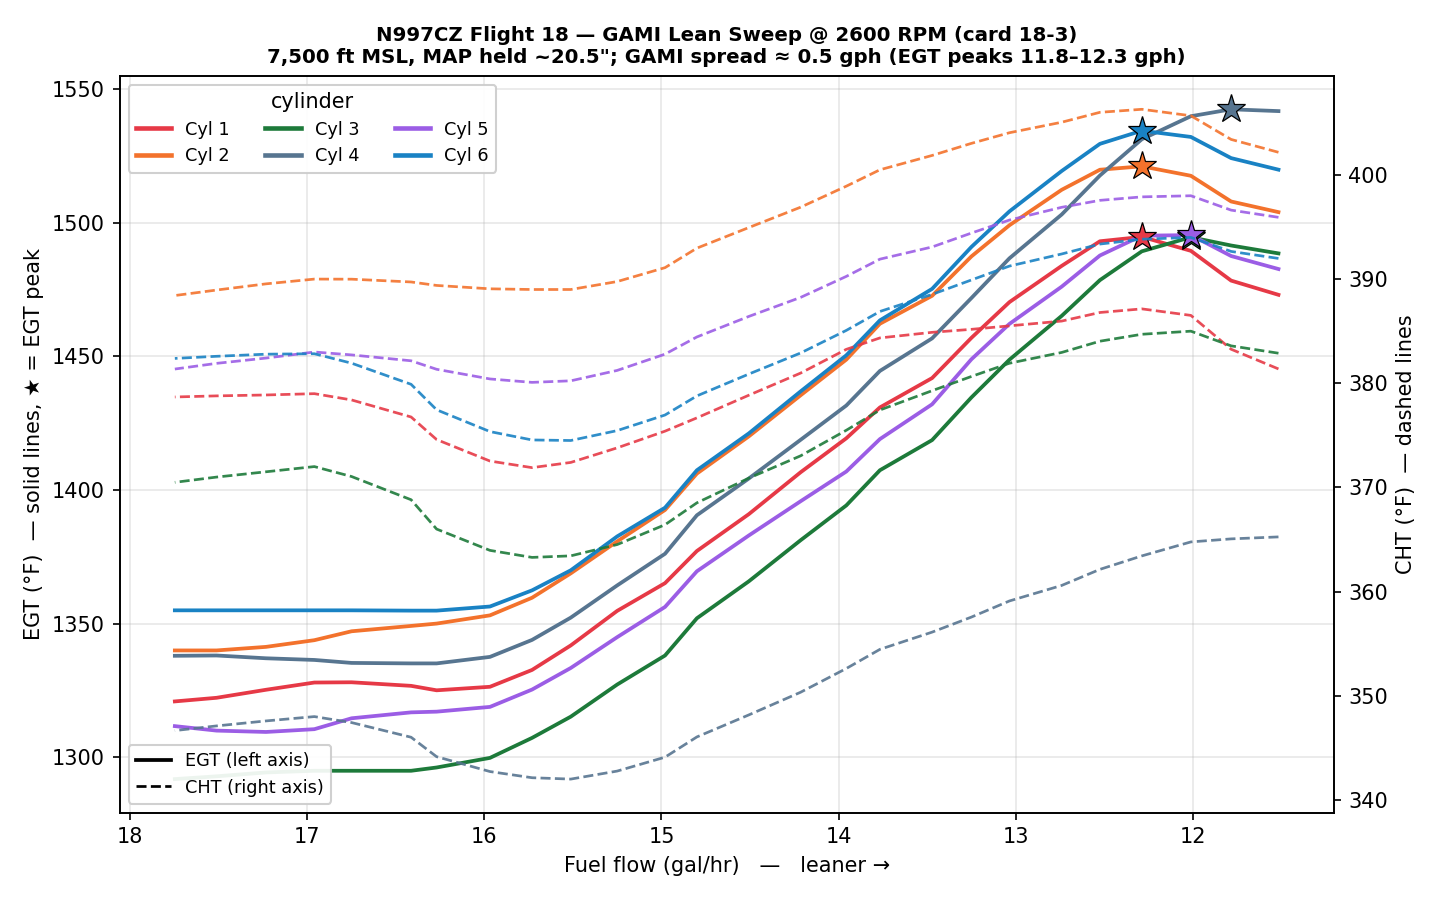
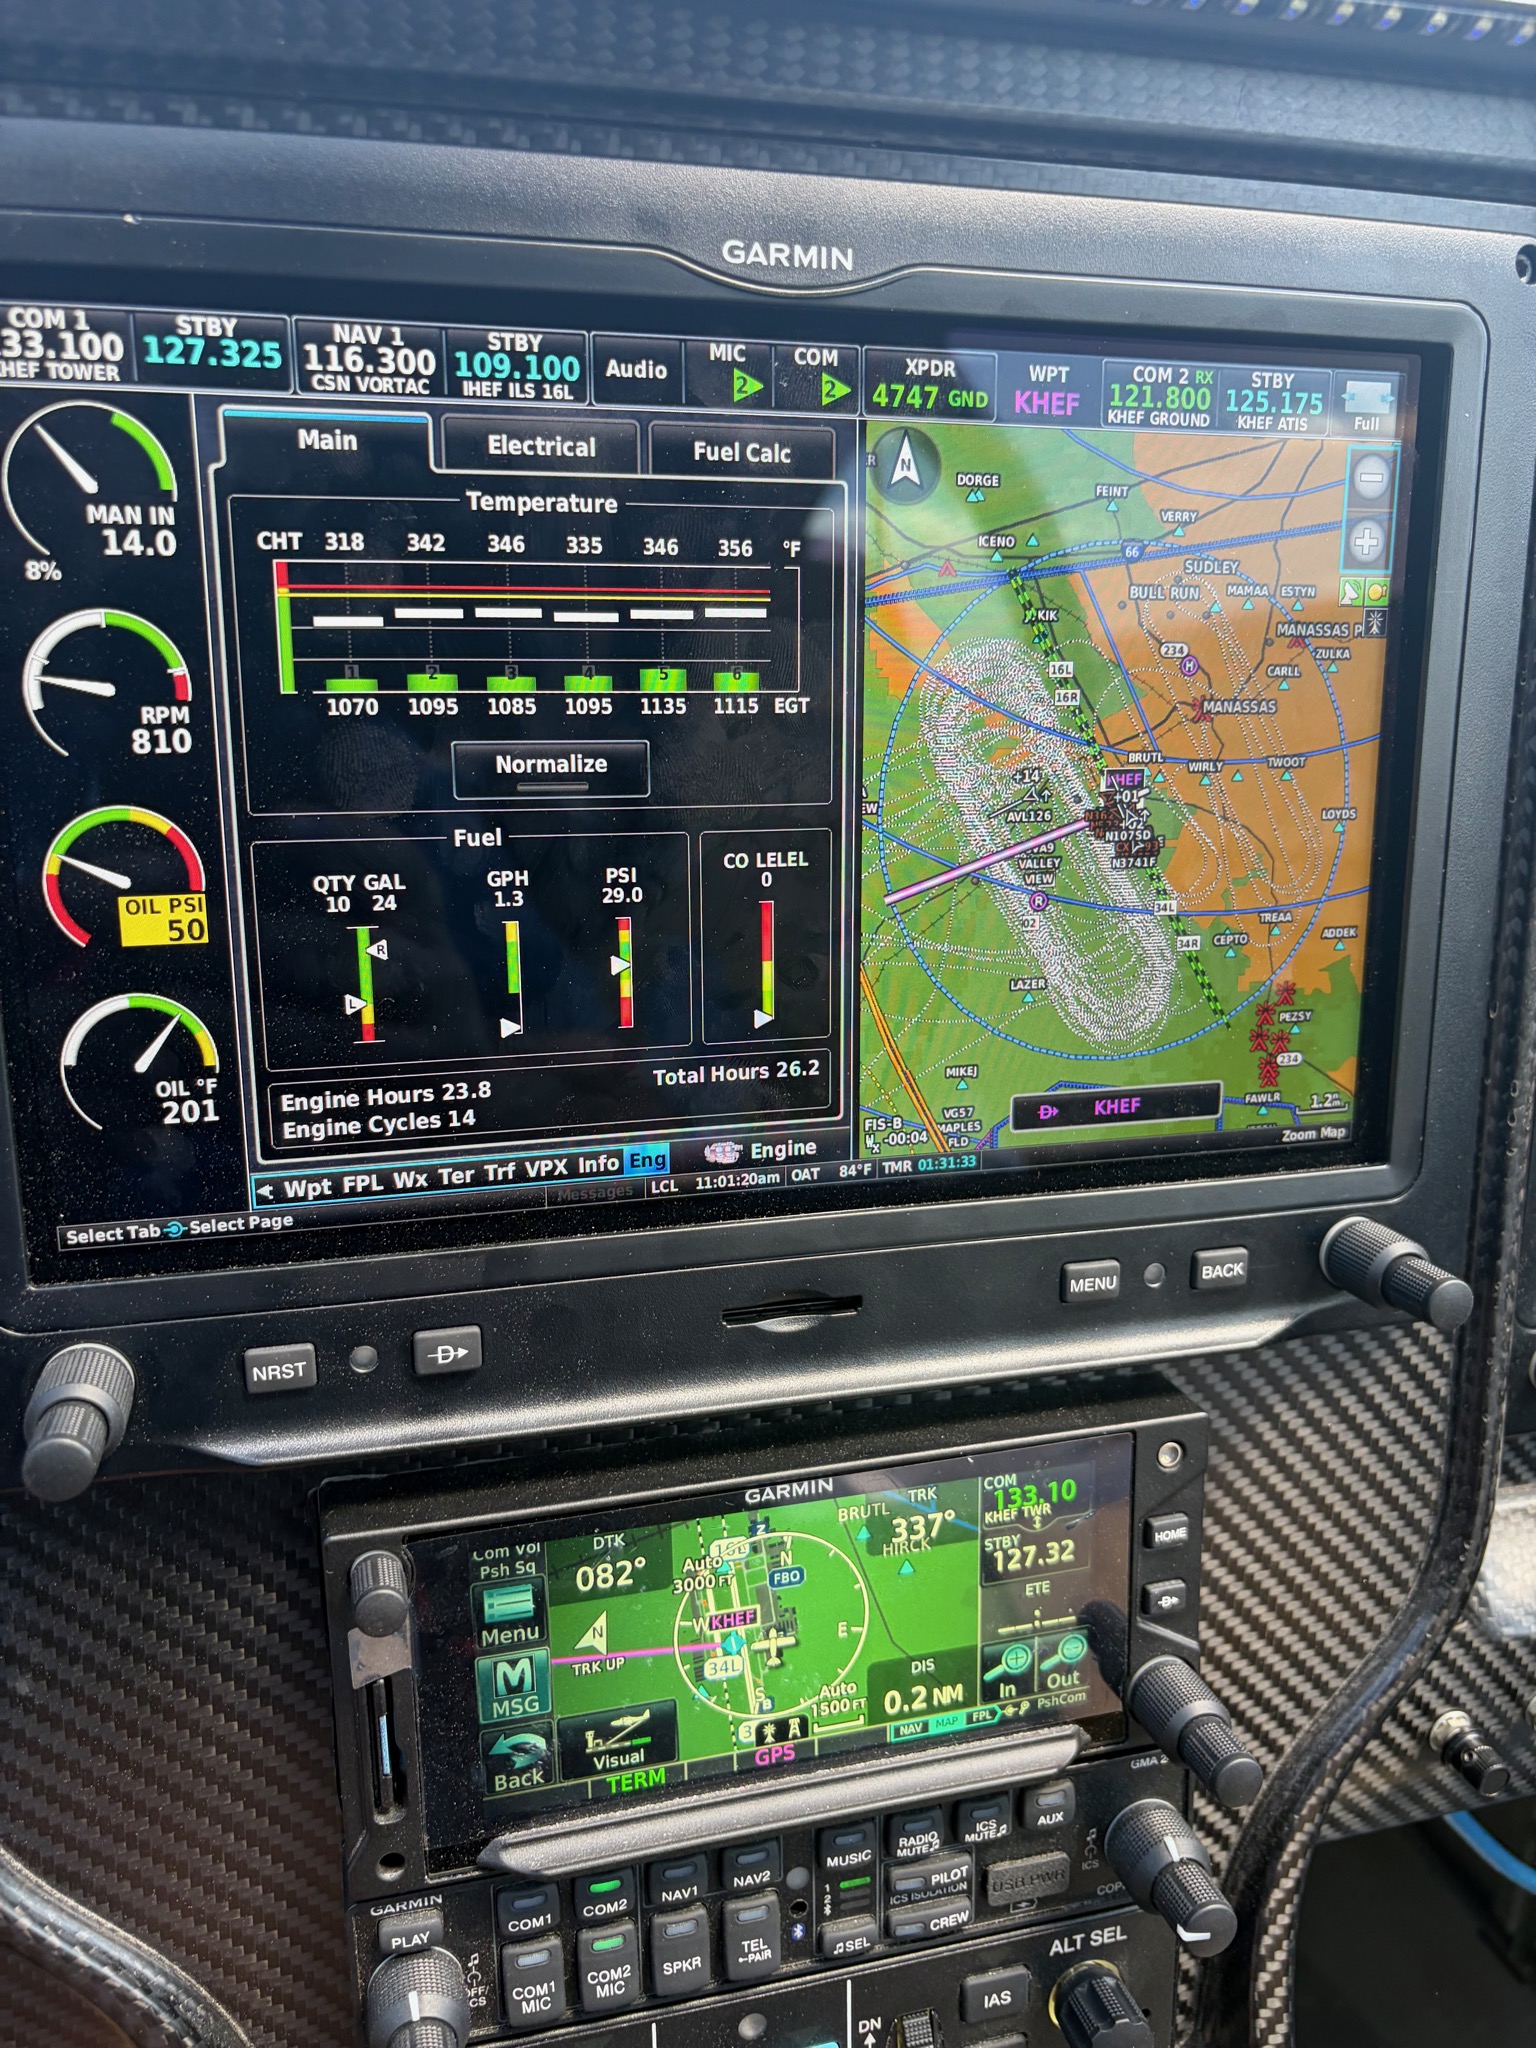
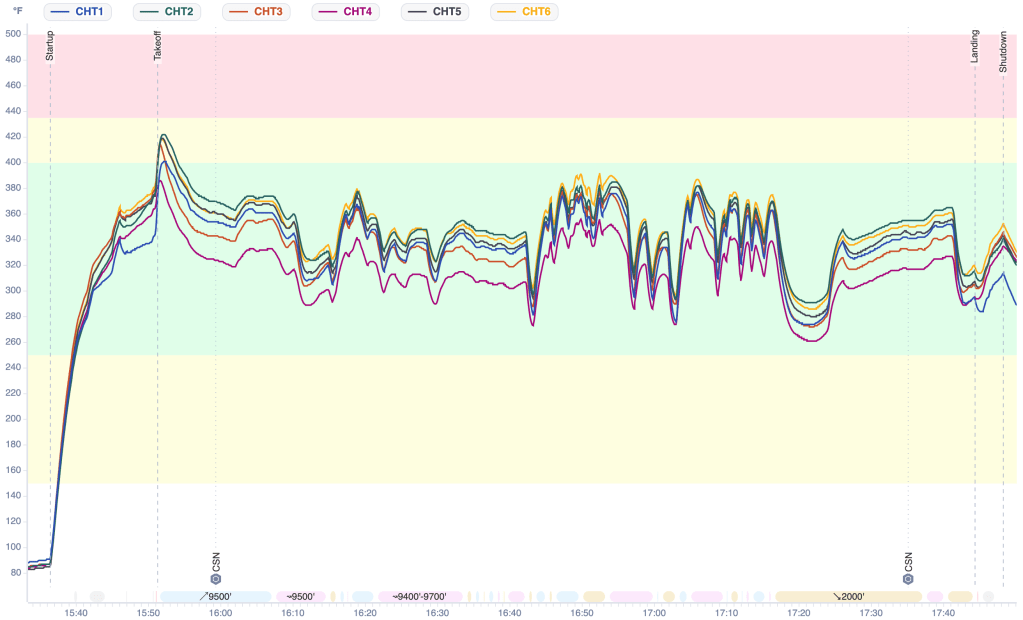
- Engine temps: the hottest cylinder head was Cylinder 5 at 416°F — still the air-dam “canary” that runs warmest in the climb — with Cylinder 4 coolest at 379°F. Everything comfortably under the 450°F redline.
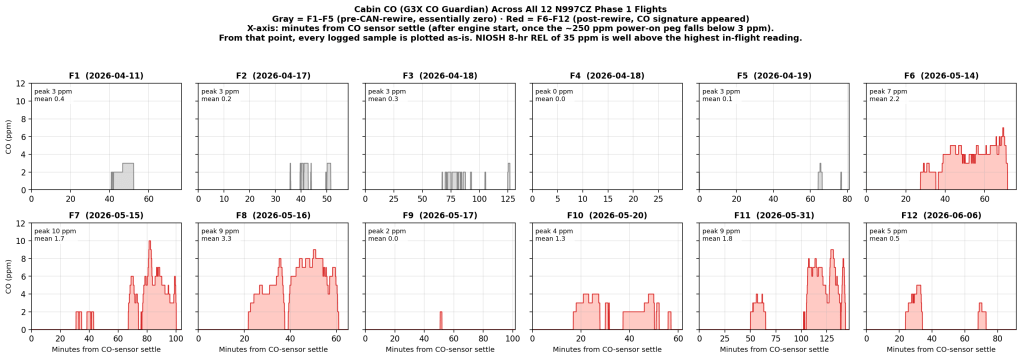
- Carbon monoxide: cabin CO peaked at 6 ppm (mean under 1) — benign, and the normal non-zero trace confirms the detector is reading correctly.
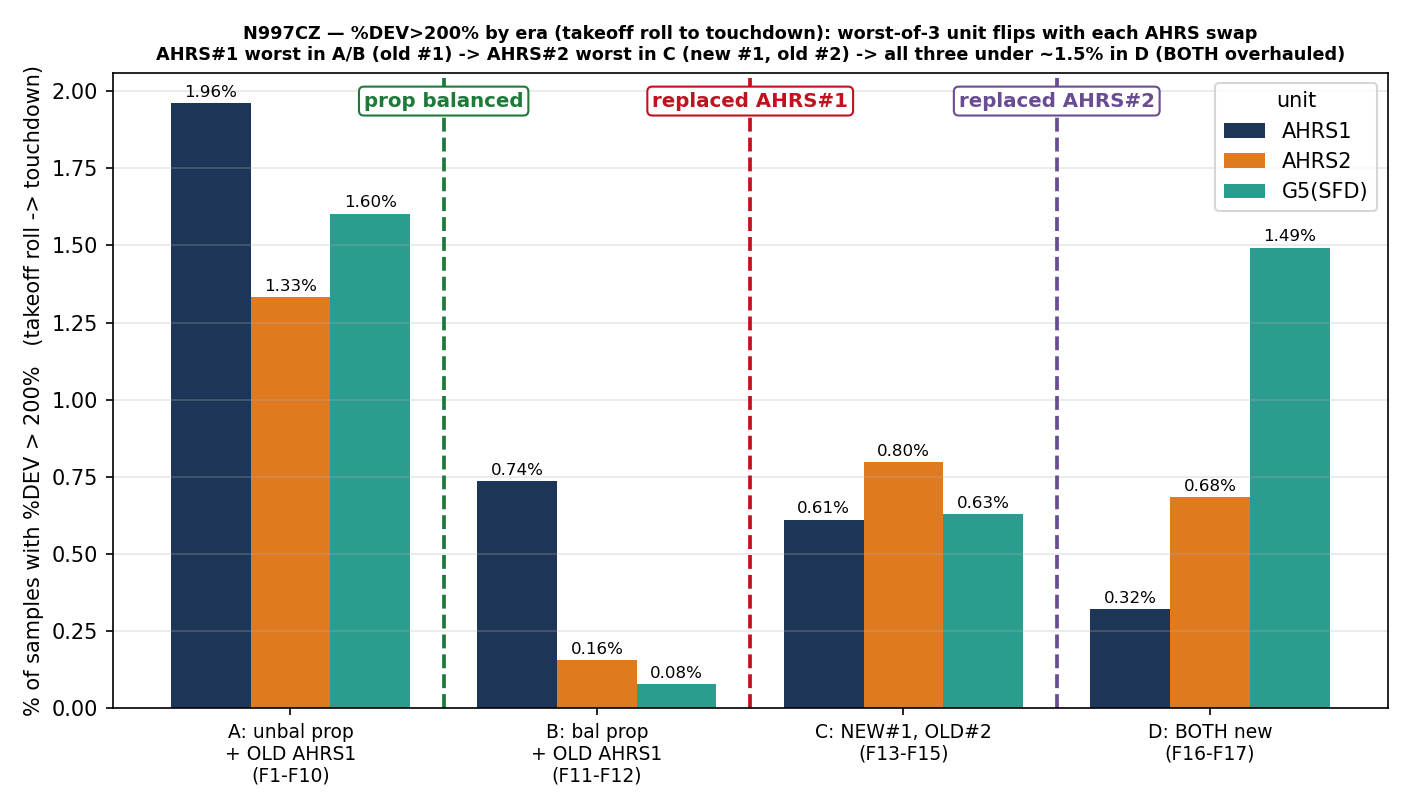
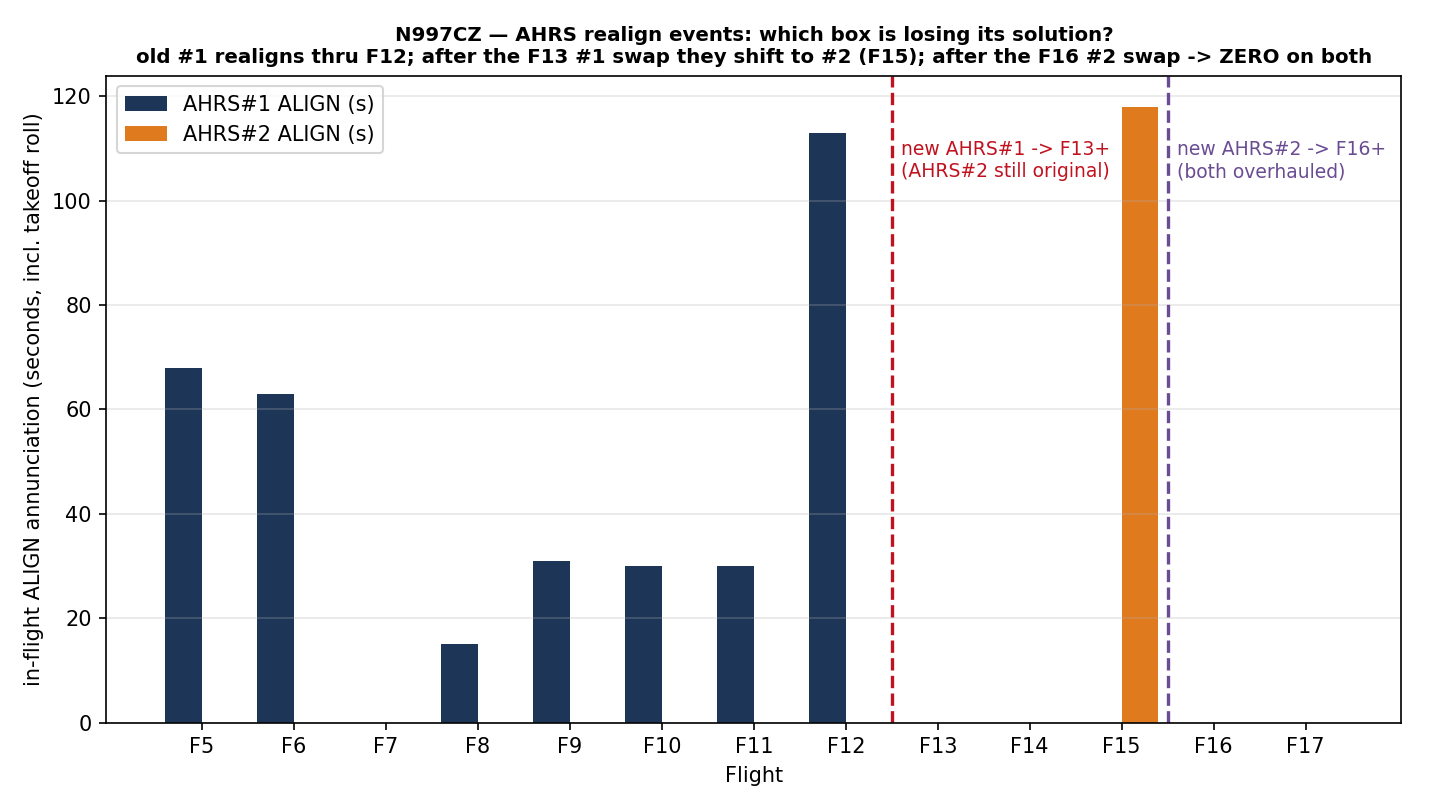
- Attitude (AHRS): rock-solid. Another flight since Garmin replaced the second AHRS — cross-unit deviations stayed under 400%, with zero of the big >500% spikes from the bad-unit era and roll disagreement never over 2.3°. The roll squawk is an autopilot-tuning issue, not an attitude-sensing one — the AHRS knew exactly where the wing was.
Bottom line
Flight 19’s headline is a course correction, not a triumph: I’d been adding torque to a roll autopilot that was actually short on gain. The servo has muscle to spare — it uses only a quarter of what’s available — and just needs to be told to use it. So the next session is about raising the Roll Servo Gain a few steps at a time (Garmin’s in-air method: overpower the autopilot off the commanded bank, release, and watch how crisply it drives back), leaving the torque where it is. Engine, fuel, CO, and the overhauled attitude system all came home clean. Thanks to Harry for the stick time and the careful notes that made this one easy to pin down.