N997CZ — Dynamic Prop Balancing: 0.57 IPS Down to 0.01

After the first five flights it was clear that N997CZ was sitting on more vibration than I wanted. The most visible symptom was the ADAHRS percent-deviation values logged by the G3X — they were chronically high during cruise on every one of the first five flights, and Garmin tech support had pointed out that high deviation values are often a sign that the attitude solution is fighting more vibration than it wants to. So when the airplane went into the hangar for the 25-day maintenance gap between Flight 5 and Flight 6, dynamic propeller balancing was one of three jobs on the list (alongside the CAN bus rewire and the left fuel-gauge float fix).

This is the story of that balance.

What dynamic propeller balancing actually is

Static balance — the kind you can do with the prop off the airplane on a balance stand — gets the prop to the point where it doesn’t have a preferred resting position. Dynamic balance is the next step: it deals with the residual imbalance that only shows up when the engine and prop are running at their actual operating RPM, with the actual installed combination of crank, flywheel, starter ring, spinner, and prop all spinning together as one mass.

The DynaVibe Classic balancer (RPX Technologies) does it with two sensors:

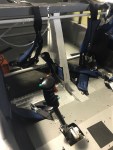
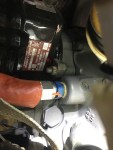
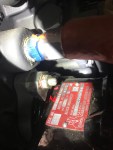
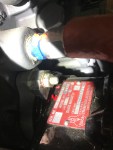
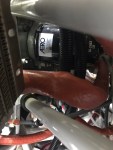
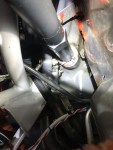
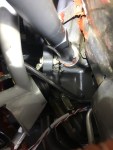
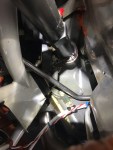
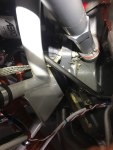
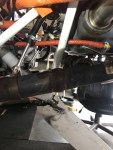
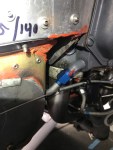
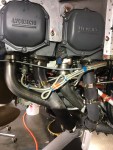
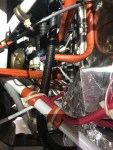
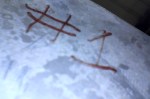
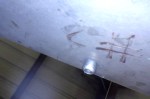
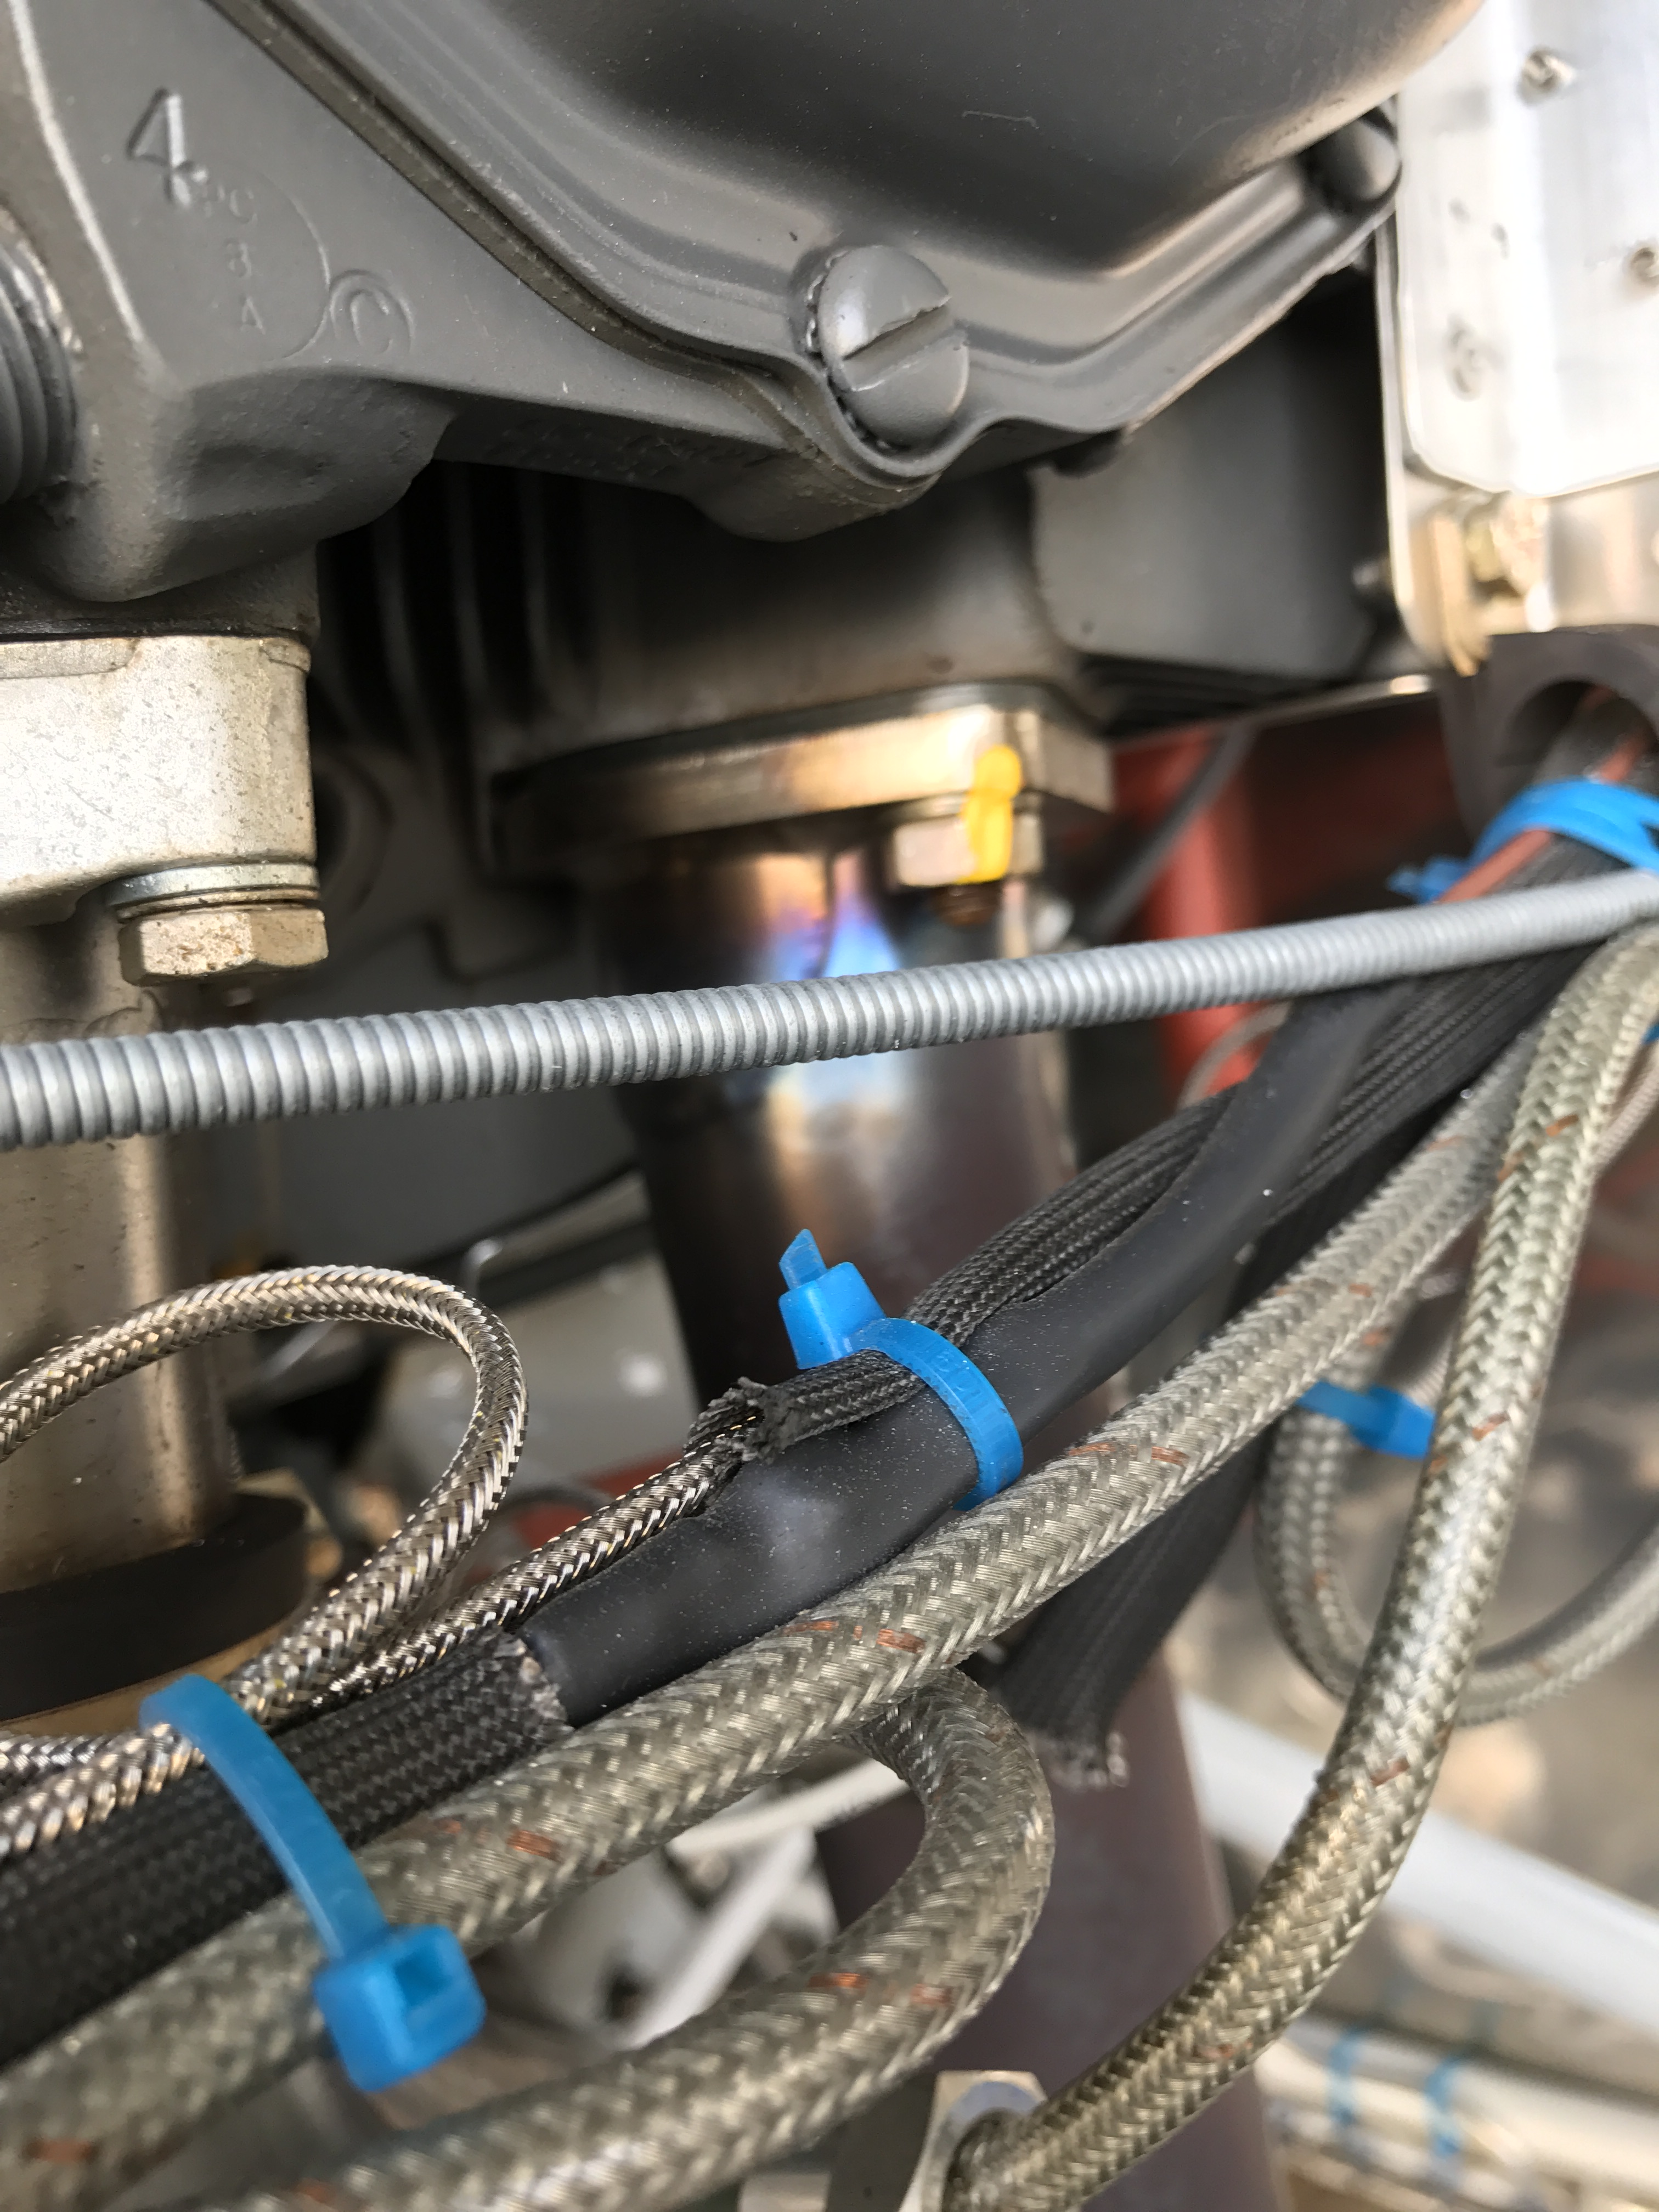
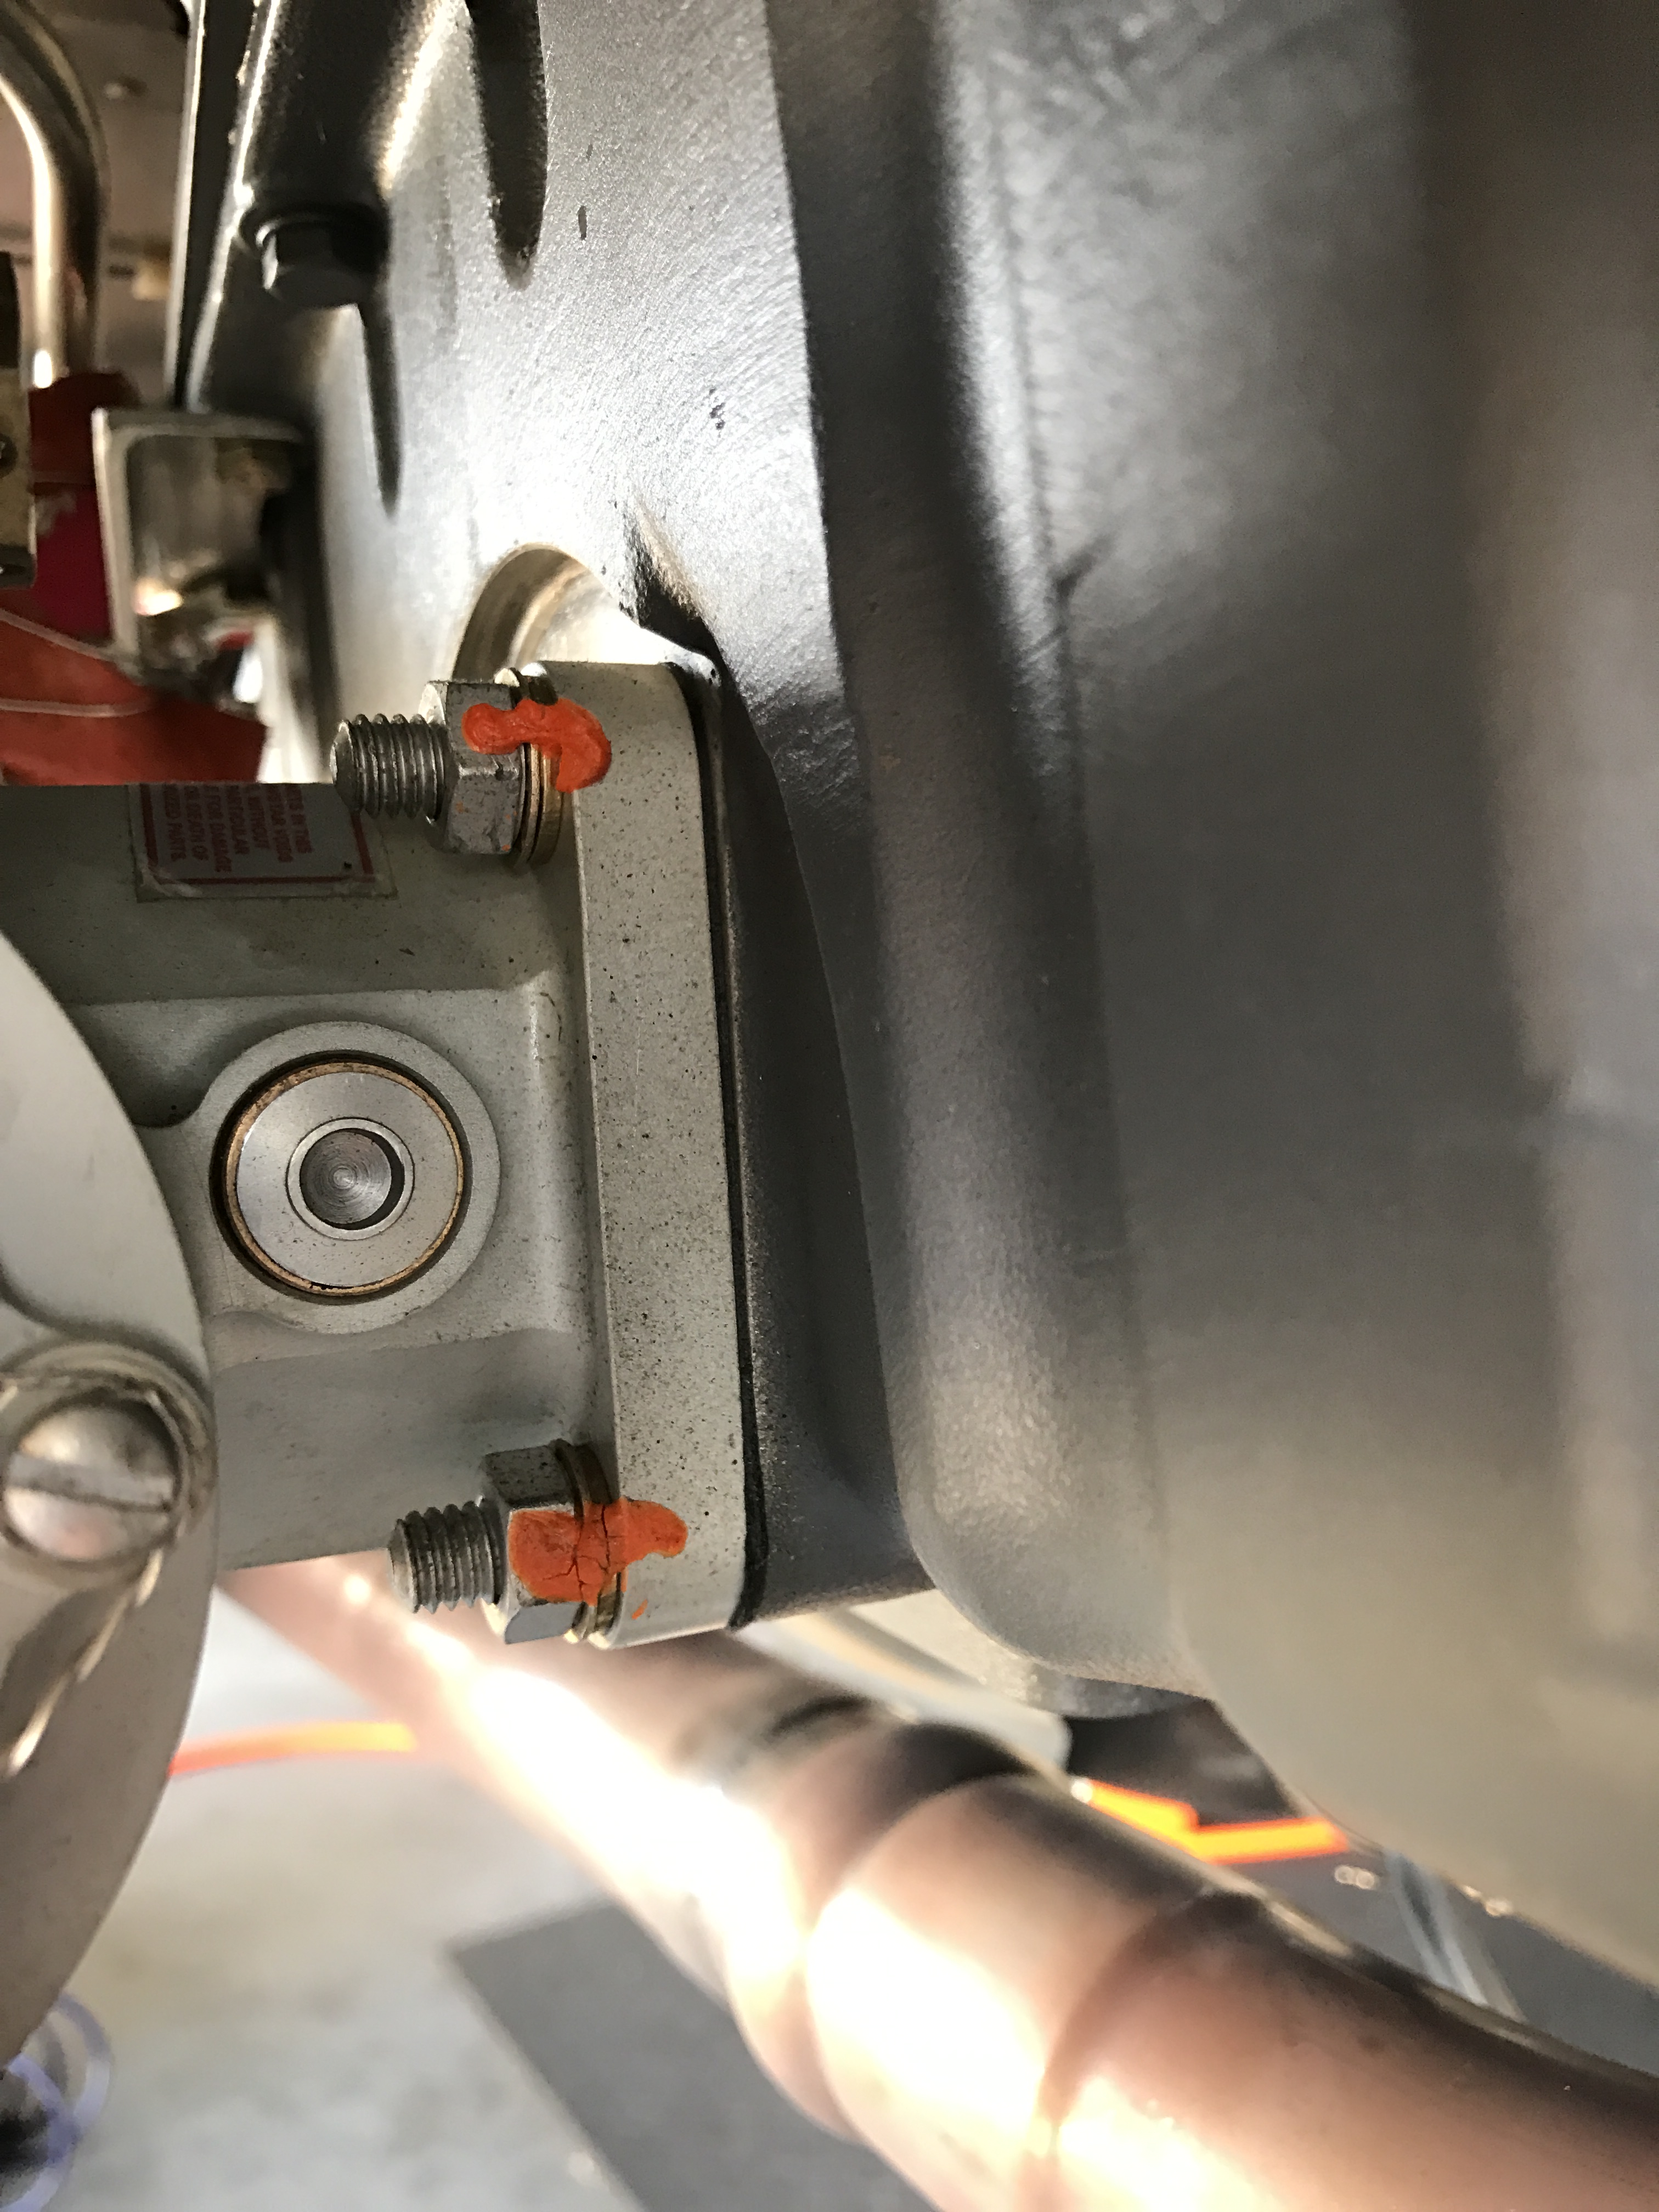
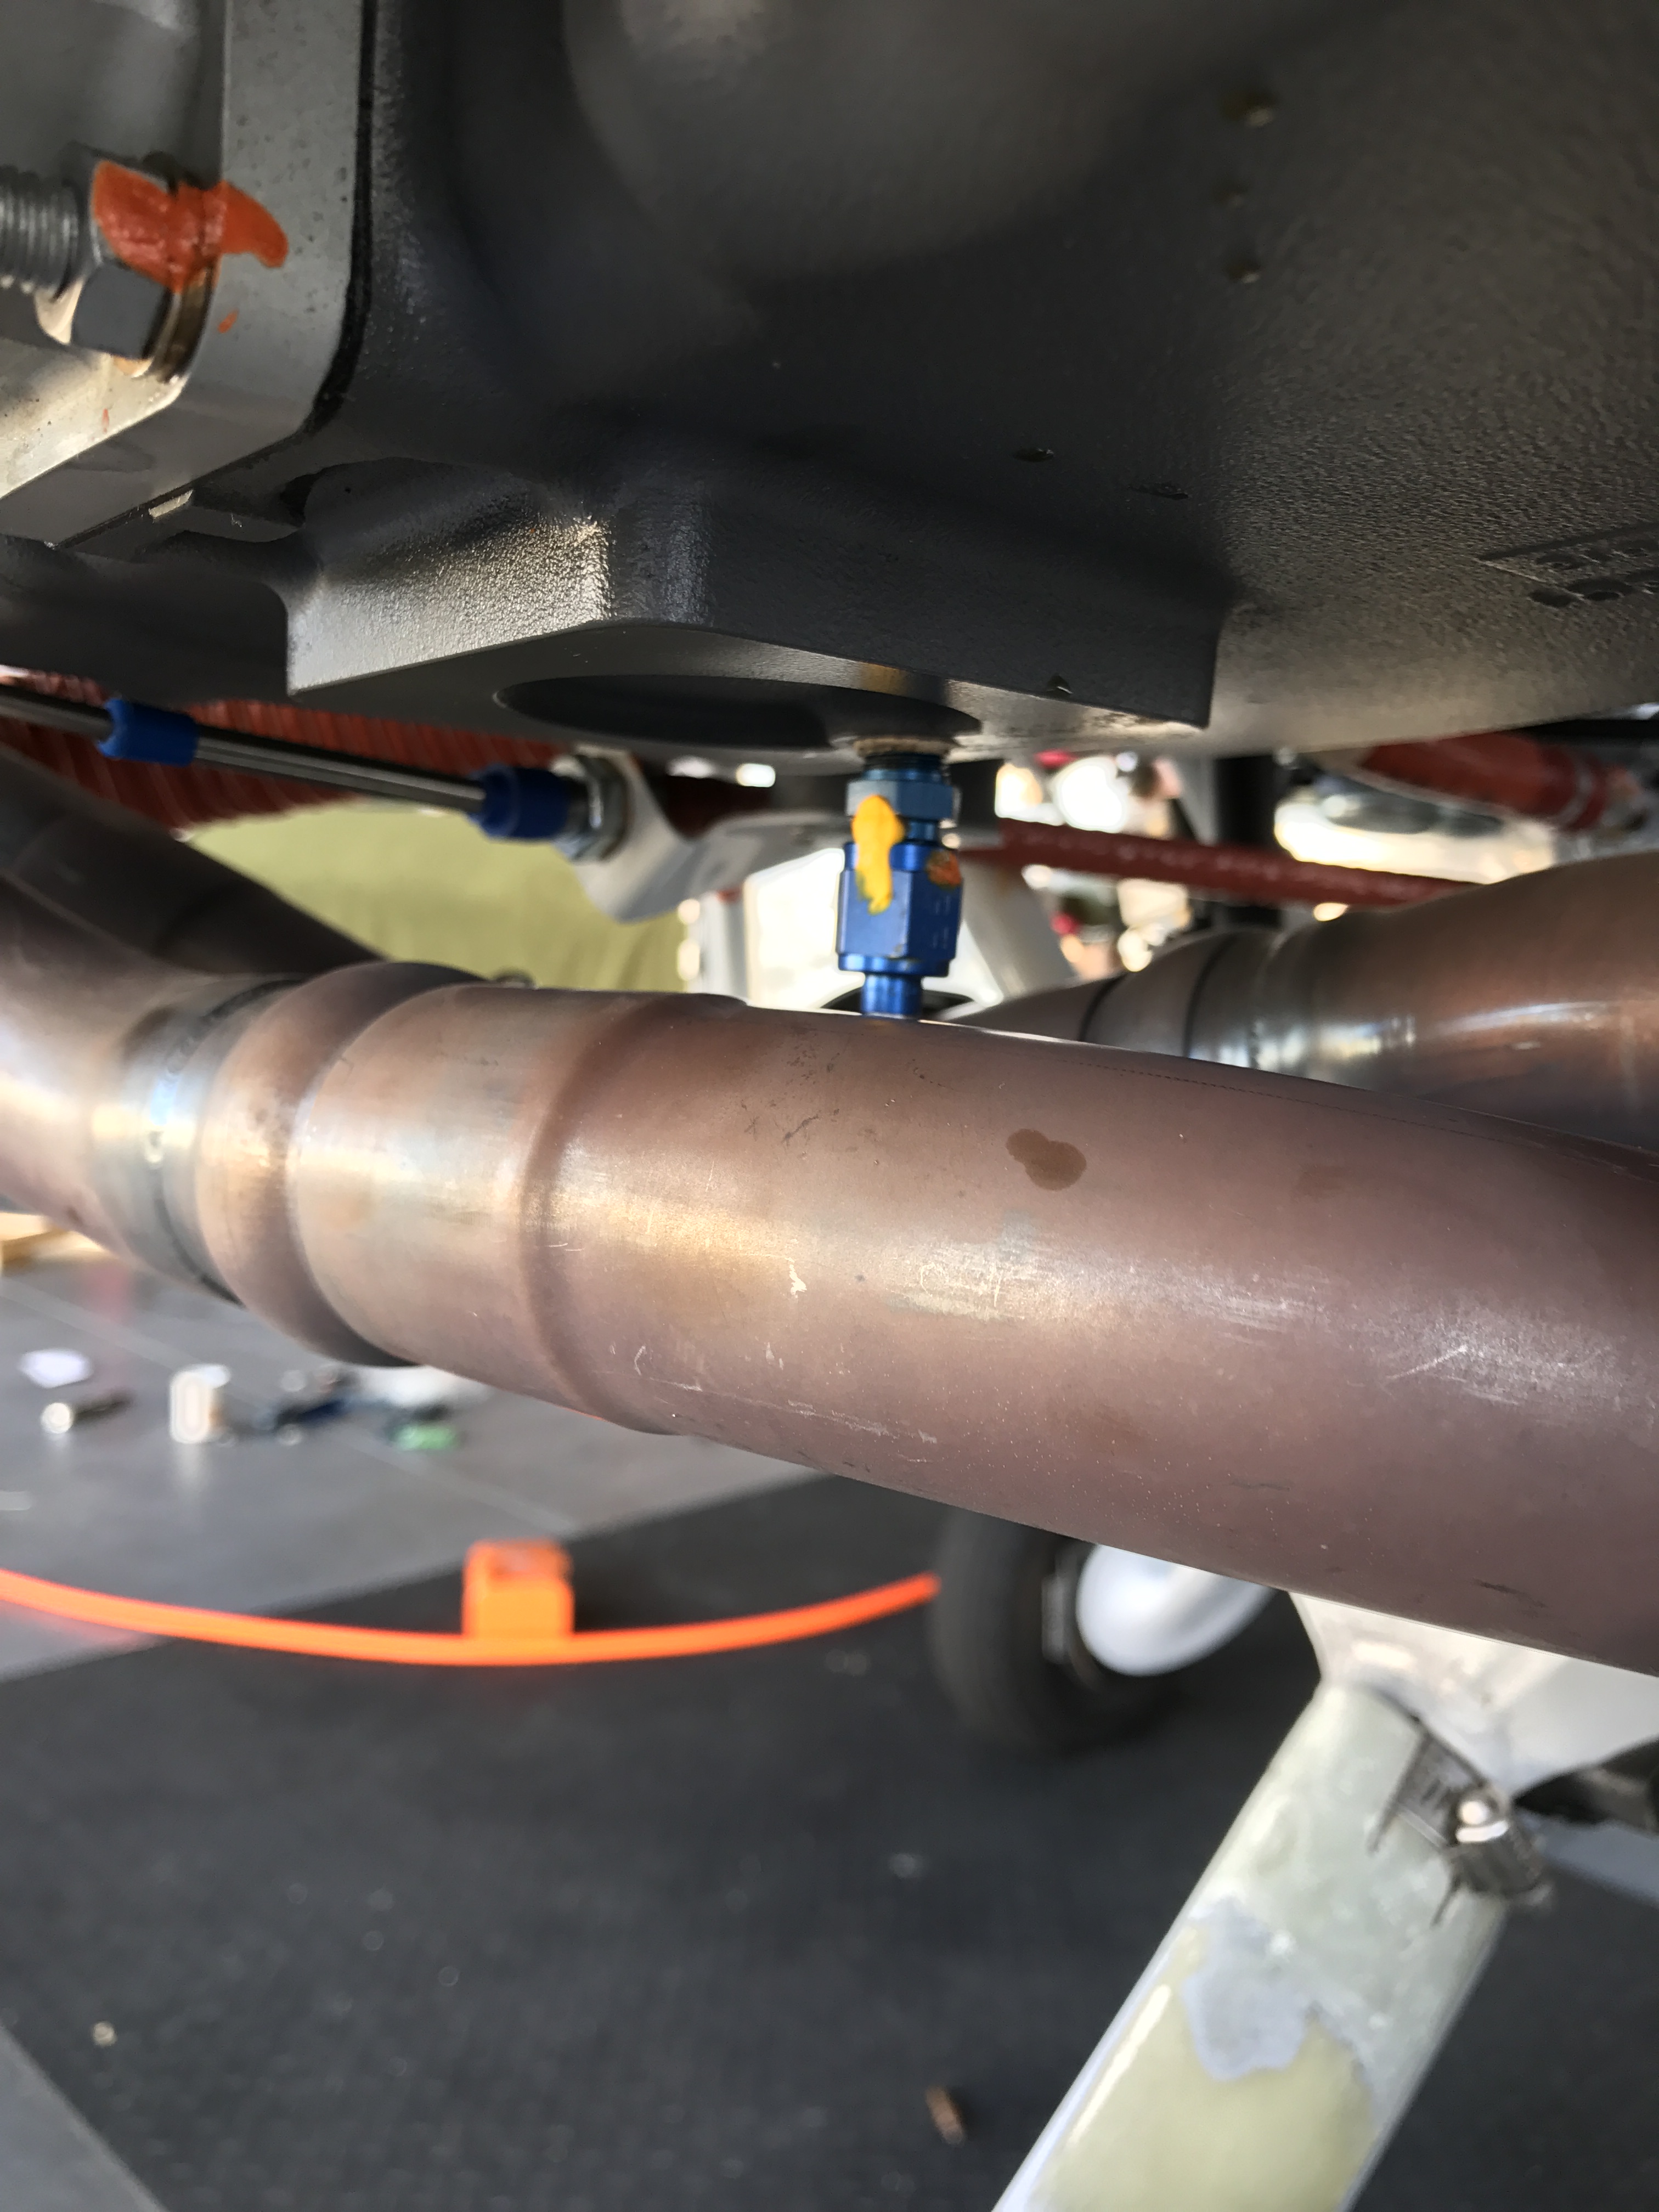
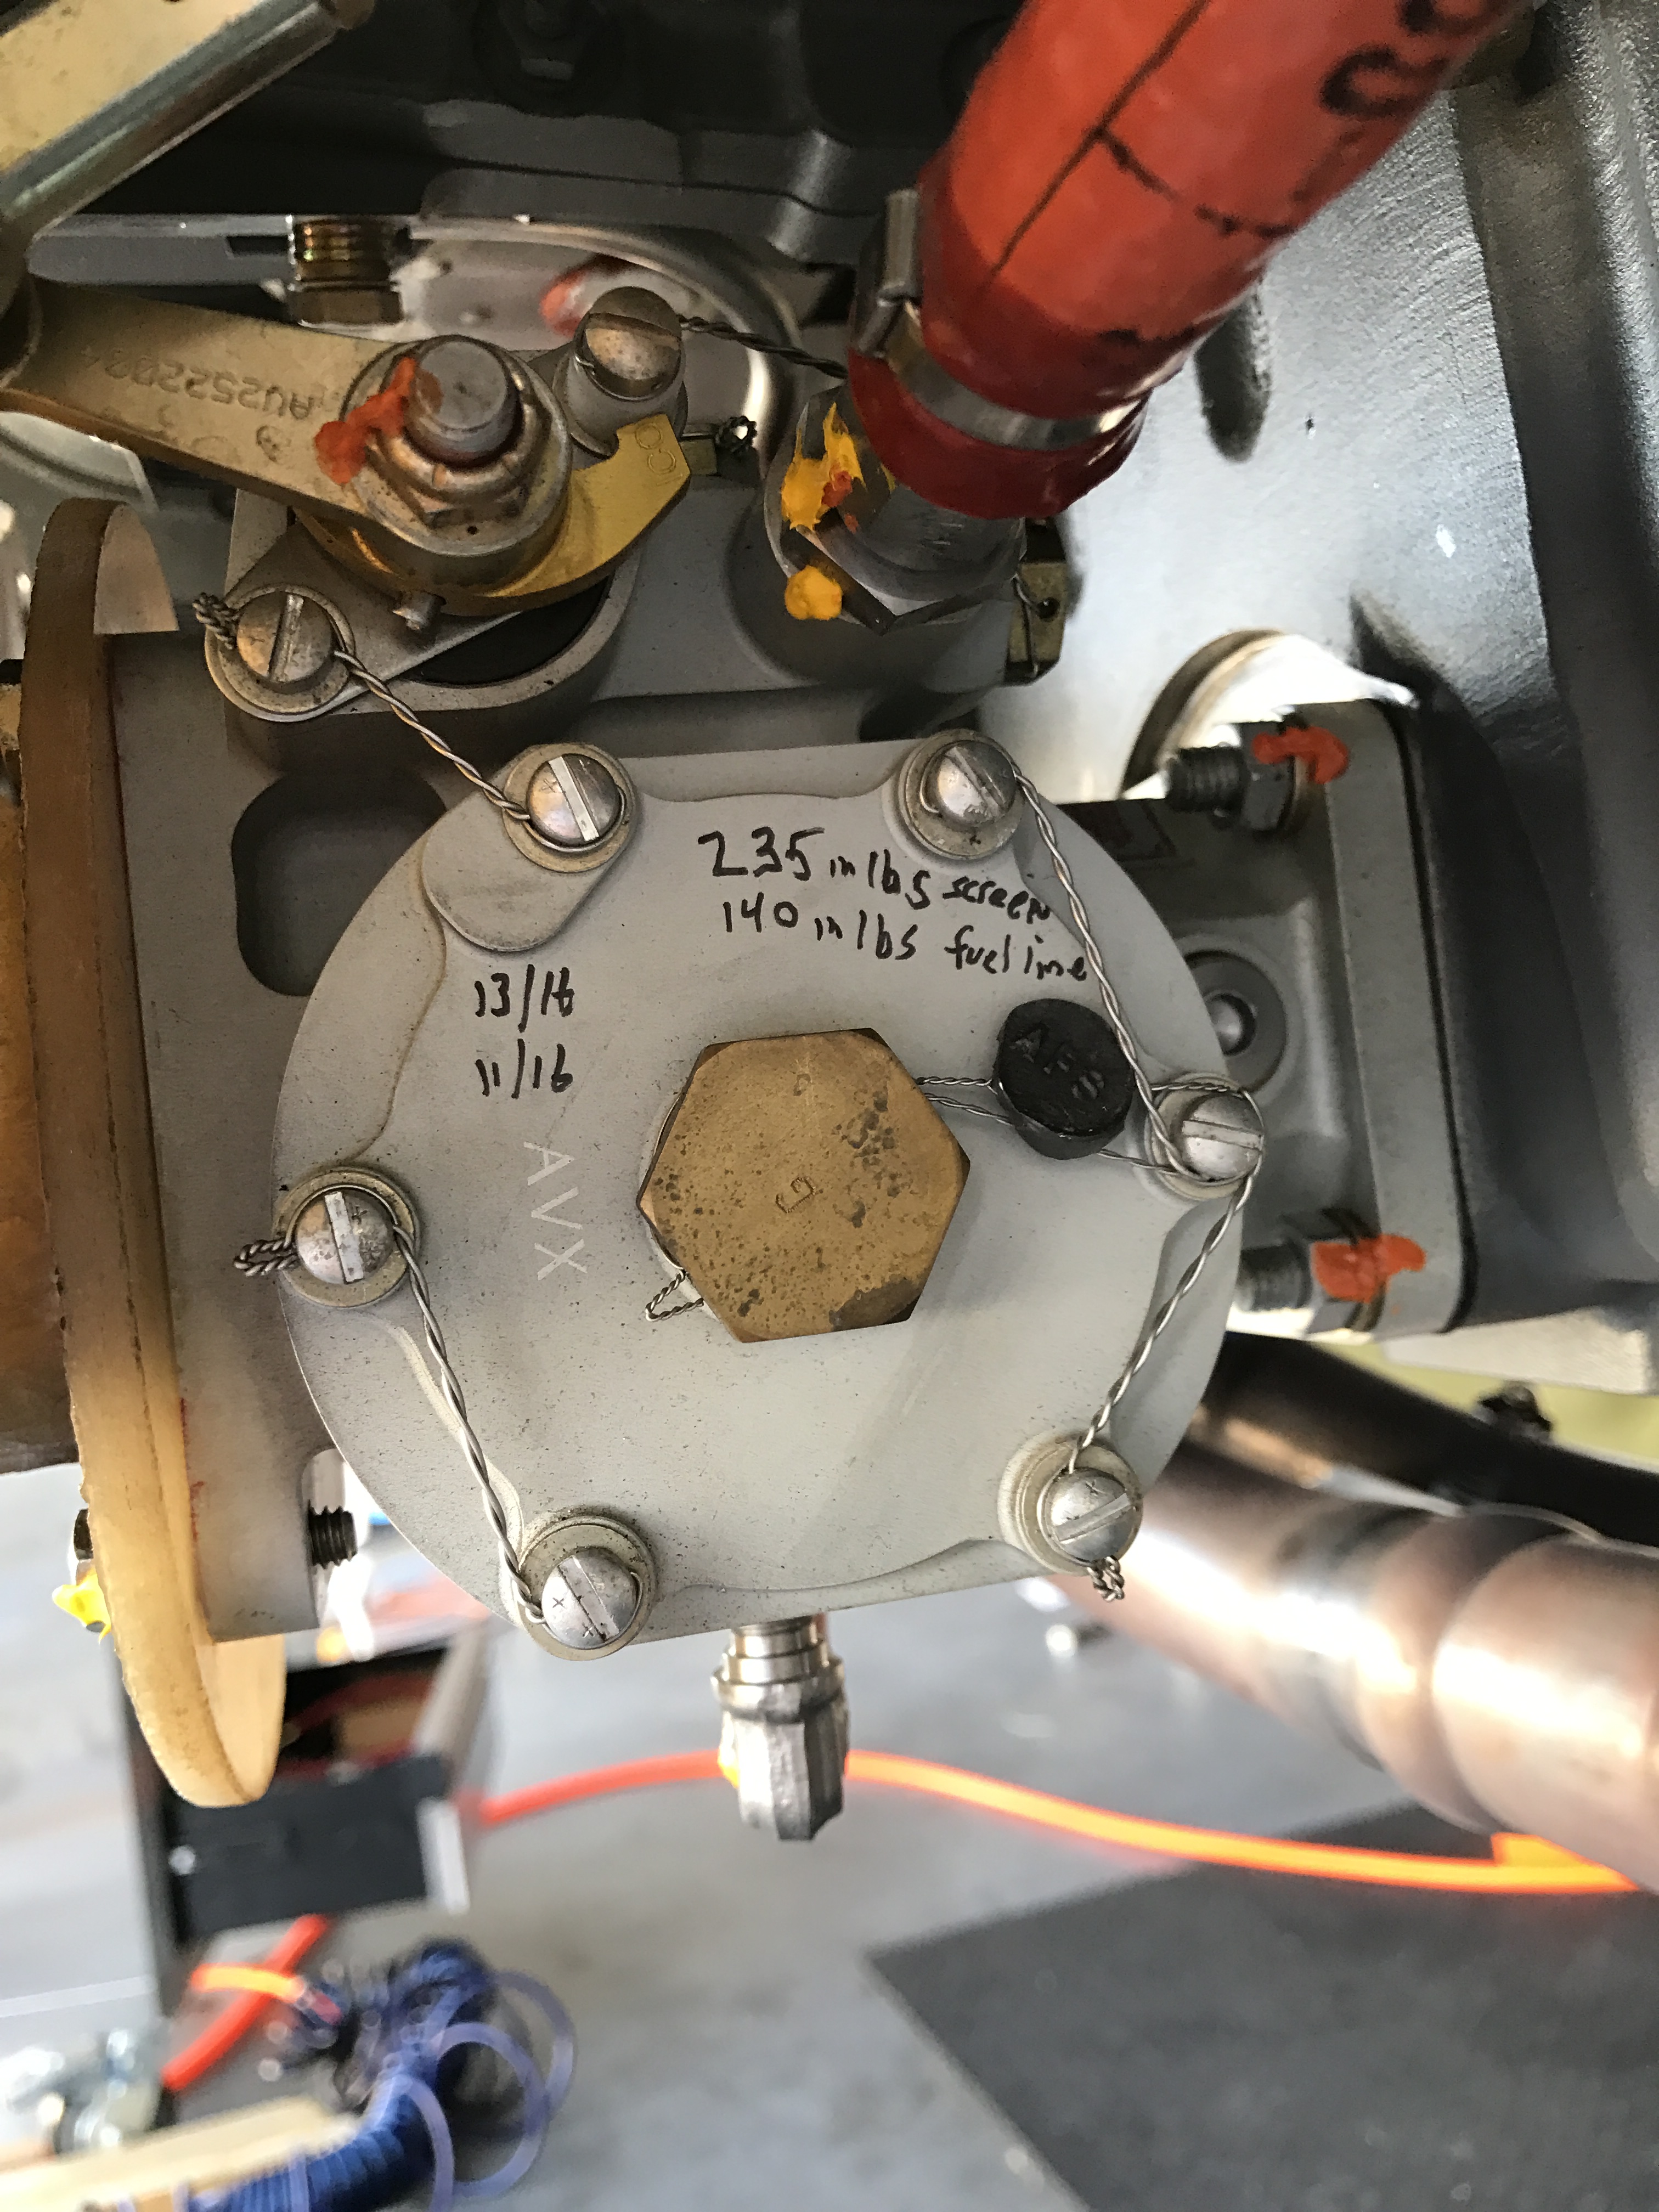
  • An accelerometer bolted to the top of the engine case, “as far forward as possible for maximum sensitivity… mounted vertically, perpendicular to piston travel.” The standard technique is to pull one of the case bolts along the top of the engine and reinstall it through the bracket that holds the accelerometer.
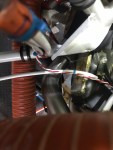
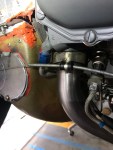
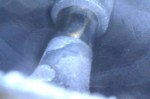
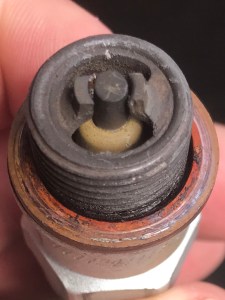
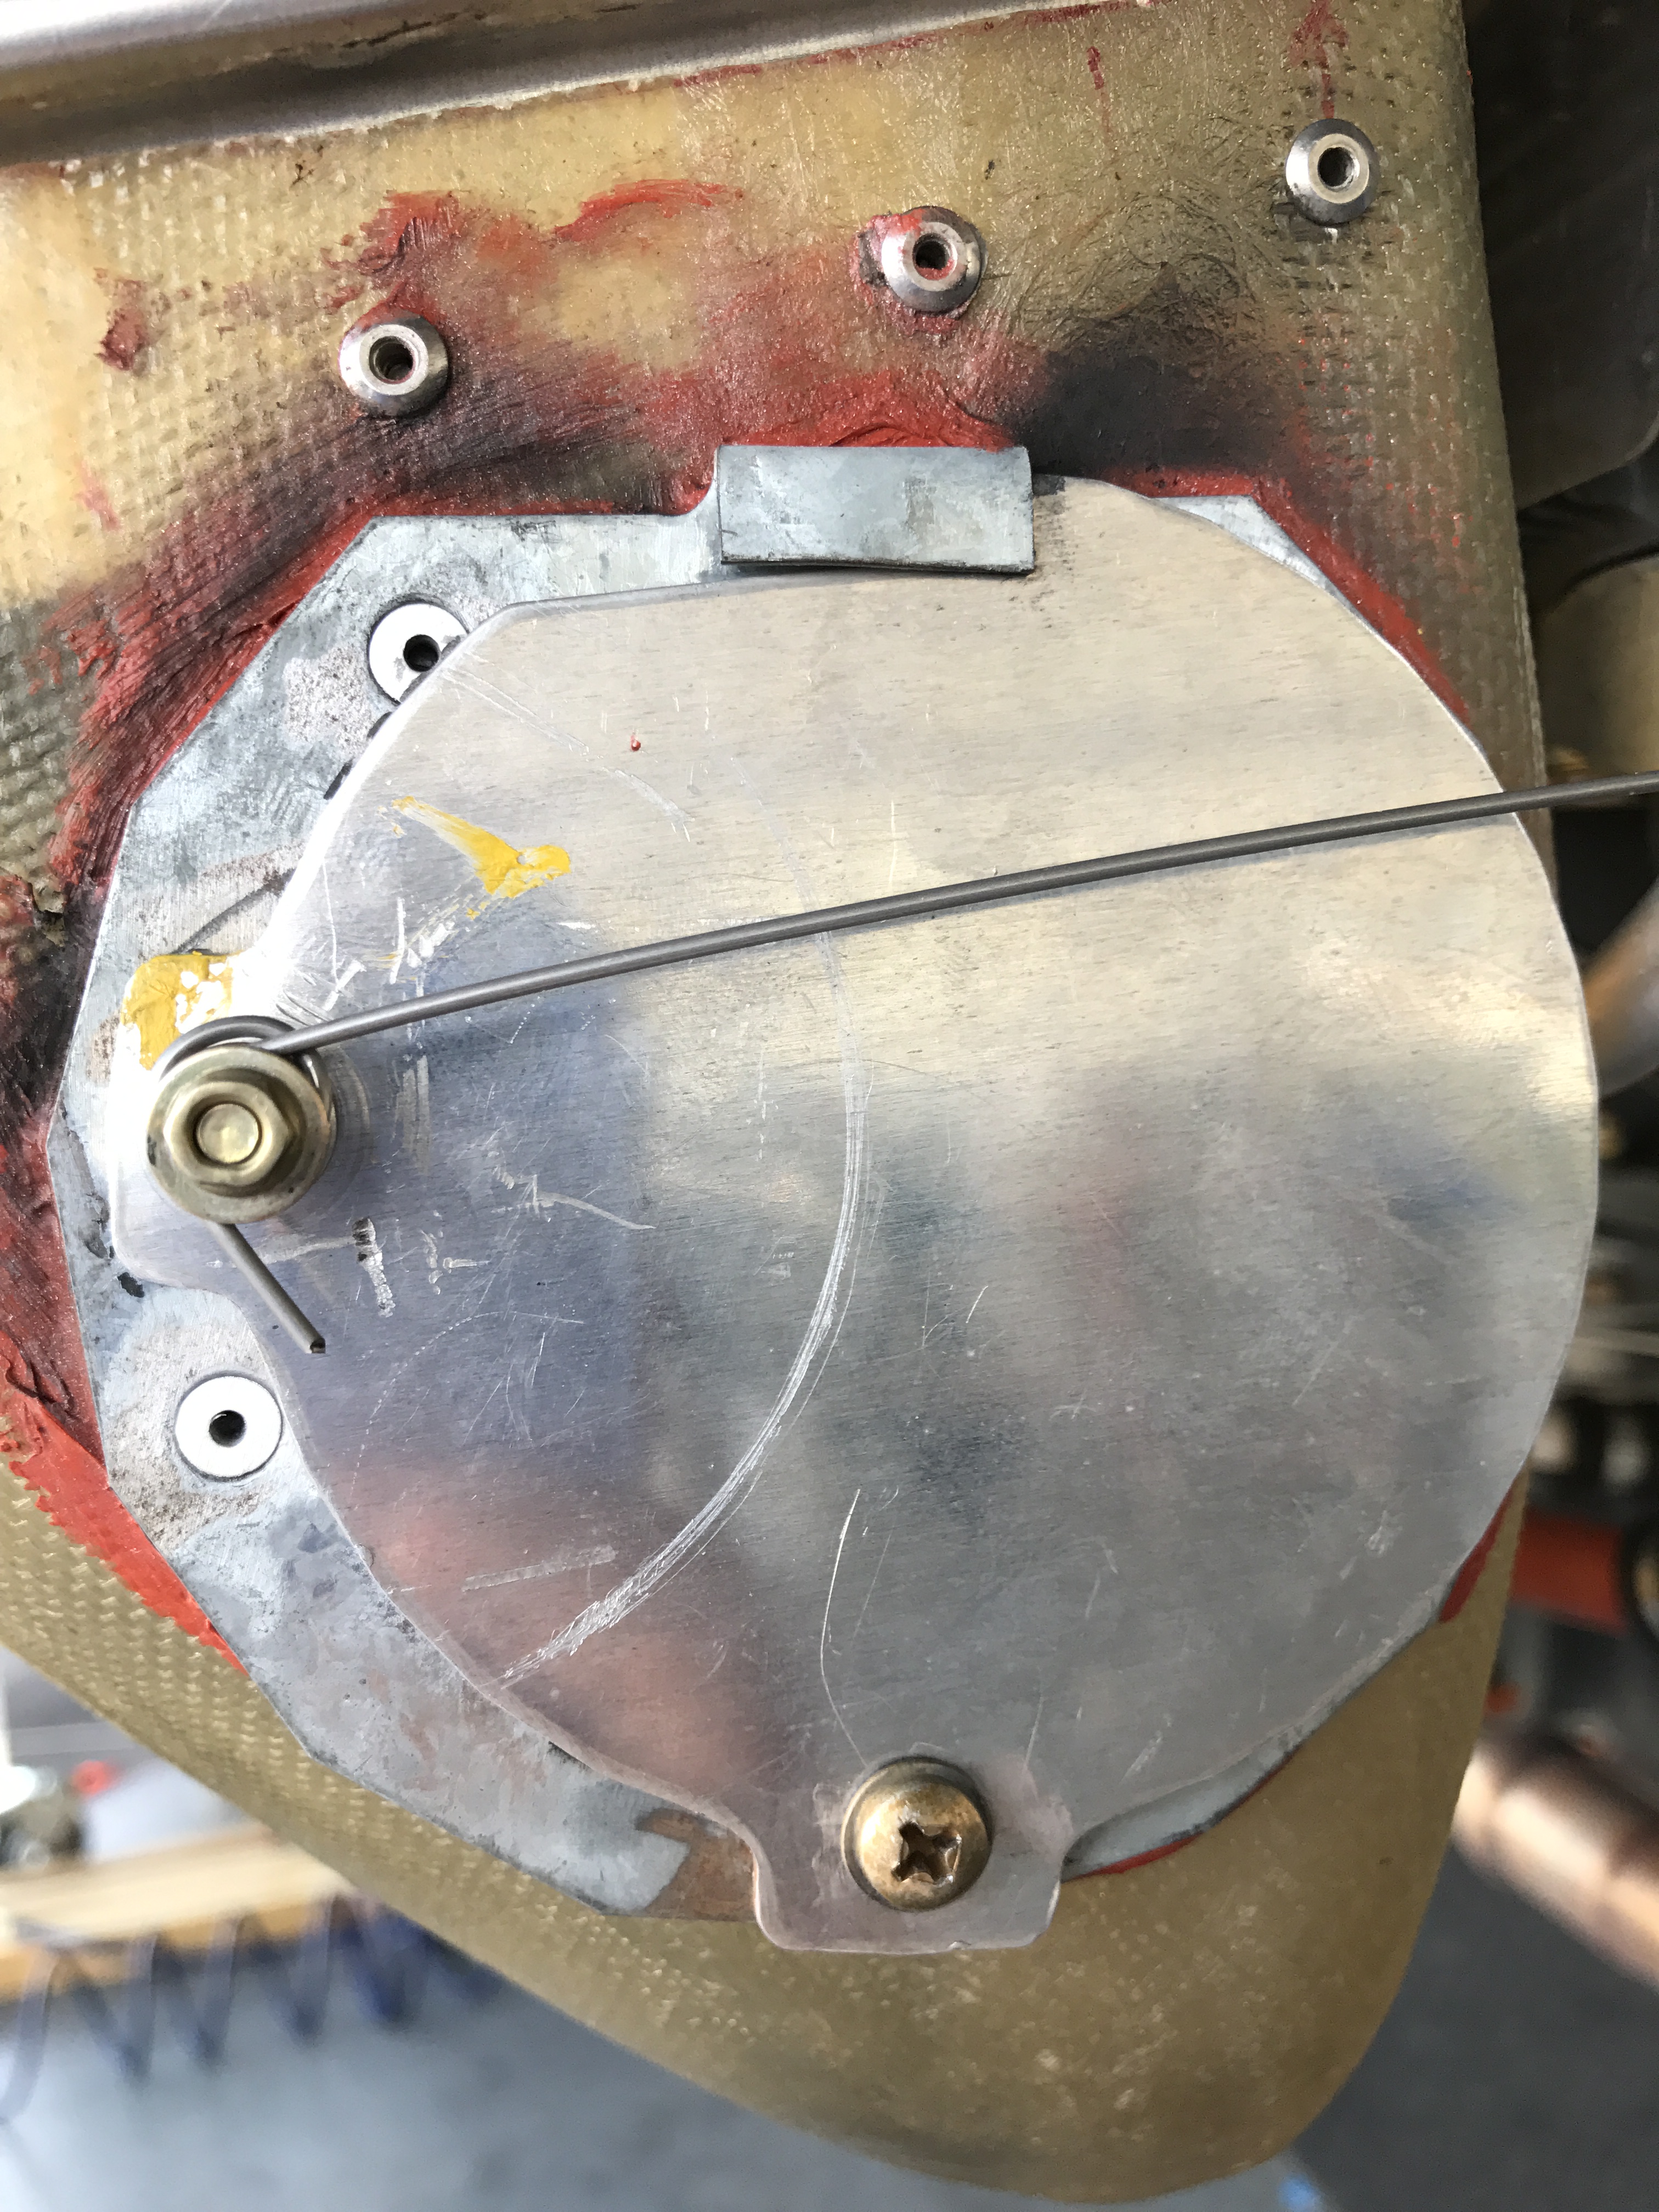
  • An optical pickup mounted on the same bracket, “approximately six inches behind the back of the propeller,” with its beam aimed at a small piece of reflective tape stuck to the back of the spinner backplate or starter ring. The optical pickup gives the balancer a once-per-revolution timing reference so it can tell the balancer not just the magnitude of the vibration but the angular location of the heavy spot.

(Quotes are from the DynaVibe Classic User Manual v1.09.)

With those two sensors hooked up, you start the engine and run it up to a steady cruise RPM — around 2,100 RPM in our case for the Lycoming IO-540. The balancer reads out two numbers: the vibration magnitude in inches per second (IPS), and the clock-angle of the heavy spot measured against the reflective-tape index. Then you stick trim weights opposite the heavy spot, run it again, see whether the magnitude dropped and where the new heavy spot ended up, and iterate.

The DynaVibe puts the result on a clear scale:

DynaVibe Dynamic Propeller Balancer form, showing the IPS magnitude scale: Extreme (≥1.25), Rough (0.25–1.00), Fair (0.15–0.25), Good (0.07–0.15), Excellent (0.04–0.07), Perfect (0.00–0.04). Polar chart for marking heavy-spot location.

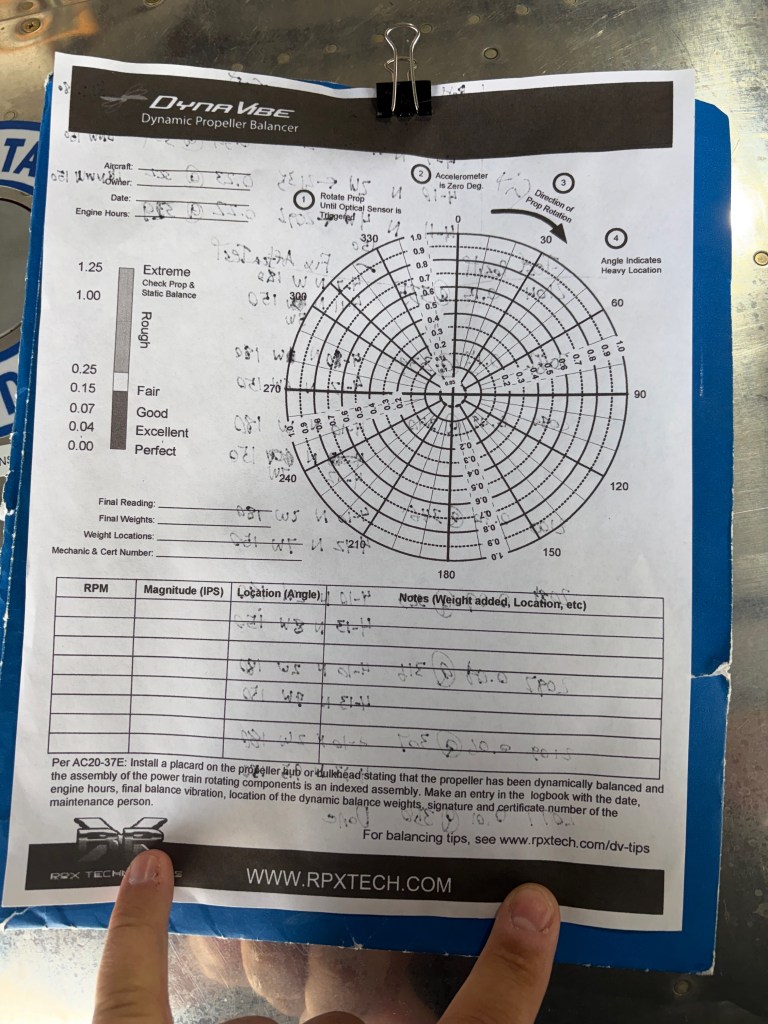
The bands: Perfect under 0.04 IPS, Excellent through 0.07, Good through 0.15, Fair through 0.25, Rough all the way up to 1.00, Extreme above that. Anything in the Good band or better is acceptable for general aviation; Excellent or Perfect is the target if you have the time and patience to chase it.

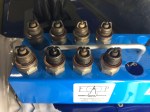
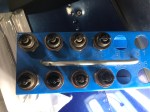
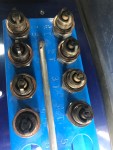
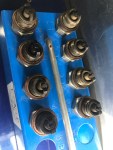
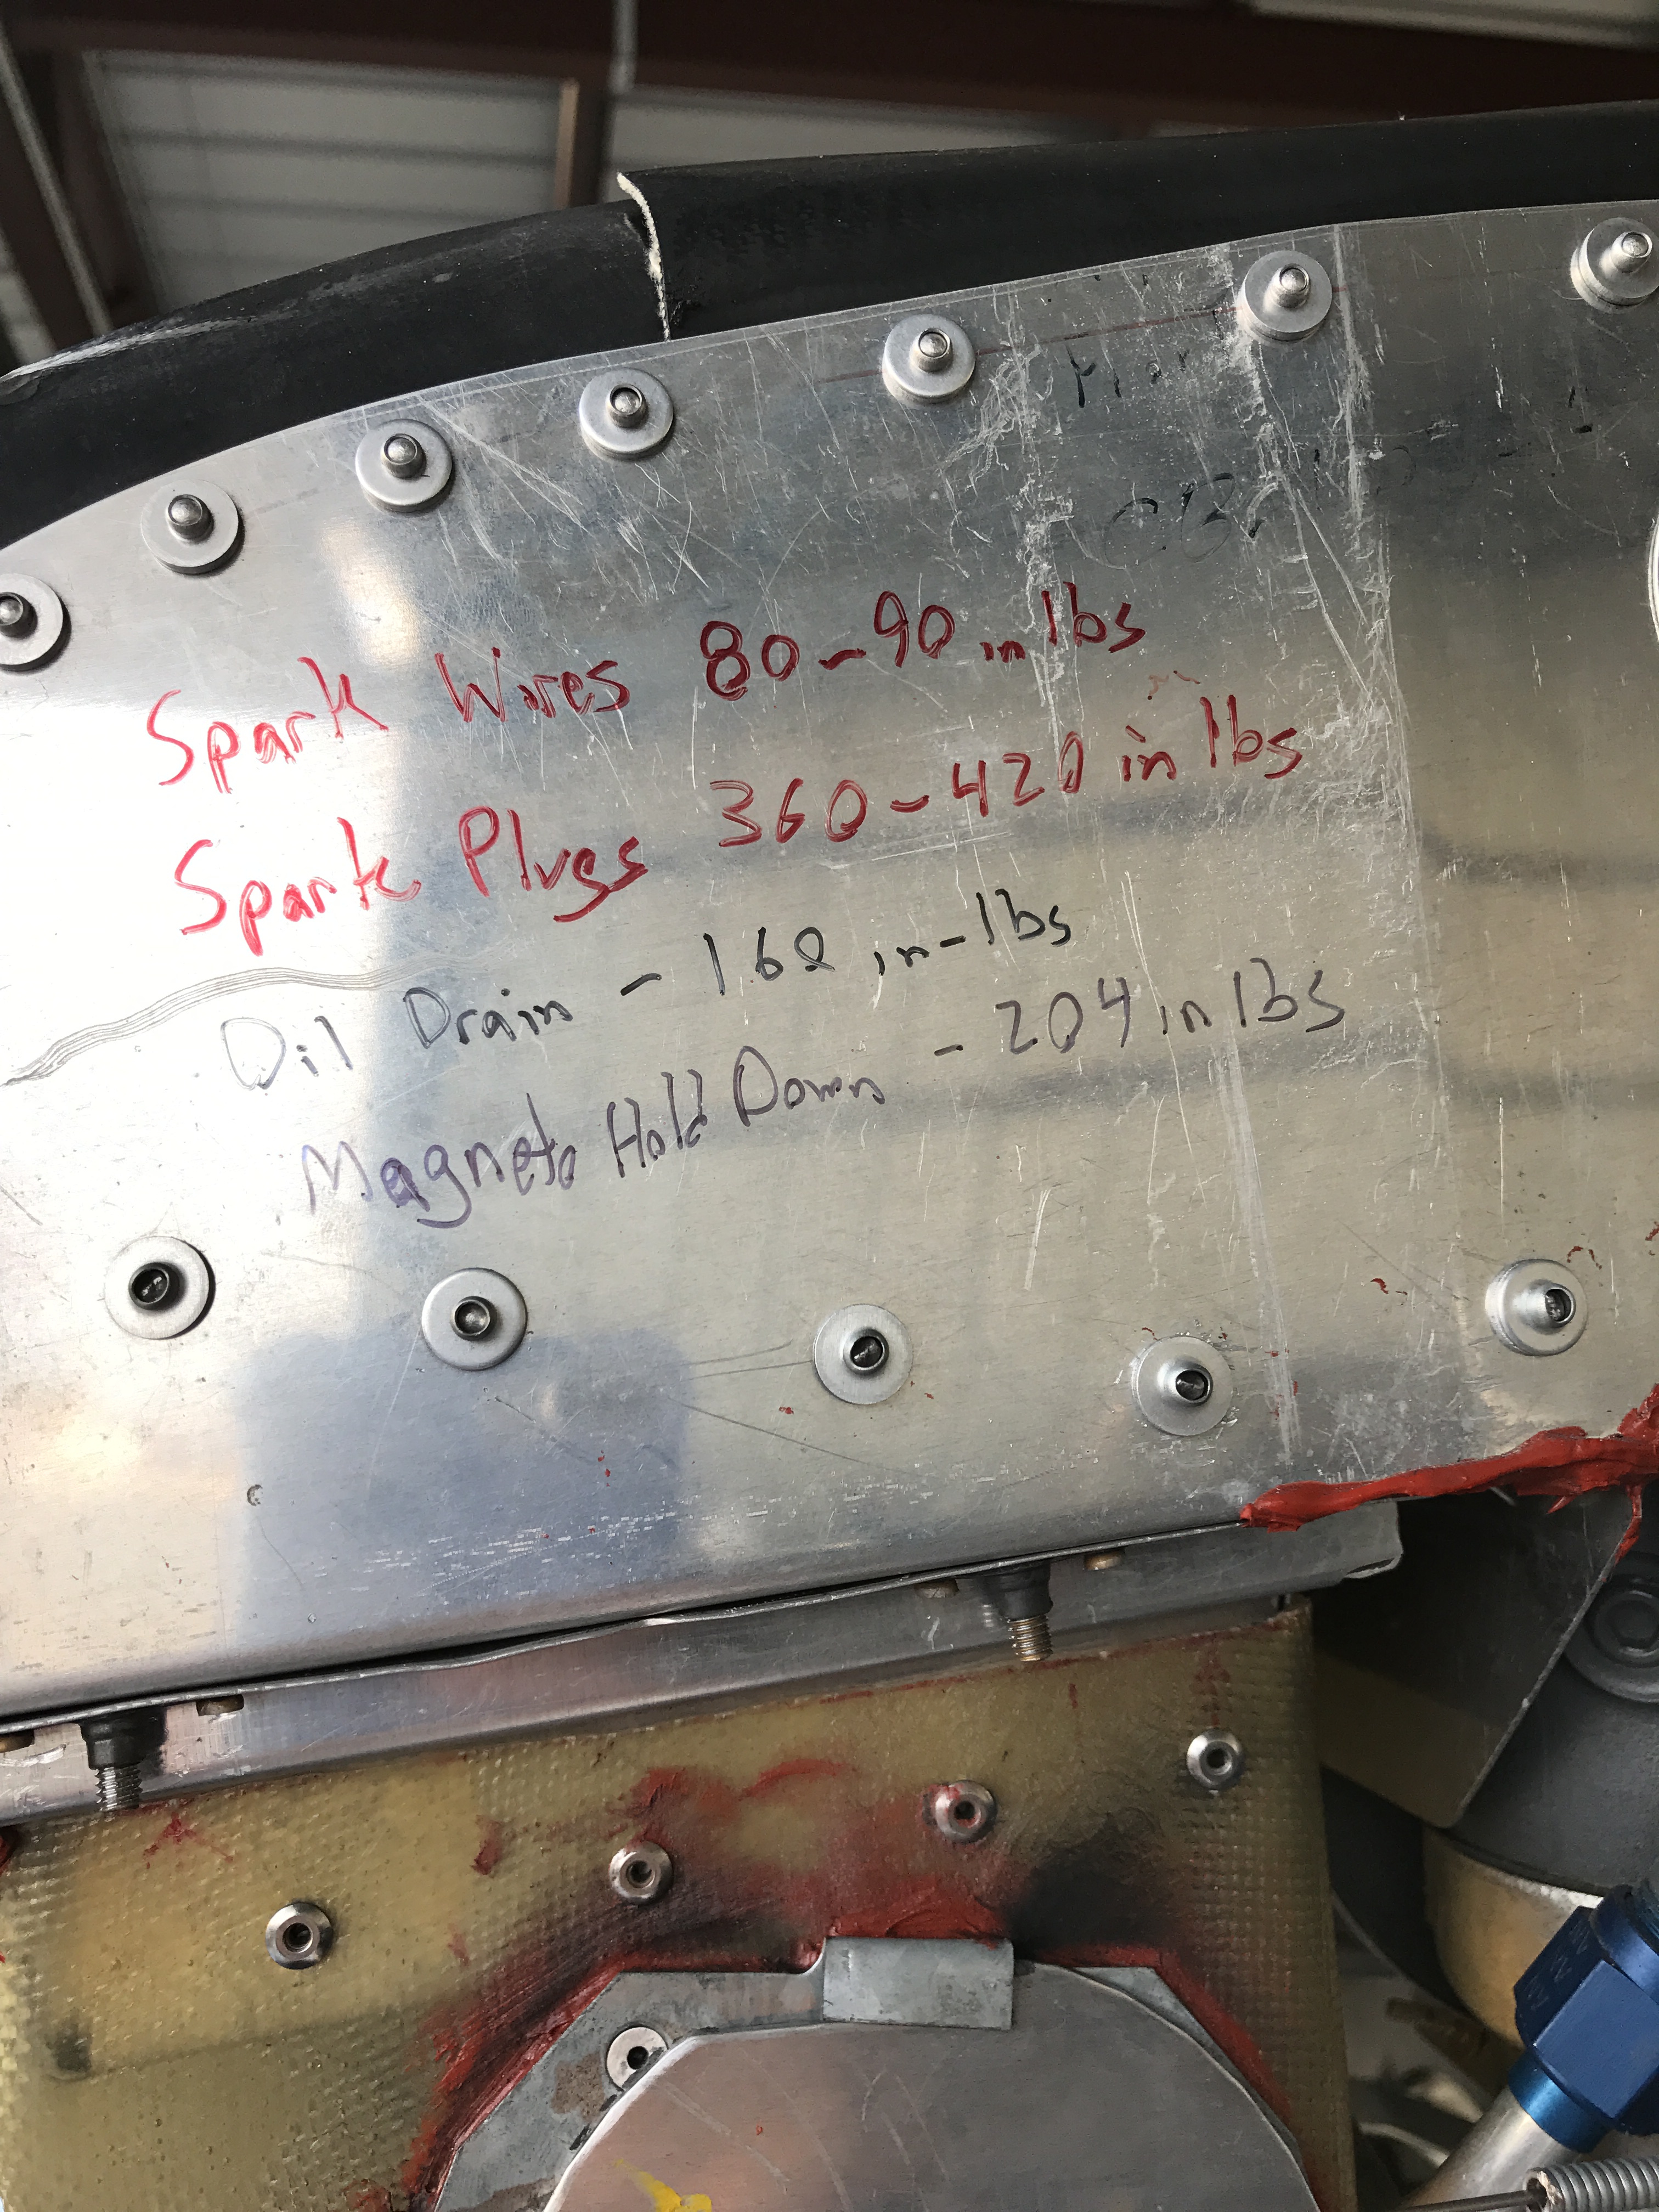
Trim-weight construction

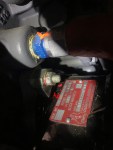
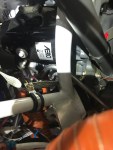
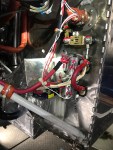
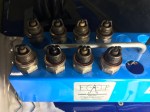
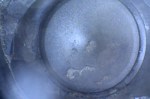
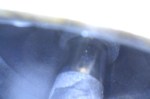
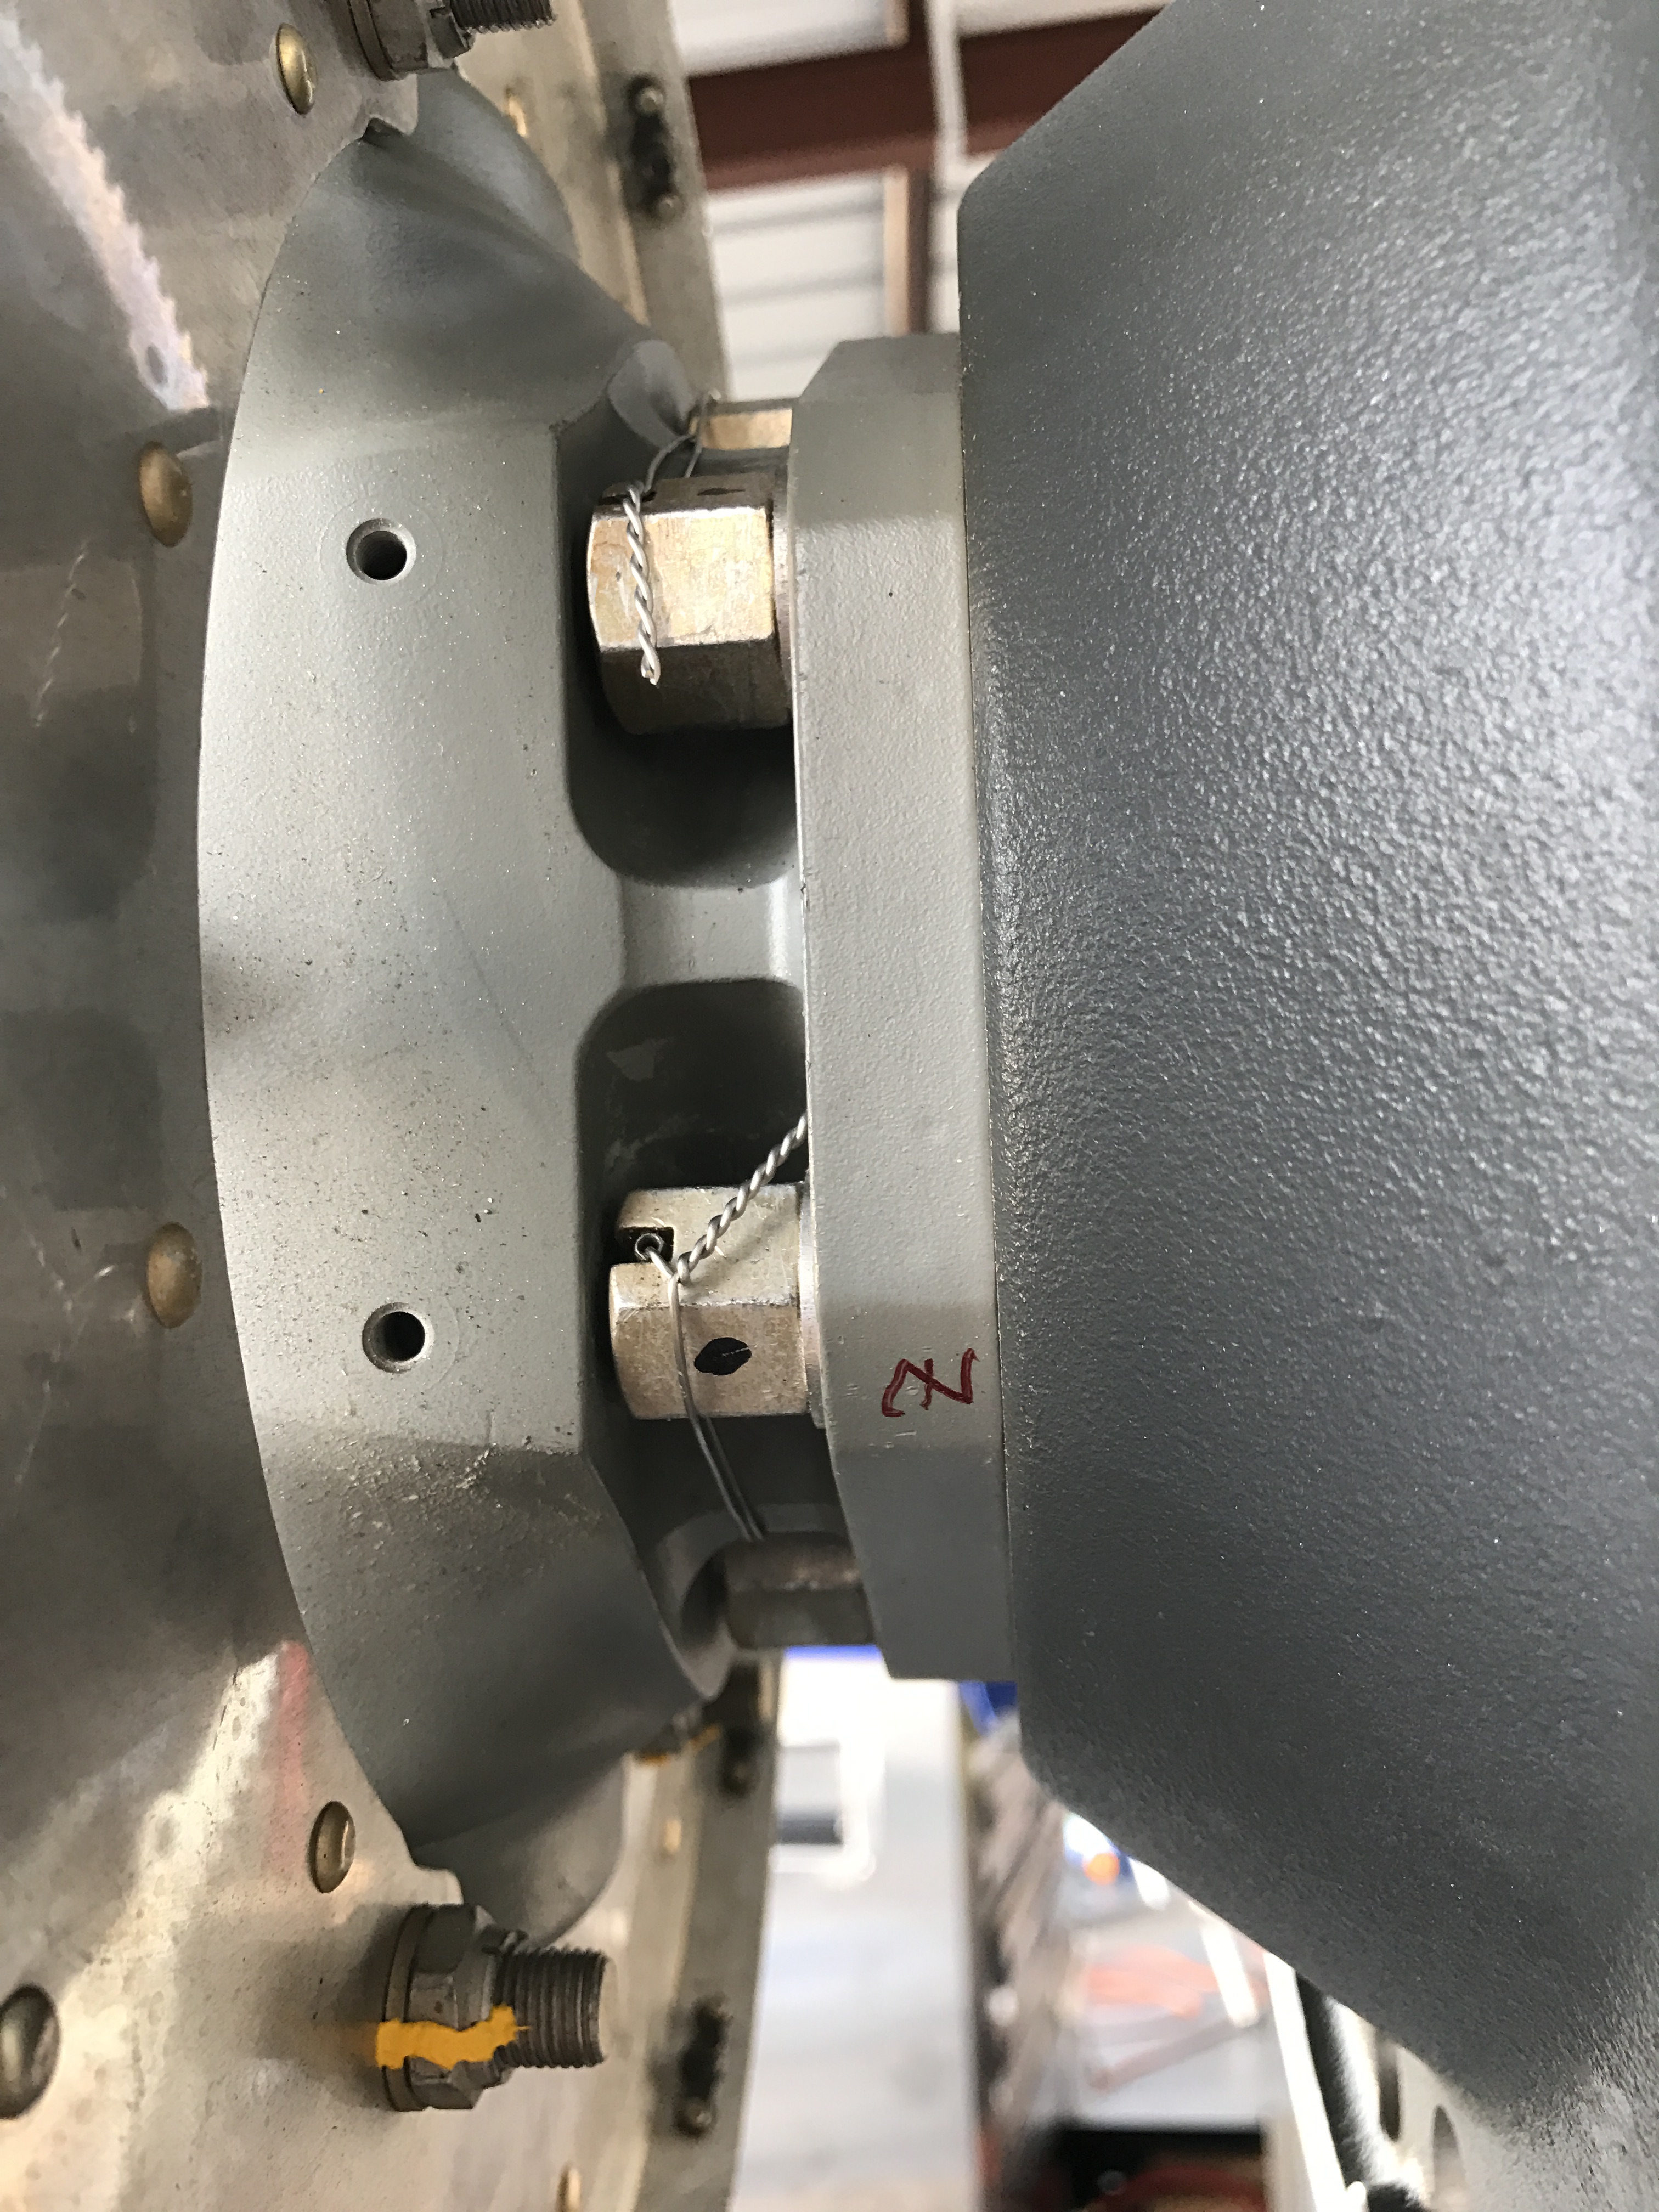
The trim weights on this airplane go on the starter ring gear, which has twelve bolt holes spaced every 30°. We assembled the weights out of standard hardware: AN4 bolts in various lengths, AN4 washers, and AN4 lock nuts. AN4 is a ¼”-diameter aircraft bolt; the dash number is the length in eighths of an inch — so an AN4-7 is ¼” × ⁷⁄₈” long, an AN4-10 is ¼” × 1¼”, an AN4-13 is ¼” × 1⅝”, and so on.

The catch: each bolt has limited thread engagement for the lock nut, so you can only stack about one or two washers on a given bolt before you have to step up to the next longer bolt size. Bumping the bolt up a length adds the equivalent of a washer or so of weight all on its own, which gives the balancing procedure a slightly quantized feel — you’re not adding weight continuously, you’re adding it in discrete steps of either a washer or a bolt-length-bump.

The session — twelve runs, eleven adjustments

Initial run, before any trim weights were added: 0.57 IPS at 345° at 2105 RPM. Solidly in the Rough band.

What follows is the entire in-hangar log:

Handwritten iteration log from the prop balance session: starting at 0.57 IPS @ 345° and converging through twelve trim-weight adjustments to a final reading of 0.01 IPS at 350°.

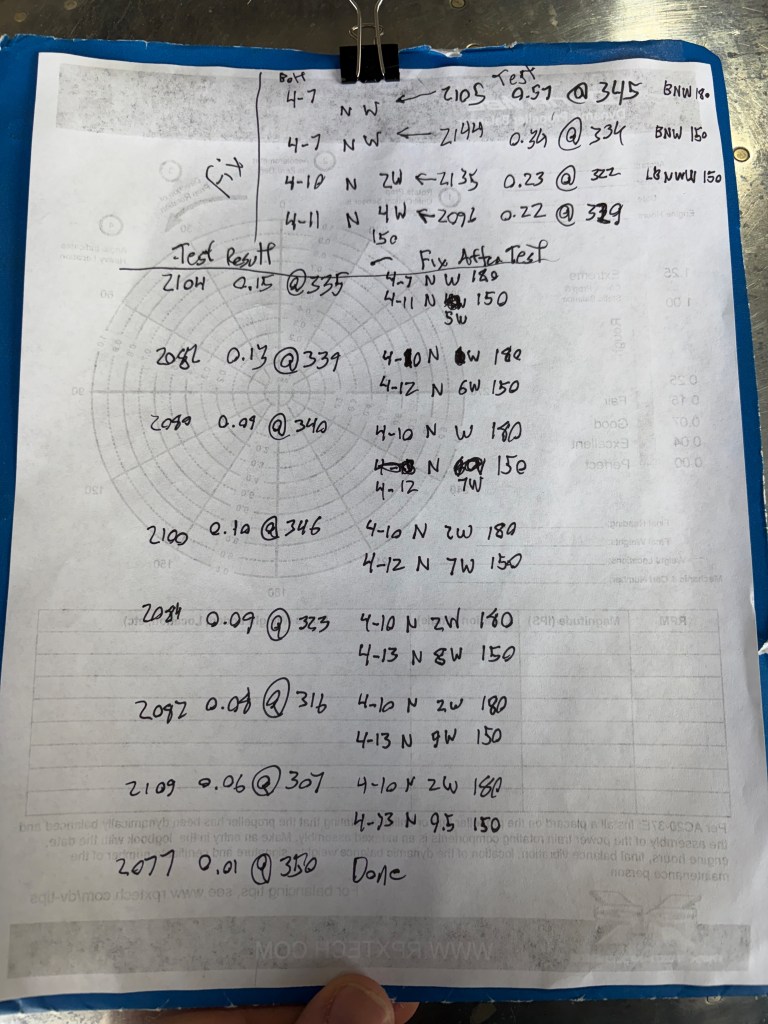
Decoded as a table — each row is one measurement, the “Fix applied” column is what we added or changed between this run and the next, and the rightmost column is the running weight state the airplane was carrying when the next measurement was taken:

#RPMIPSHeavy spotFix applied for next runRunning weight state after fix
1 (bare prop)21050.57345°AN4-7 + nut + 1 washer at 180°180°: AN4-7 N+W
221440.34334°AN4-7 + nut + 1 washer at 150°180°: AN4-7 N+W · 150°: AN4-7 N+W
321350.23322°Upgrade 150° to AN4-10 + nut + 2 washers180°: AN4-7 N+W · 150°: AN4-10 N+2W
420960.22329°150°: AN4-10 → AN4-11; washers 2 → 4180°: AN4-7 N+W · 150°: AN4-11 N+4W
521040.15335°One more washer at 150° (bolt stays AN4-11)180°: AN4-7 N+W · 150°: AN4-11 N+5W
620820.13339°150°: AN4-11 → AN4-12; washers 5 → 6180°: AN4-7 N+W · 150°: AN4-12 N+6W
720800.09340°180° → AN4-10 N+W; 150° adds washer → AN4-12 N+7W180°: AN4-10 N+W · 150°: AN4-12 N+7W
821000.10346°Add washer at 180° → AN4-10 N+2W180°: AN4-10 N+2W · 150°: AN4-12 N+7W
920840.09323°150°: AN4-12 → AN4-13; washers 7 → 8180°: AN4-10 N+2W · 150°: AN4-13 N+8W
1020820.08316°One more washer at 150° → AN4-13 N+9W180°: AN4-10 N+2W · 150°: AN4-13 N+9W
1121090.06307°Add a thin (half) washer at 150° → AN4-13 N+9.5W180°: AN4-10 N+2W · 150°: AN4-13 N+9.5W
1220770.01350°Done — achieved 0.01 twice with DynaVibe averaging (the instrument floor)Final installed: 180°: AN4-10 N+2W · 150°: AN4-13 N+9.5W

A couple of things worth noting from the table:

  • The heavy-spot angle moved around the clock as the magnitude came down. It started at 345°, walked counterclockwise to 307° by step 11, then jumped to 350° on the final run. Once you’re in the Good / Excellent range, the angular position is increasingly noise-dominated — small changes in RPM, OAT, or run-to-run engine settling can shift the indicated heavy-spot by tens of degrees while the magnitude barely moves.
  • The step backward at #8 (0.09 → 0.10) is the classic instrument-floor signature. When you’re under ~0.1 IPS, the noise floor of the balancer is comparable to the imbalance you’re trying to chase, and small runs that look like regressions are usually just measurement scatter. We worked through it and kept converging.
  • The final two readings used the DynaVibe’s averaging mode — it takes multiple-revolution samples and reports a stable mean. We saw 0.01 twice in a row in that mode, which is essentially the floor of the instrument. Calling it done was an easy decision.

The convergence as a polar “bullseye” plot — each dot is one measurement, walking from the Rough band on the outer edge in toward Perfect at the center:

Polar convergence chart of the 12 balance measurements. Concentric bands show the DynaVibe IPS categories (Rough / Fair / Good / Excellent / Perfect). Dots are color-coded from red (first measurement, 0.57 IPS) through green (final, 0.01 IPS), connected by a path showing the order of measurements. Each dot is annotated with its measurement number, IPS value, heavy-spot angle, and the trim-weight configuration that was in place when that measurement was taken.

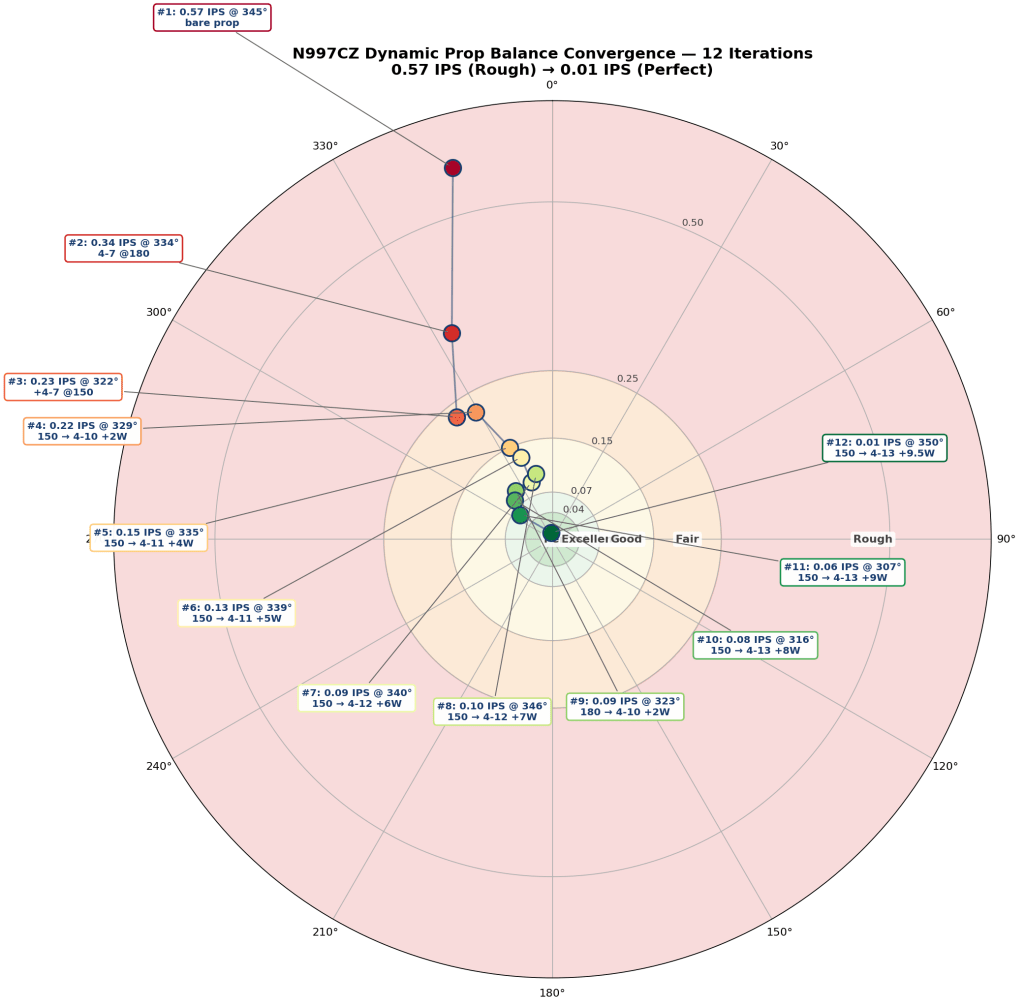
End to end the magnitude trended:

0.57 → 0.34 → 0.23 → 0.22 → 0.15 → 0.13 → 0.09 → 0.10 → 0.09 → 0.08 → 0.06 → 0.01 IPS.

Twelve runs, eleven trim-weight changes, the better part of an afternoon, and the airplane went from Rough to Perfect. A ~57× reduction in cruise vibration magnitude.

What it bought me in flight

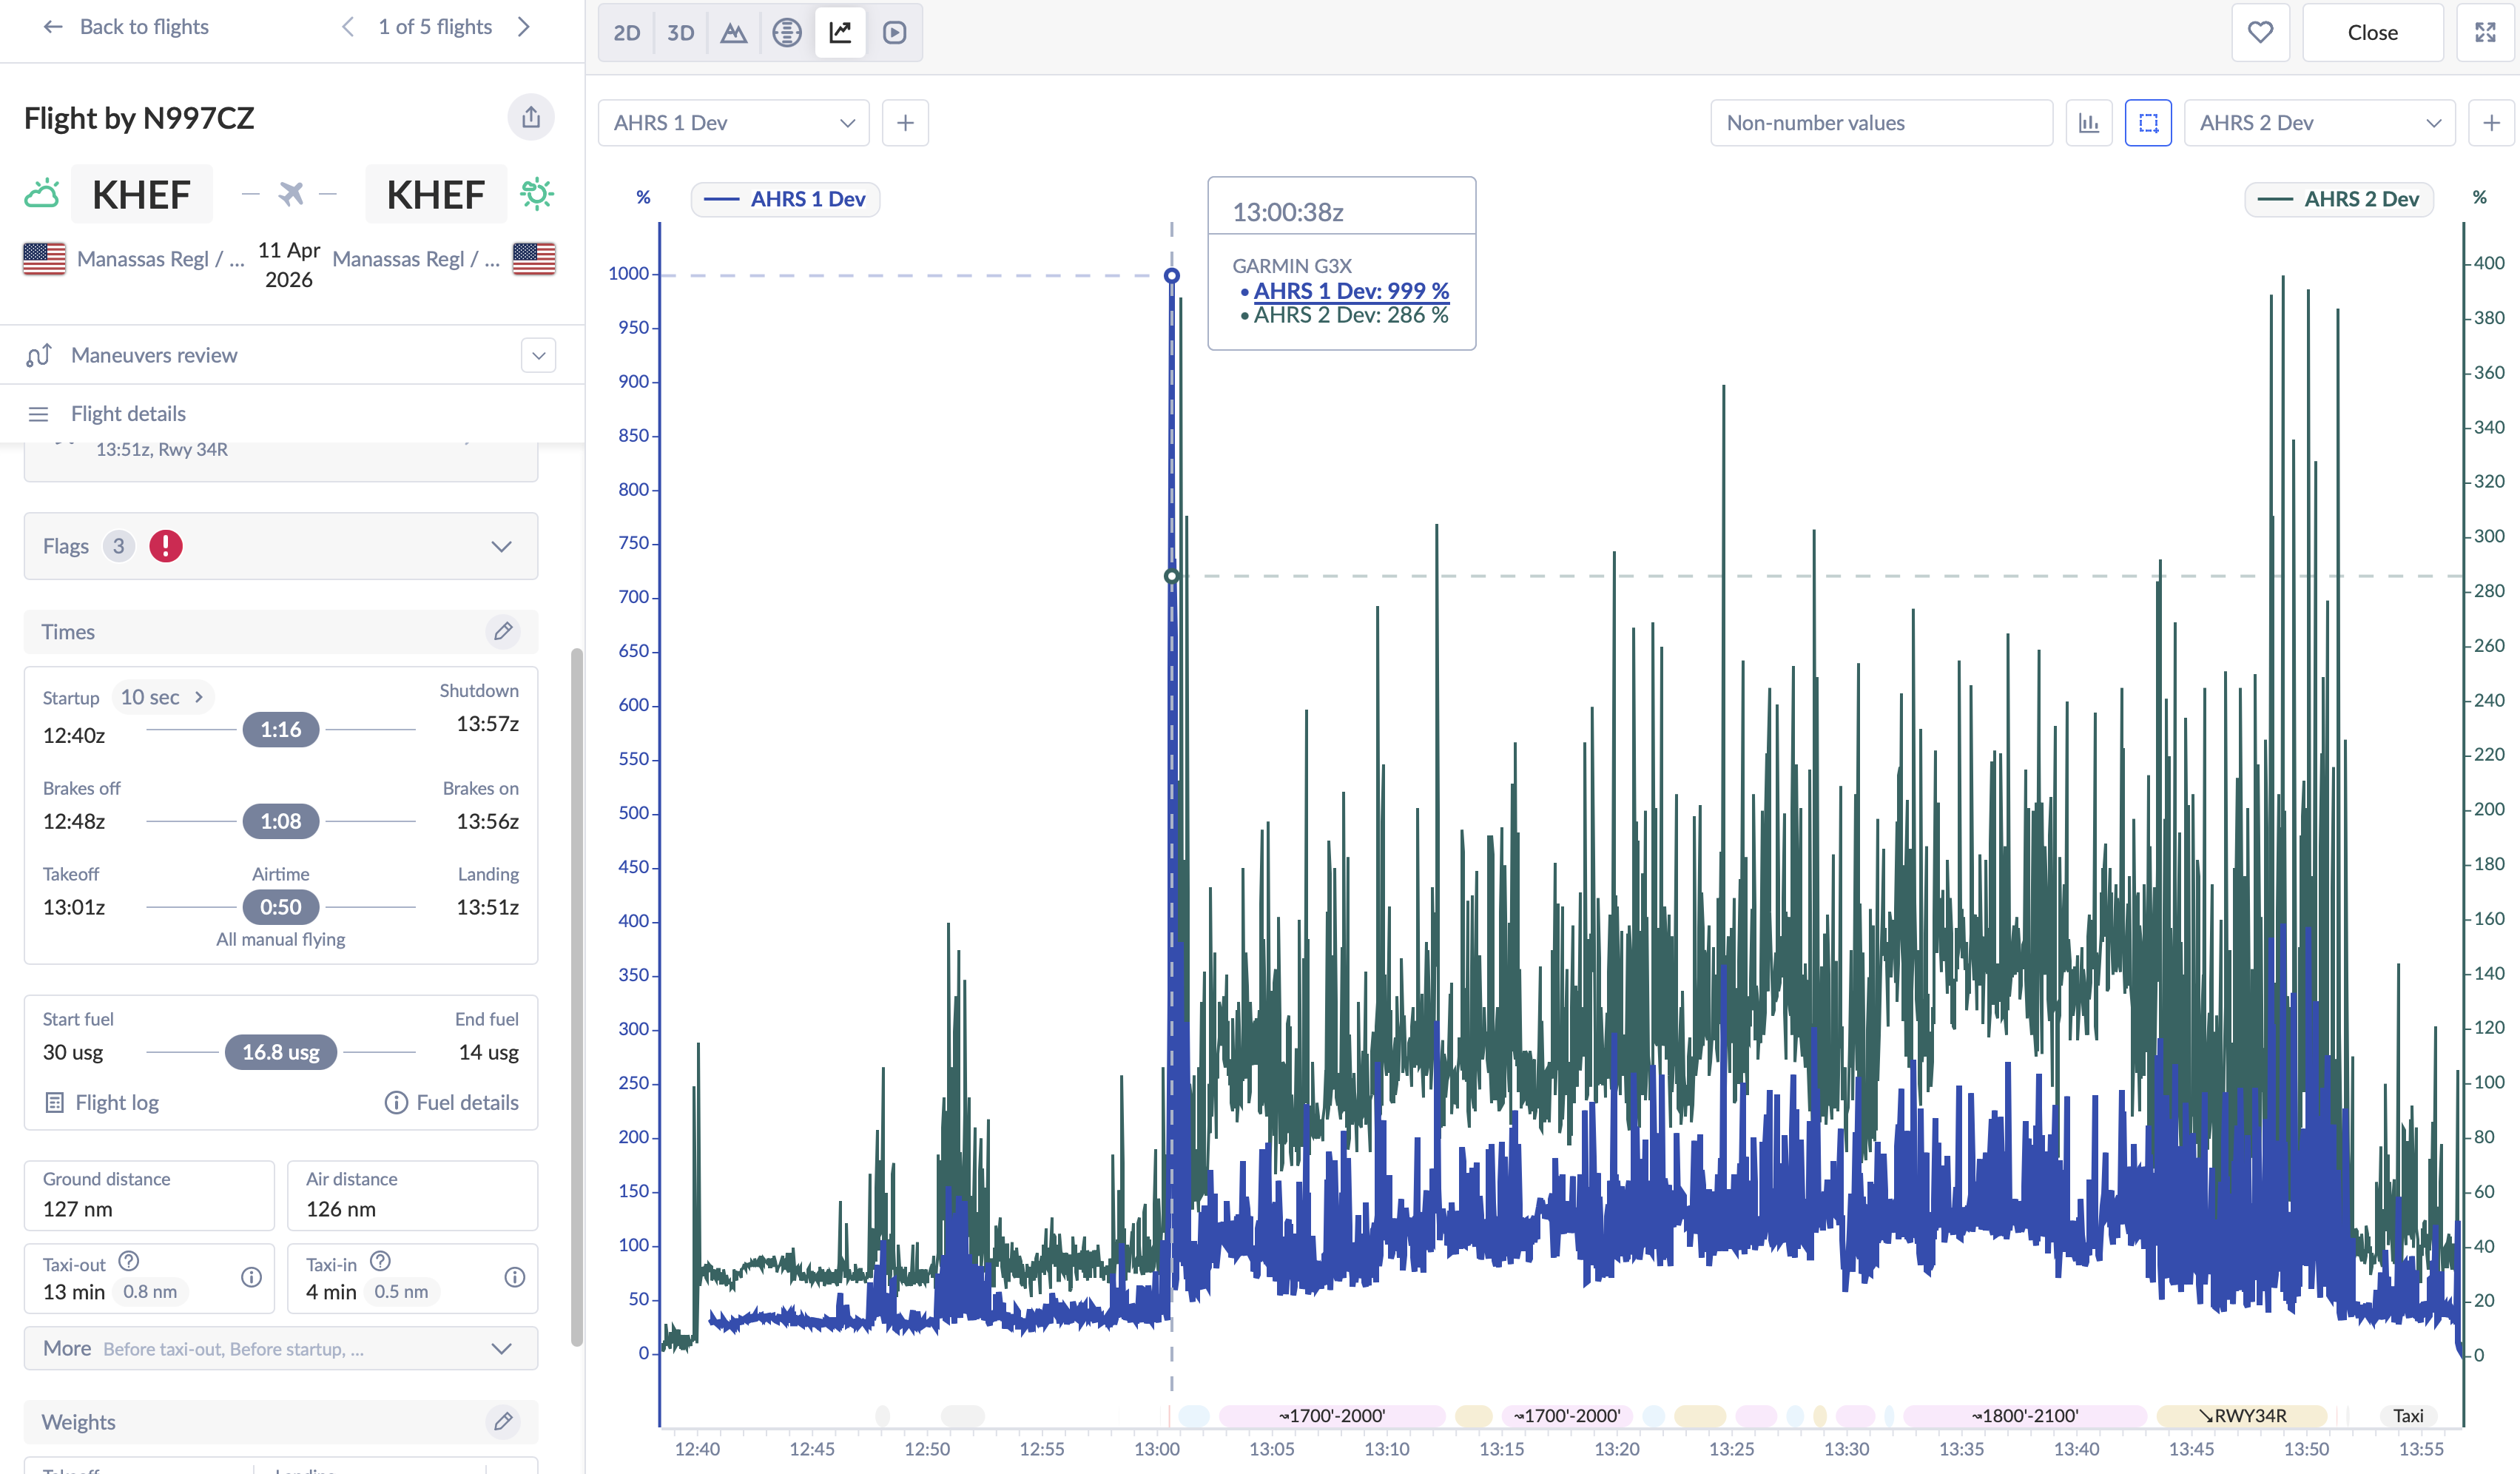
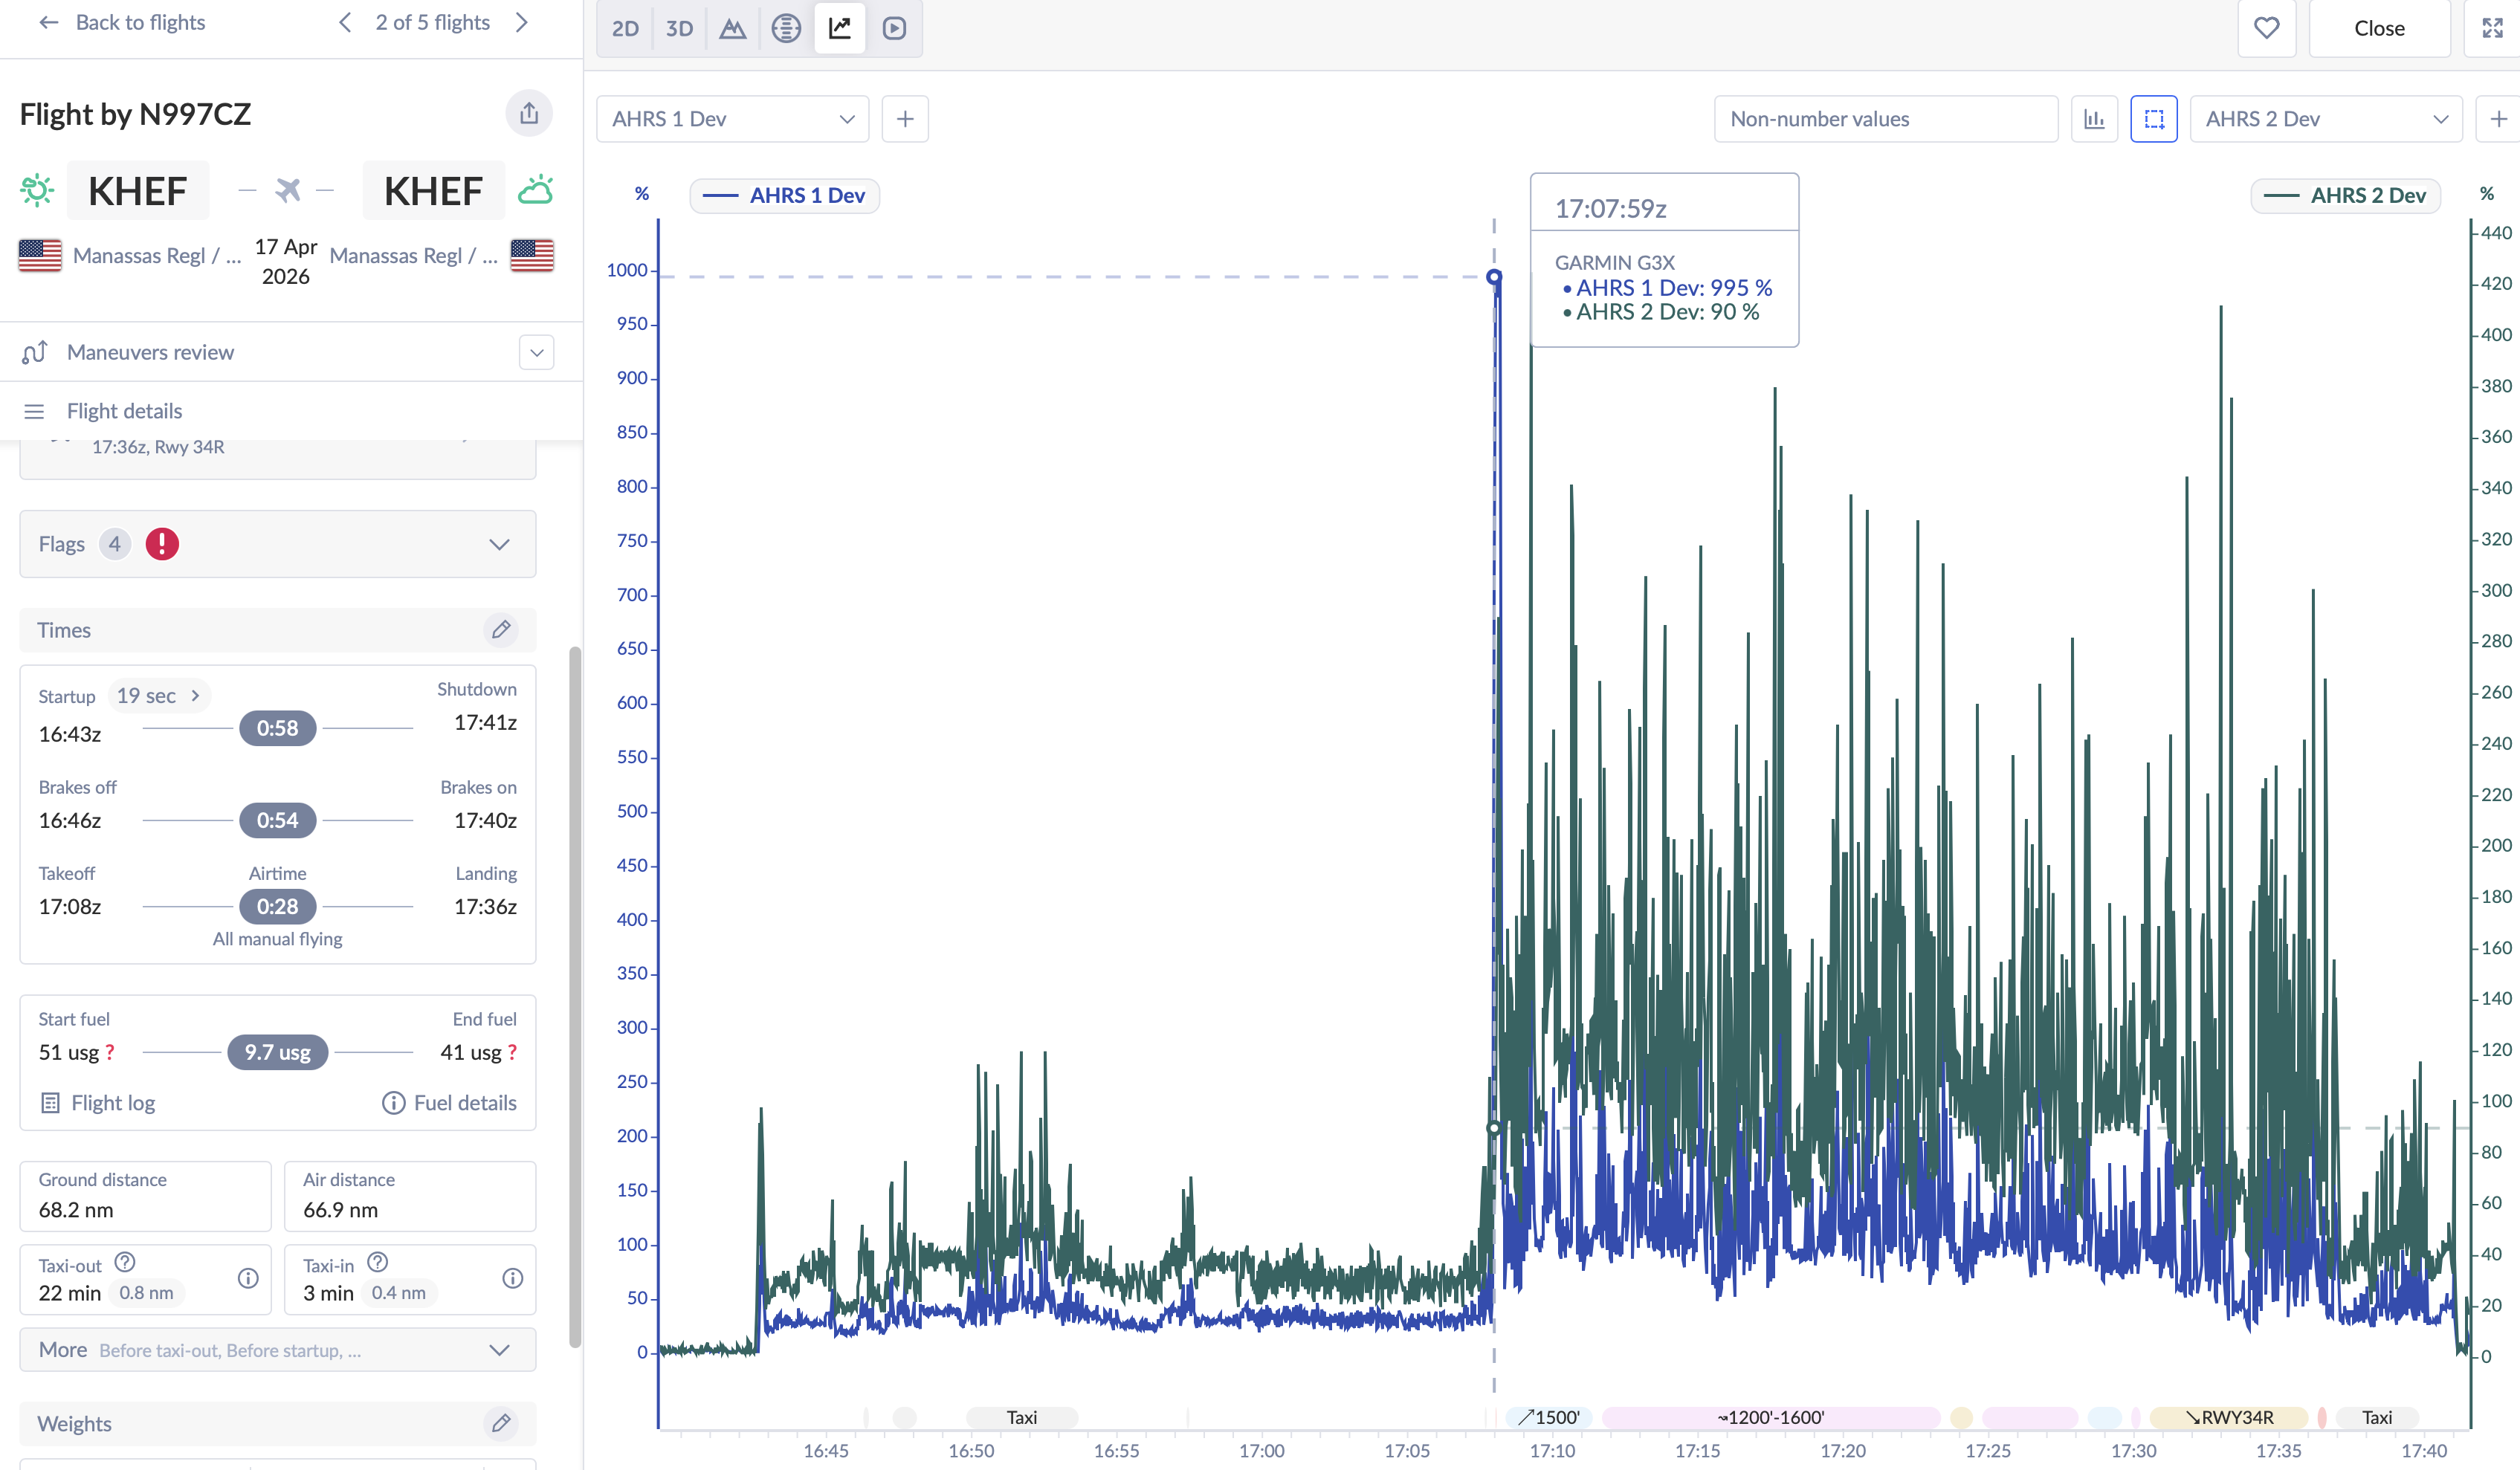
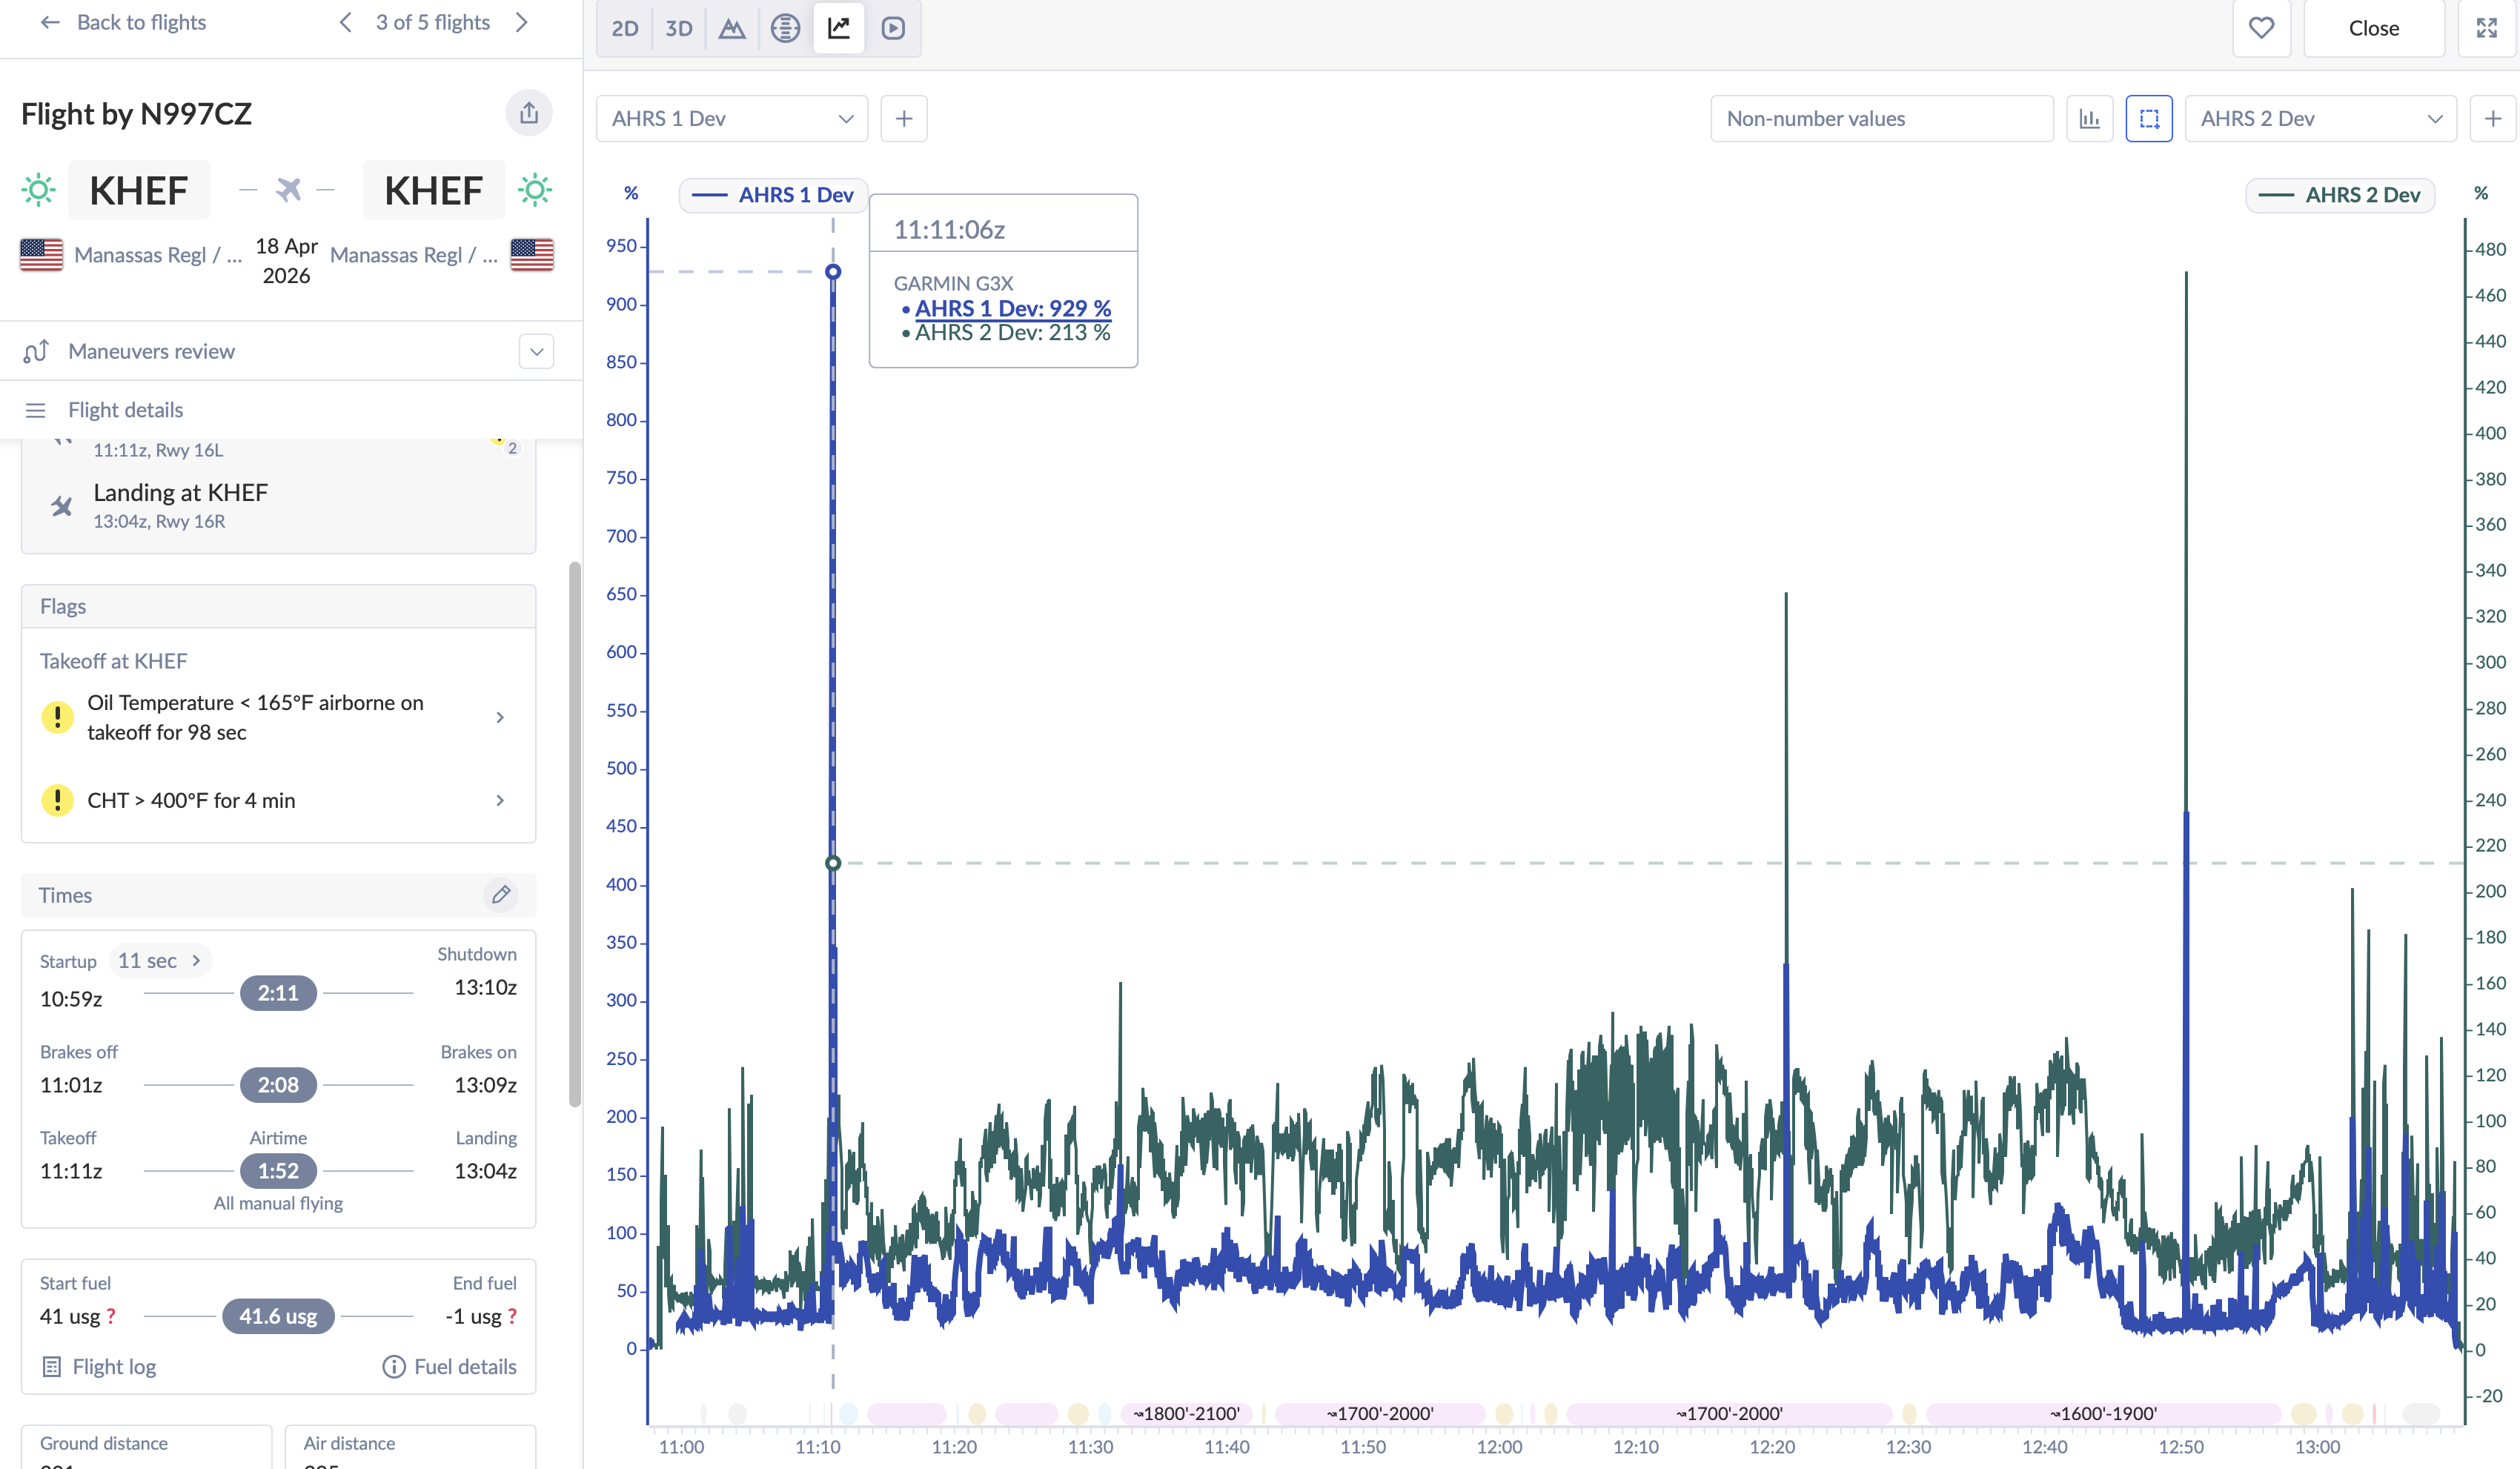
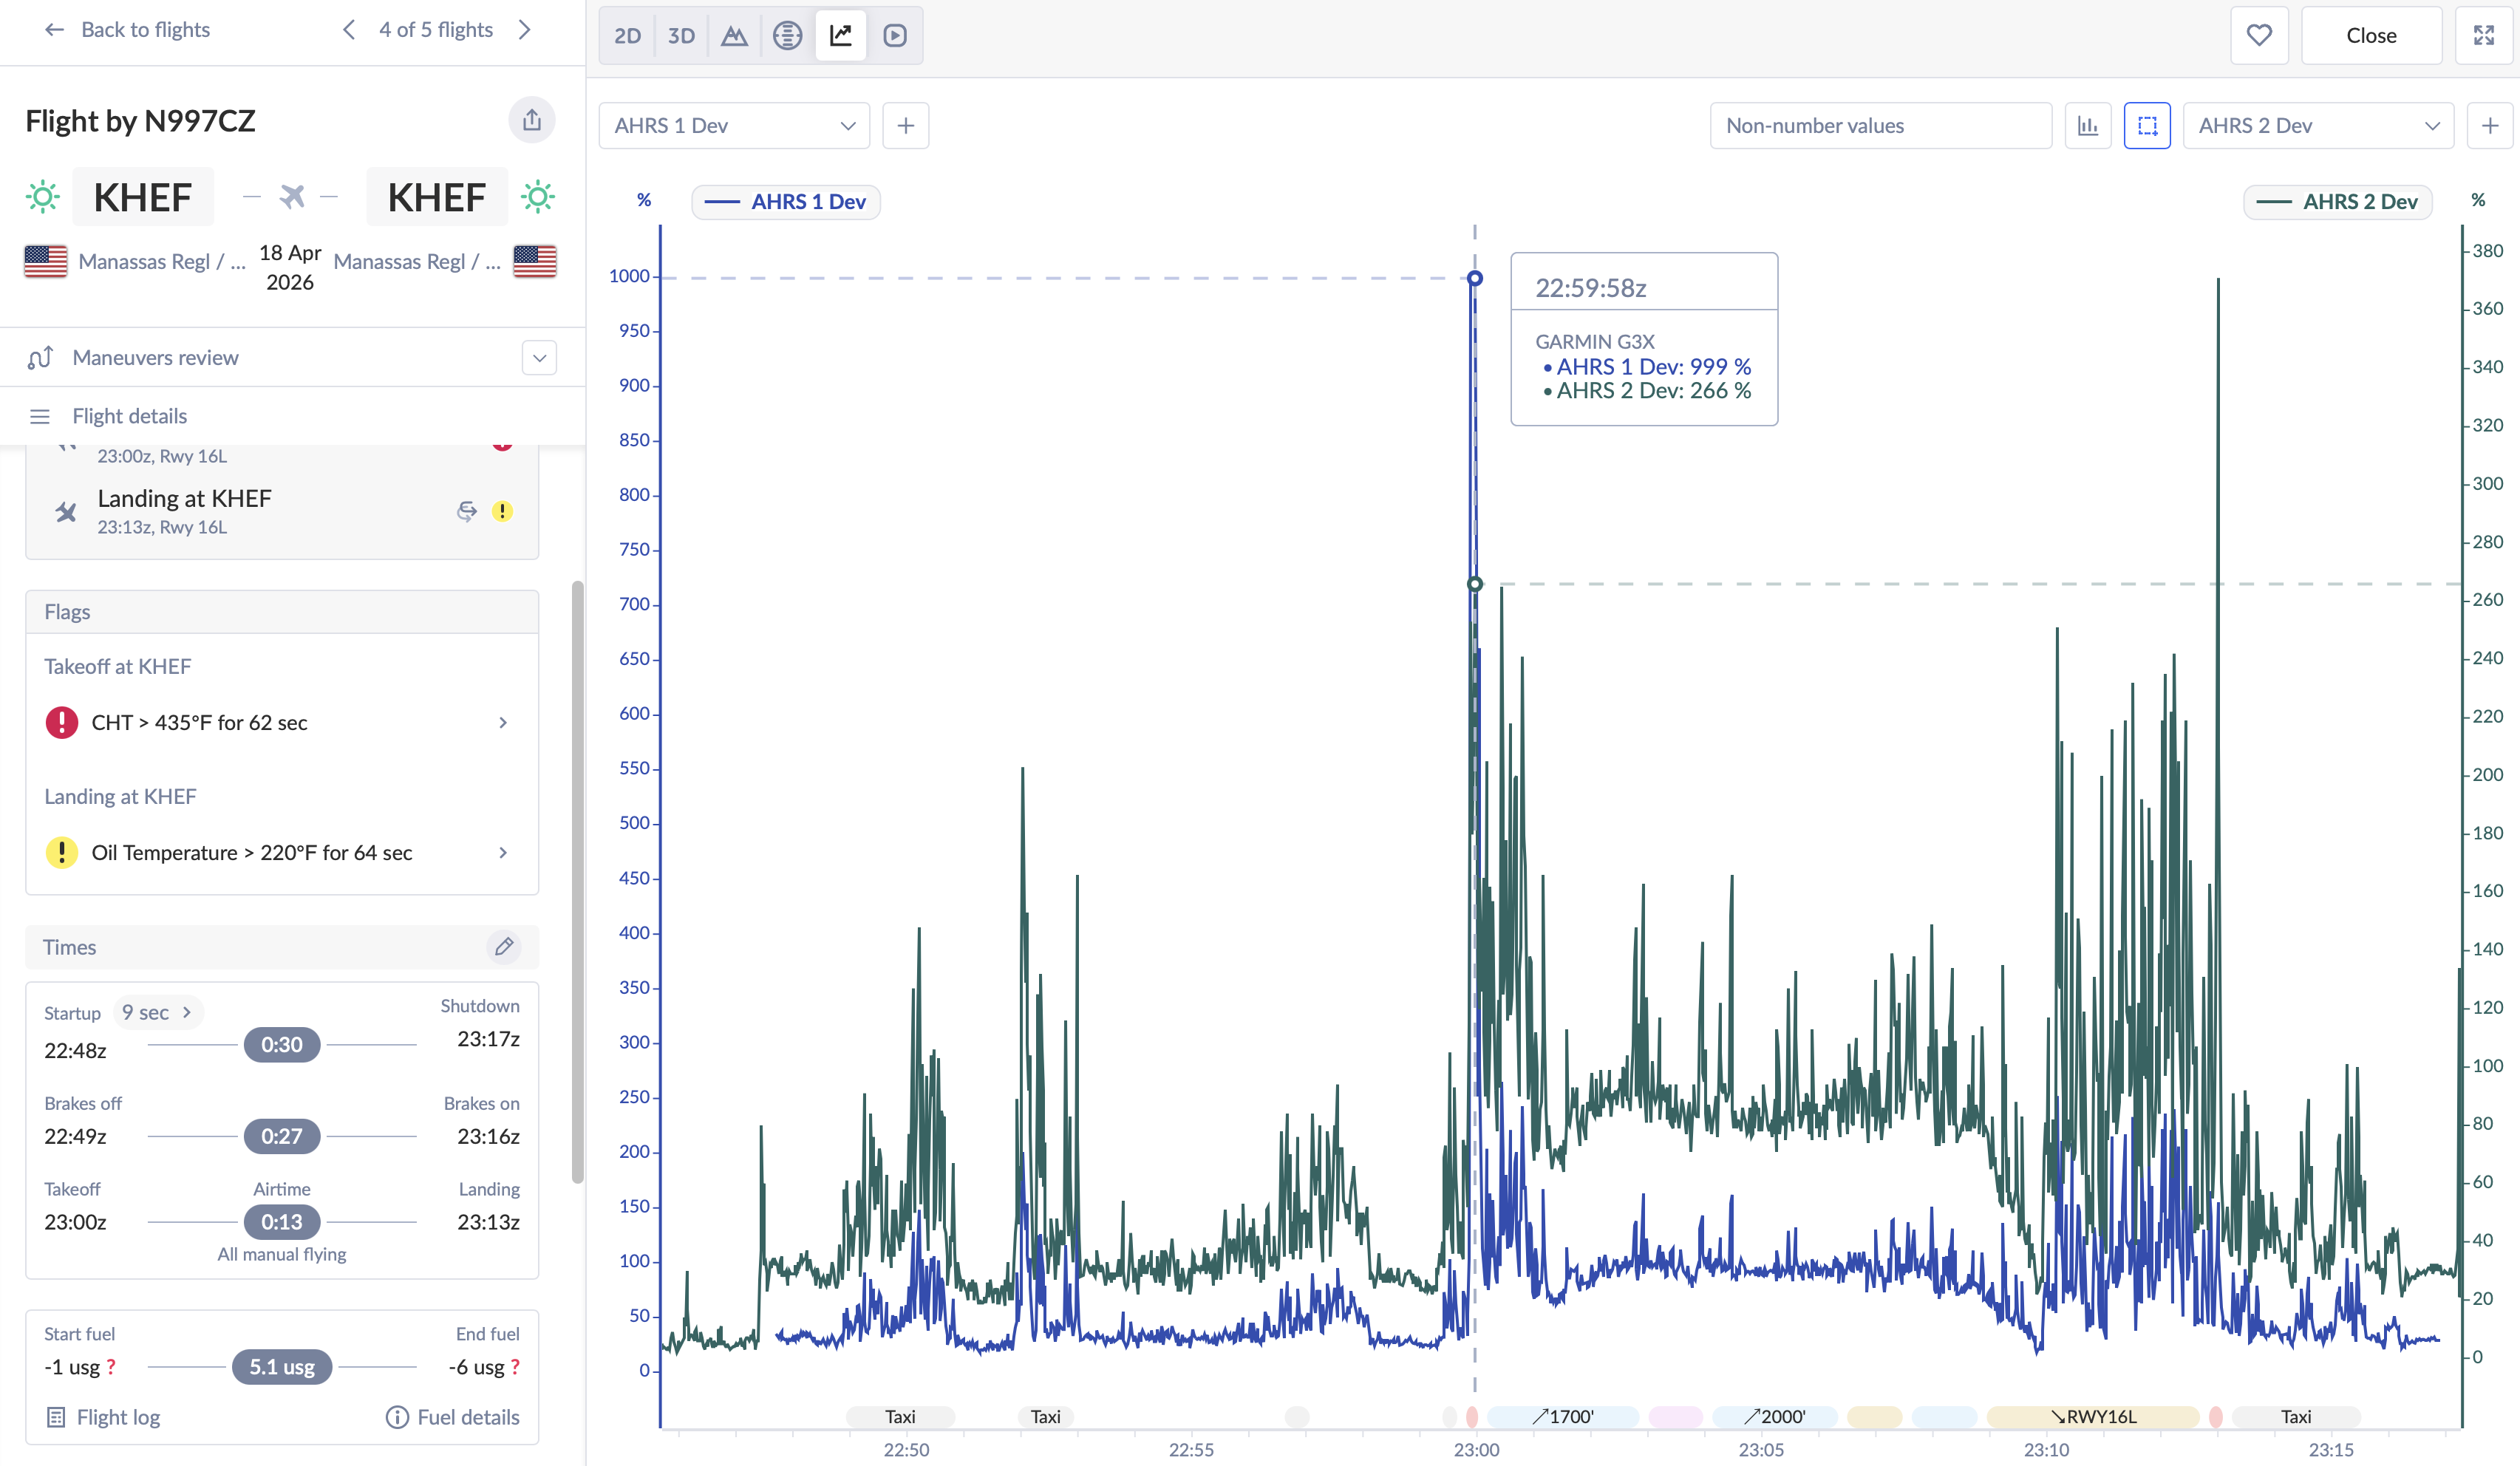
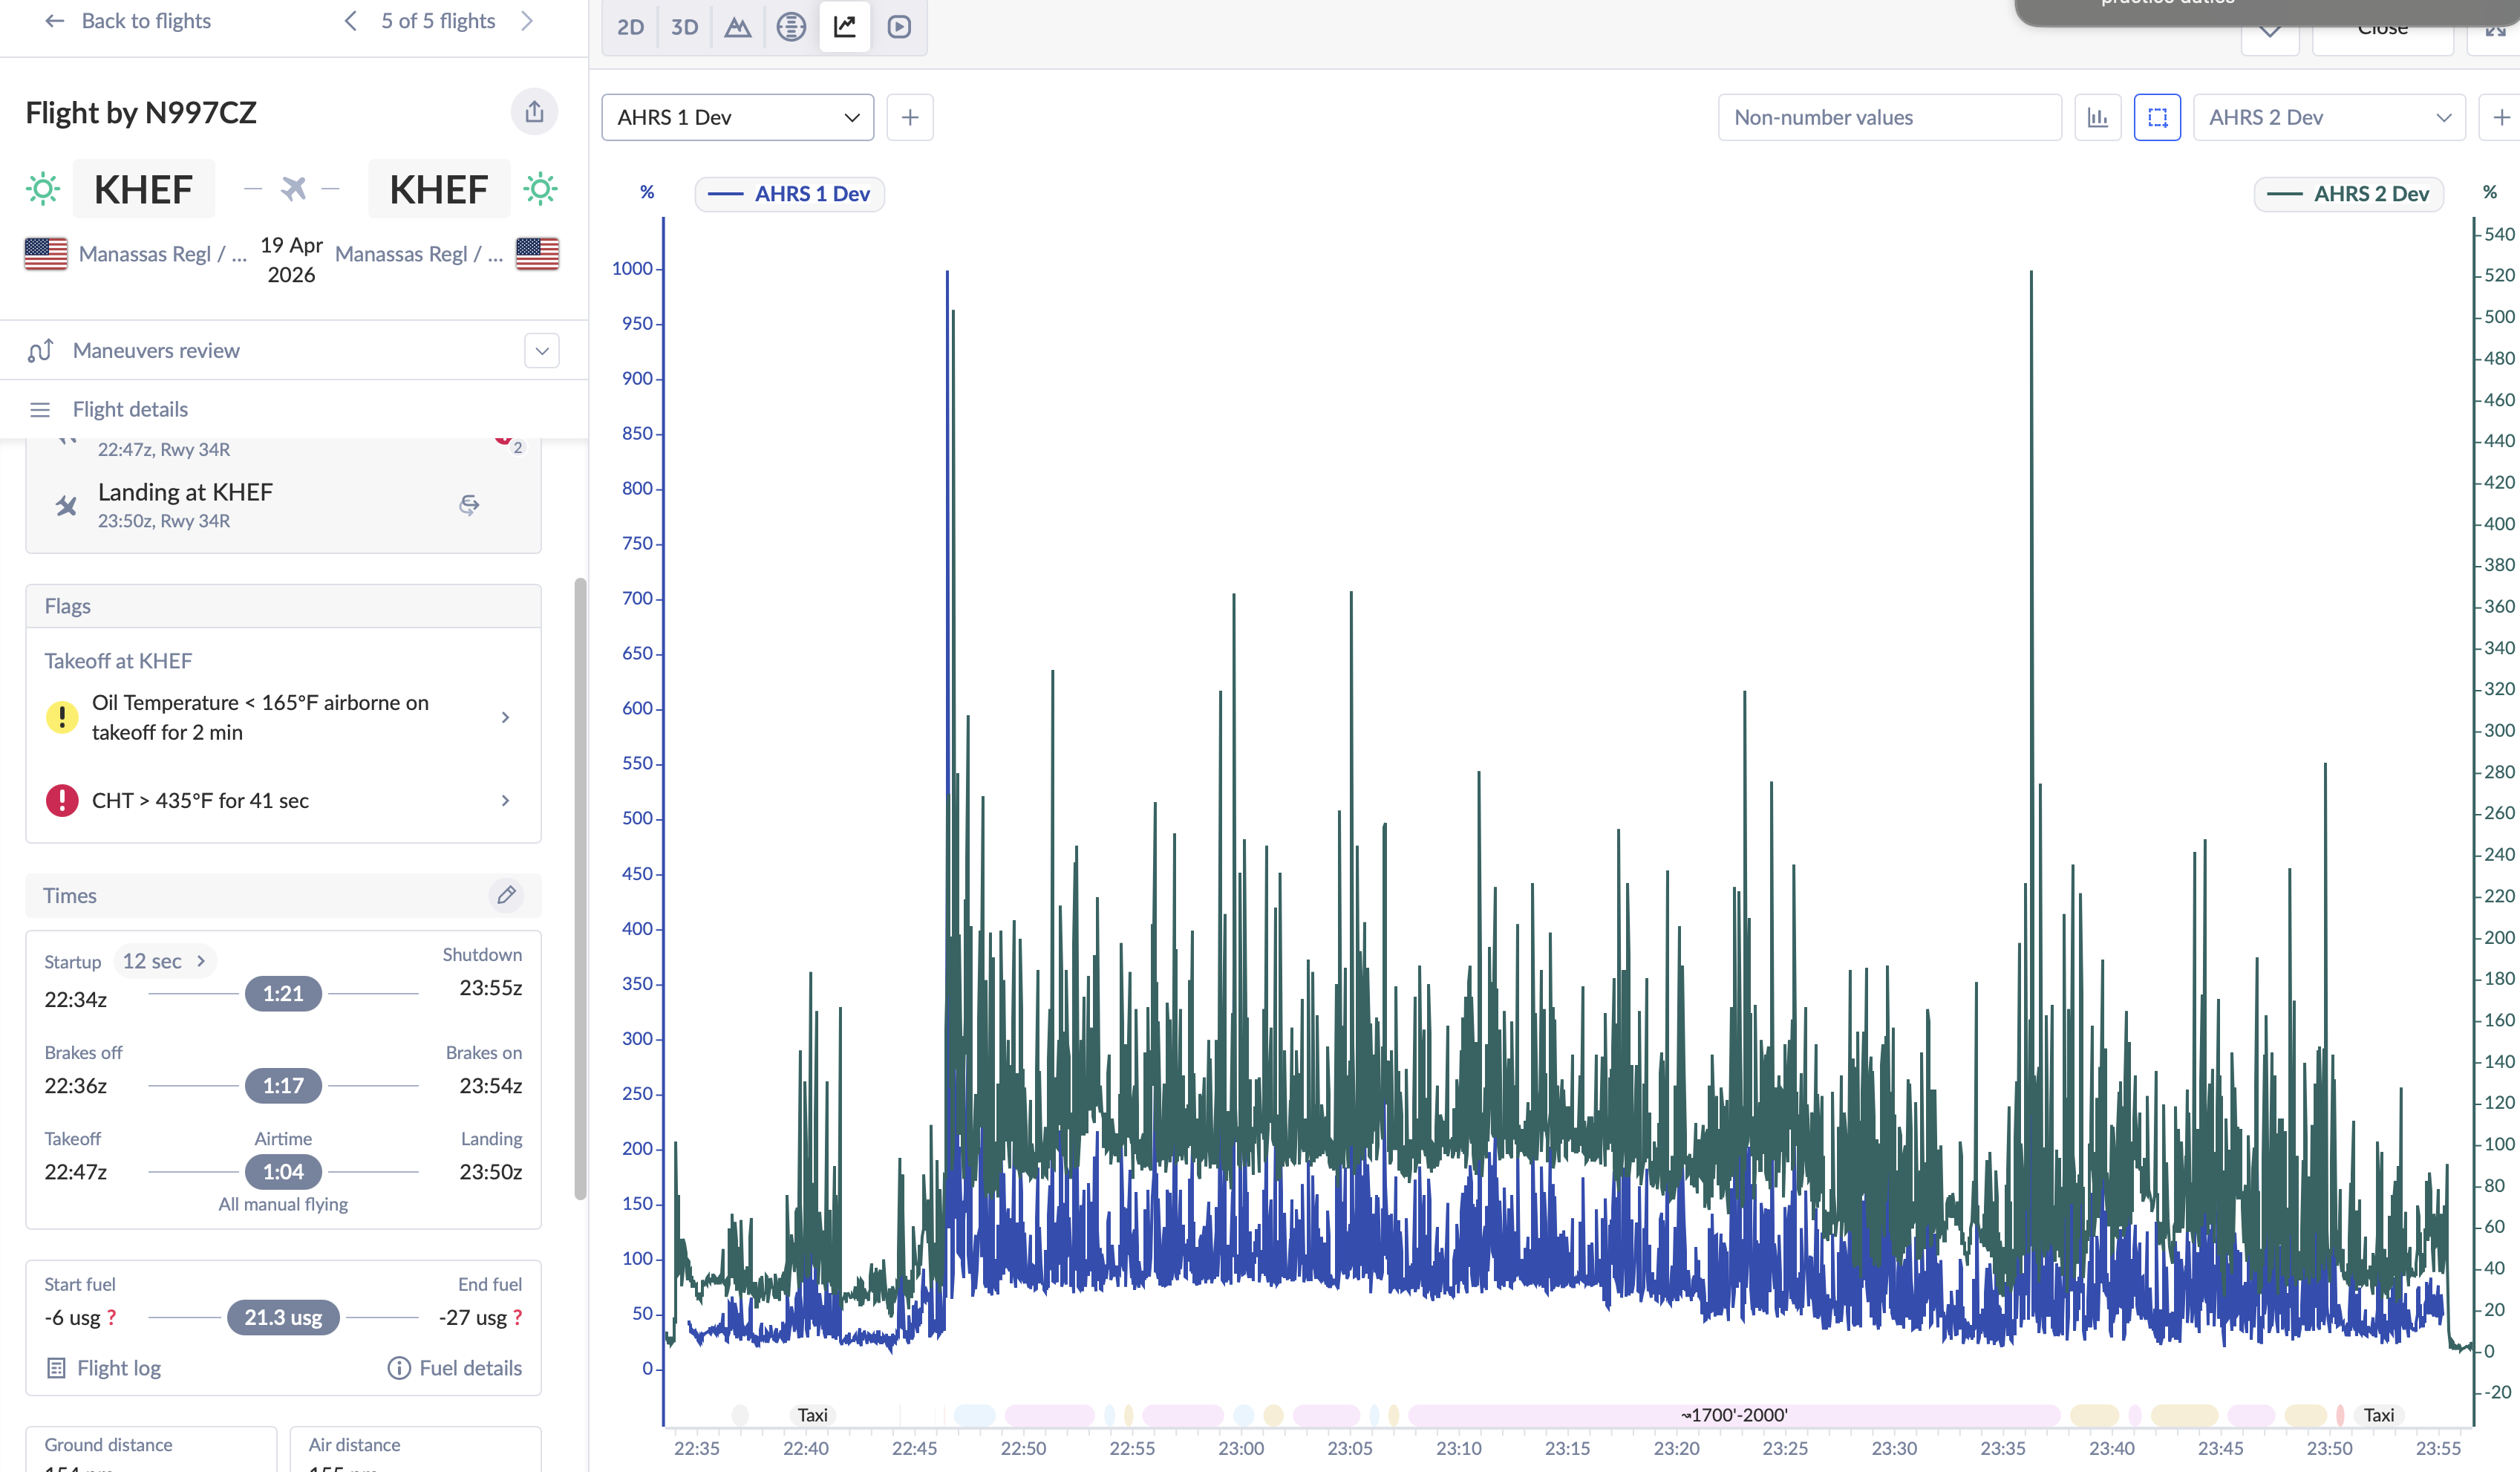
The whole point of doing this was to clean up the ADAHRS environment. The G3X logs the ADAHRS percent-deviation on every flight for all three units — the two GSU 25C ADAHRSes on the sub-panel, and the G5 standby on the main panel — so the question was whether the flight-after-flight median deviation actually came down once the prop was smooth.

It did:

Bar chart of median and 95th-percentile ADAHRS deviation across all 10 N997CZ flights, for ADAHRS #1, ADAHRS #2, and the G5 standby. A vertical dashed line at F5.5 marks the dynamic prop balance. Pre-balance medians cluster at 80–115%; post-balance flights F7–F9 drop into the 18–58% range.

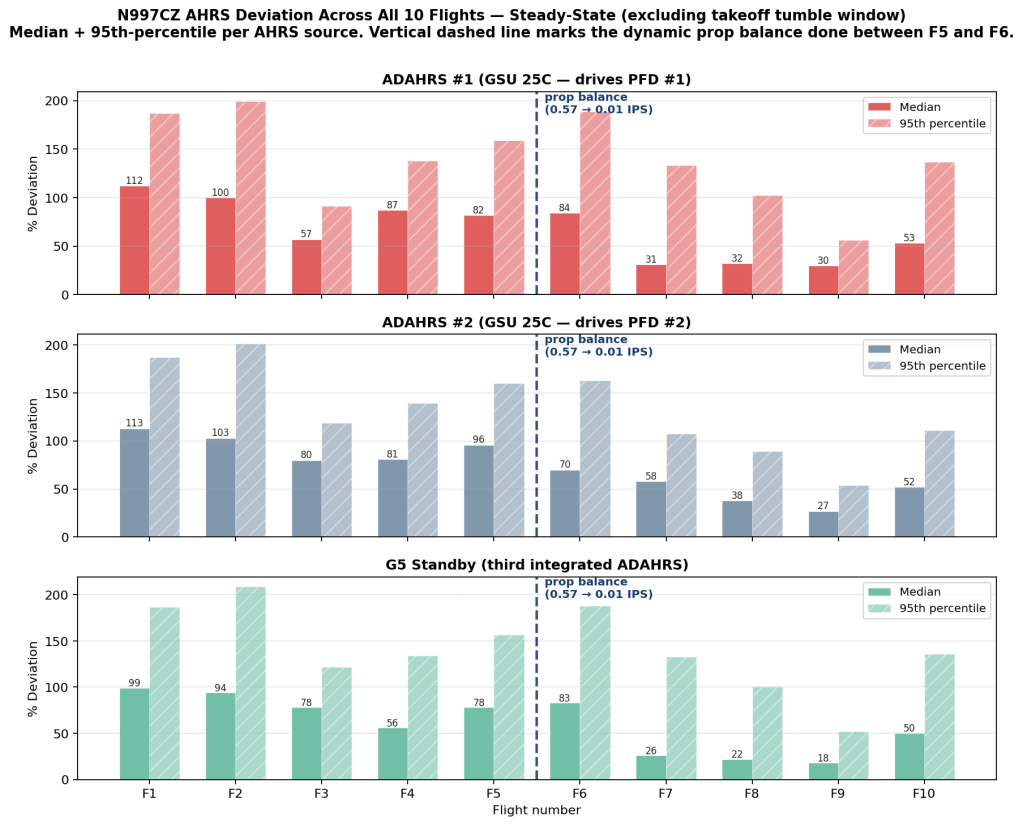
Each panel is one ADAHRS source: the two GSU 25Cs and the G5 standby. The dashed vertical line is where the prop balance happened — between Flight 5 and Flight 6. Median deviation values pre-balance hovered in the 80–115% band across all three units. The first post-balance flight (F6) was a short low-altitude shakedown and showed only modest improvement, but F7 through F9 — the first three flights at altitude after the balance — settled into the 18–58% band. Median deviation roughly halved on the GSU 25Cs and dropped by nearly 75% on the G5.

That last detail — that the G5 showed the biggest relative improvement — fits the geometry: the G5 lives on the main instrument panel, further aft from the firewall and the engine, with more structural compliance in the path between it and the source of the vibration. With the engine vibration that was reaching it now ~57× smaller, the residual deviation on that unit is dominated by other sources, and those sources are small.

What it didn’t fix

The thing dynamic prop balancing does NOT fix is the takeoff tumble — the PFD #1 attitude going upside down on the takeoff roll, every flight, 1–11 seconds after takeoff power application. That phenomenon was the original reason I started looking at ADAHRS data, and it has persisted unchanged through both the CAN bus rewire and the prop balance. Once two of the three leading environmental suspects (CAN noise, engine vibration) have been ruled out, what’s left is the GSU 25C hardware itself, and that’s now an open Garmin case against Service Bulletin SB 2144. (More on that in a future post.)

The takeaway

If you’ve got an experimental airplane with a fresh engine/prop install and you haven’t done a dynamic balance yet, it is — based on this single data point, take it with appropriate salt — worth the afternoon. The before/after on cabin feel is obvious, the before/after on ADAHRS deviation is measurable, and getting into the Excellent or Perfect band is achievable with patience and trim washers.

Twelve runs. Rough to Perfect.

N997CZ — CAN Bus Rewire: Fixing the Basics Before Chasing Vibration

After the ADAHRS vibration analysis across the first five flights, Garmin’s guidance was unambiguous: fix the CAN bus first, then work the vibration problem. The data showed sustained % deviation throughout every flight — but some of those readings may have been contaminated by CAN bus dropouts rather than pure vibration. You can’t separate the two until the bus is clean.

So before touching the prop balance or the ADAHRS mounts, we pulled the old harness and rewired the entire CAN bus from scratch with the correct 120Ω controlled-impedance spec wire.

Why does this matter? Garmin specifies a maximum CAN bus length of 20 meters (66 feet) using controlled-impedance twisted pair wire. The original N997CZ installation used standard shielded twisted pair — not the specified 120Ω wire — and measured approximately 96.5 feet total. Both the wrong wire and the excessive length can cause impedance mismatches, signal reflections, and the kind of intermittent dropouts Garmin’s tech support confirmed in Flights 1–3.

Before and After: Every Node on the Bus

The CAN bus in N997CZ runs as a daisy chain from the PFD1 terminator through thirteen avionics boxes to the roll servo terminator at the far end. The measurements below are the wire lengths between adjacent nodes — not the lengths attributable to any single box.

Node Was New length
PFD1 TERM

63" 28"
G5 Sockets

55" 20"
ADAHRS #1 Sockets

34" 15"
ADAHRS #2 Sockets

83" 20"
EIS Sockets

89" 28"
Audio panel 3-row pin

86" 28"
GMC507 autopilot 3-row pin

84" 28"
GAD27 Sockets

71" 37"
MFD Sockets

73" 36"
PFD2 Sockets

75" 35"
COM2 (GTR20) Sockets

32" 28"
GAD29 ARINC Sockets

193" 181"
Pitch servo

220" 208"
Roll servo TERM
Total 1,158" / 96.5 ft 692" / 57.7 ft

Wire lengths in inches between adjacent CAN bus nodes. New length = larger of wire-only vs. shield & pin measurement. Garmin max: 792" / 66 ft.

96.5 ft
Old total
57.7 ft
New total
−38.8 ft
Saved
66 ft
Garmin max
The new harness comes in at 57.7 ft — comfortably under Garmin’s 66 ft maximum. The old harness was 30.5 ft over spec.

What’s Next

With the CAN bus now on spec wire and properly sized, the next flights will establish a clean baseline. If the % deviation drops significantly, that confirms the old wiring was a major contributor. Whatever remains after that points squarely at vibration — and the prop balance, SB 2144 GSU assessment, and mount evaluation are queued up to address it.

N997CZ — Chasing Vibration: Five Flights of ADAHRS Data, a Tumbling Horizon, and What the Community Helped Me Figure Out

If you’ve been following the N997CZ build journal, you know the first five flights have been a mix of exhilarating milestones and humbling detective work. Flight 1 was a dream. Flight 2 sent me home early with erratic oil temperature gauges. Flight 3 gave me two solid hours and flaps for the first time. Flight 4 found an alternator belt slipping. But threaded through all of them was something I kept noticing and not fully understanding: in every single flight, the PFD #1 artificial horizon has tumbled upside down at least once.

That’s not a nuisance — that’s a serious ADAHRS event. Once I started pulling the deviation data from all five flights and laying them side by side, the pattern became impossible to ignore. I posted the data to the Van’s Air Force build thread and the community response was immediate, deep, and directly useful. This post is about what the data shows, what the community has experienced, what Garmin tech support confirmed, and my current working theory: this is primarily a vibration problem — with CAN bus wiring issues thrown in as a secondary layer.

What Does “ADAHRS % Deviation” Actually Mean?

N997CZ actually carries three ADAHRS units, all integrated into the G3X system. The G3X Pilot’s Guide confirms that the G3X supports up to three ADAHRS sources, with the G5 functioning as a full participant in the cross-comparison and miscompare monitoring via CAN bus — not a standalone backup, but a third integrated ADAHRS. The G3X uses two GSU 25C units — ADAHRS #1 and ADAHRS #2 — plus the Garmin G5, all cross-checked against each other. Both GSU 25Cs are mounted on the sub-panel directly forward of PFD #1. The G5 sits in a separate location, which makes its deviation data a valuable third data point — if its profile looks different from the GSU 25s, it helps localize where the disturbance is worst. That data is being pulled and will be added in a follow-up.

Before diving into the charts, an honest caveat: Garmin has not publicly disclosed what % deviation actually measures internally. We asked. They didn’t specify. So everything below is interpreted with that uncertainty in mind. It could be a cross-check residual between the two GSU 25 units, or something internal to each unit — perhaps related to Kalman filter covariance, or how much raw IMU data agrees with the filter’s predicted state. Without Garmin’s definition, we can’t be certain.

Working assumption: % deviation is a proxy for disturbance severity — higher is worse, sustained high values indicate a real problem. Garmin tech support declined to specify what maximum acceptable values should be. The 999% hard pegs have not been confirmed as caused by CAN bus dropouts specifically. Garmin’s guidance: fix the CAN bus first, then re-evaluate what remains.

Hypothesis on the 999% spikes: These hard pegs likely occur during takeoff as RPM sweeps upward from idle. The rising forcing frequency sweeps through the natural resonant frequency of the ADAHRS mount — where vibration transmission into the sensor peaks. Once RPM stabilizes at cruise, the deviation drops to an elevated-but-lower baseline. This is consistent with classic mass-spring-damper resonance behavior and with community reports of problems being RPM- and power-setting-dependent.

Several things can drive this, in rough order of likelihood for a new RV-10: an unbalanced or un-clocked prop; GSU 25 mount resonance amplifying vibration at one sensor location; loose lower cowl hinge pins transmitting vibration into the firewall; and CAN bus dropouts causing the cross-check math to fail and peg at 999%.

Five Flights of Data

Blue = ADAHRS #1 | Teal/green = ADAHRS #2. A flat, quiet trace near zero is healthy. What you’ll see instead is large % deviation in both sensors from takeoff to touchdown across all five flights — sustained throughout every flight, not isolated spikes.

Flight 1 — April 11, 2026 (First Flight, 127 nm)

Flight 1 ADAHRS deviation chart
Flight 1: Large deviation in both units throughout. ADAHRS #2 (teal) consistently worse than #1 (blue), with a hard 999% peak at 13:00:38.

The very first flight and already there’s a clear problem. Both sensors show elevated deviation from shortly after takeoff through landing. ADAHRS #2 is consistently worse than #1, with a hard 999% peak around 13:00:38. The sustained asymmetry between the two units throughout the flight points to a physical difference in what each sensor location is experiencing. The horizon tumbled on this flight — PFD #1 only.

Flight 2 — April 17, 2026 (Abbreviated, 68 nm)

Flight 2 ADAHRS deviation chart
Flight 2: Same sustained pattern. ADAHRS #2 consistently higher than #1, with another 999% peak at 17:07:09.

Identical story to Flight 1. Large deviation in both sensors from takeoff to landing, #2 running consistently worse than #1. The repeatability across two flights makes it clear: this is not random noise. The horizon tumbled again.

Flight 3 — April 18, 2026 (Two Hours West, Flaps First Time)

Flight 3 ADAHRS deviation chart
Flight 3: Both units elevated throughout. Notable concurrent peak at 11:13:06 — #1 at 229%, #2 at 233% simultaneously.

The two-hour flight shows the same sustained high deviation. What’s notable is a concurrent peak where both sensors reach similar values (229% and 233%) at the same moment — suggesting the disturbance is either broad enough to affect both locations equally, or the CAN bus dropouts confirmed by Garmin are contributing.

Flight 4 — April 18, 2026 (Alternator Belt Discovery)

Flight 4 ADAHRS deviation chart
Flight 4: Sustained deviation throughout, #2 again significantly worse than #1. Peak: #2 at 999%, #1 at 26% at the same timestamp.

Large deviation in both sensors across the whole flight, #2 running consistently worse again. Flight 4 was when we discovered the alternator belt was slipping, though the ADAHRS deviation pattern is consistent with every other flight.

Flight 5 — April 19, 2026

Flight 5 ADAHRS deviation chart
Flight 5: Both units show large, sustained deviation throughout — consistent with every prior flight.

Both sensors show large sustained deviation from takeoff to landing, same as every prior flight. The consistent, high deviation across all five flights is itself the story: this is not a problem that comes and goes — it is present in every flight, start to finish.

Coming next — G5 data: The Garmin G5 is mounted in the main instrument panel, further aft than the two GSU 25Cs on the sub-panel. The sub-panel is tied directly to the firewall via a fore/aft rib, making it a near-direct receiver of engine vibration. The main panel is at the end of a longer structural path with more joints and compliance. If the G5’s deviation runs lower than the GSU 25s — which early recollection suggests — that would directly implicate the sub-panel’s structural coupling to the firewall. That data is being extracted and will be added in a follow-up.


What the Van’s Air Force Community Has Experienced

I posted the data to the N997CZ build thread on VAF and the response was both immediate and sobering: this is a well-known problem, and multiple experienced builders have been down this exact road.

The GSU 25 Mount Location Is the Central Issue

Both GSU 25s are mounted on the sub-panel in the upper-left corner — close to the display, accessible, tidy. But multiple builders reported this location is problematic on the RV-10, and several noted a frustrating catch: Garmin’s ground-based vibration test passes in essentially every position. The only meaningful test is in flight at full power.

The community consensus is that stiffening the sub-panel — adding 0.063 angle stock, doublers, or bracing — doesn’t reliably solve the problem. Making the bracket stiffer just makes it a better conductor of vibration rather than isolating it. Multiple builders who resolved the problem did so by relocating the GSU units entirely: some to the back of the GDU display (despite Garmin’s manual discouraging this), others to a remote aft mount.

The community’s blunt summary: ground vibration tests are a waste of time for diagnosing this. You can’t simulate full power and flight conditions on the ground, and the GSUs will pass the test in any position — then fail in flight. The only data that matters comes from the air.

The Cowling Hinge Pin Fix (An Unexpected One)

One builder shared a fix I wouldn’t have thought to look for: the standard Van’s lower cowl piano hinge vertical pins. Their ADAHRS problem persisted through a sub-panel stiffener and a GSU hardware swap under the Garmin service bulletin. The breakthrough came when someone noticed the lower cowl vertical pins allowed a tiny amount of flex — detectable by hand-pressing the sides of the cowl against the firewall. Replacing those pins with slightly oversized ones resolved the AHRS drift over 30+ hours of subsequent flying.

The diagnostic tell was clean: the ADAHRS ground test passed with the cowl off and failed with the cowl on. N997CZ already uses heavier-than-standard pins, but I’ll be checking the lower vertical pins specifically — it’s a low-cost check worth doing early.

Garmin Service Bulletin SB 2144 — Both My Units Are Affected

Garmin issued SB 2144 specifically addressing GSU 25 units susceptible to “acoustic noise energy” — their language for vibration-induced sensor degradation. The bulletin was traced back to COVID-era supply chain issues that resulted in different MEMS components being used in a production run of units. Both of my GSU 25Cs fall within the affected serial number range.

Some builders had both units replaced under SB 2144 and reported clean results. However, others found the hardware upgrade alone wasn’t sufficient — it took the cowl pin fix or a mount relocation on top of the new units. The SB appears to be a necessary step, but not necessarily sufficient on its own.

Van’s Service Bulletin SB-00028 — Rubber Isolators

Van’s issued SB-00028 (currently RV-12 specific) directing owners to assess ADAHRS performance and, where issues are found, install rubber isolators on the GSU mounts. This directly contradicts Garmin’s guidance to mount to “the stiffest part of the airframe.” The community notes the irony, and the flight experience of multiple builders suggests Van’s got it right.

The Stiff vs. Soft Mount Debate

The intuition for stiff mounting is that it keeps the sensor stable relative to the airframe. But that logic breaks down when the airframe itself is vibrating: a stiff connection transmits vibration energy directly into the sensor. The natural frequency of a mounted system is fn = (1/2π) × √(k/m). You want fn well below the engine’s excitation frequencies — which means lower stiffness k and higher mass m. Soft rubber isolators reduce k; adding mass to the isolated platform reduces fn further.

A useful analogy: mechanical vibration systems map directly to RLC electrical circuits — mass to inductance, spring stiffness to 1/capacitance, damping to resistance. A low-pass filter attenuating high-frequency noise is doing the same job as a soft, heavy vibration isolator. The back-of-GDU solution likely works through both added mass and reduced stiffness in the mount path, arriving at isolation inadvertently.

Mechanical vs. electrical vibration isolation analogy
Mechanical mass-spring-damper system and its RLC circuit electrical analog — the math is identical, so filter design intuition translates directly to mount design.
Softer spring and heavier mass lower the resonant frequency
Softer spring (lower k) and heavier mass (higher m) both push fn down — the goal is to get the resonant frequency well below the engine’s excitation band.

Even Aft Mounts May Need Additional Reinforcement

One builder who relocated to Van’s designated aft ADAHRS mount (behind the baggage compartment) still had significant vibration issues during Phase 1. The eventual solution was adding substantial metal reinforcement to the mount structure. Their full troubleshooting documentation is in a dedicated VAF thread: GSU-25 Remote Mount Vibration Issue — worth reading before deciding on a relocation strategy.


What Garmin Tech Support Confirmed

CAN Bus Dropouts Confirmed in Flights 1–3

Garmin confirmed intermittent CAN bus dropout signatures in the first three flight logs. What causes the 999% hard pegs specifically has not been established — the dropouts are a confirmed concurrent issue, but attributing those particular readings to the bus alone would be premature. Garmin’s guidance: fix the CAN bus first, get clean logs, then evaluate what vibration problems remain.

CAN Bus Length: ~87 Feet vs. 66-Foot Maximum

Garmin’s maximum recommended CAN bus length is 20 meters (66 feet). My estimate puts the total run in N997CZ at ~87 feet — about 21% over spec. Beyond that length, signal reflections and attenuation degrade bus integrity, especially with non-spec cable.

Wrong Wire: Standard Twisted Pair Instead of 120Ω Controlled-Impedance

The CAN bus requires 120Ω characteristic impedance. Standard aircraft twisted pair (~$1/ft) doesn’t reliably hit that spec, causing signal reflections that look like dropouts at the receiver. Garmin specifically recommends Carlisle IT P/N CAN24TST120(CIT) or GigaFlight P/N GF120-24CANB-1 (~$7/ft). Estimated rewire cost: $420–$560 in cable for a 60–80 ft run.


Two Problems, a Ranked Action Plan

Problem 1 — Fix First (per Garmin): CAN Bus. Wrong wire spec, over-length run, confirmed dropouts. Resolve this completely before evaluating what vibration problems remain.

Problem 2 — Address After CAN Bus Is Clean: Vibration. The tumbling horizon and escalating deviation pattern across five flights make it clear something is wrong — the clean-CAN-bus baseline will tell us how much of it is vibration.

  1. Measure CAN bus run length precisely before ordering wire.
  2. Rewire CAN bus with Carlisle IT CAN24TST120(CIT) or GigaFlight GF120-24CANB-1. Verify 120Ω termination at both ends.
  3. Re-fly and pull fresh logs — establish a known-good CAN bus baseline.
  4. Dynamic prop balance — highest-yield vibration fix, lowest cost. Also explore prop re-clocking.
  5. Contact Garmin re: SB 2144 — both GSU 25Cs are in the affected serial number range.
  6. Inspect lower cowl vertical hinge pins for any play. Replace with oversized pins if flex is detectable.
  7. Evaluate GSU mount options — rubber isolators on current sub-panel location, or relocation to GDU back-panel or aft Van’s mount with reinforcement.
  8. Post-fix flight test — five clean flights, deviation at baseline, horizon that stays put.

I’m cautiously optimistic that this is all solvable — the VAF community has collectively worked through every one of these failure modes, and there are clear paths forward. But I want to earn that optimism with data, not just a plan.

If you’ve dealt with ADAHRS deviation on your own build, or have experience with the SB 2144 units, I’d love to hear from you in the comments or over on the VAF thread. This community has already saved me multiple trips down dead ends and I’m grateful for every one of those replies.

N997CZ is a homebuilt experimental aircraft (Van’s RV-10). This post documents personal experience during Phase 1 flight testing. Nothing here constitutes maintenance or airworthiness advice. Consult your avionics manufacturer and A&P/IA for guidance specific to your aircraft.

Flight 4: N997CZ — Alternator Belt Blues (and a Better Landing!)

If Flight #3 was the calm, confidence-building morning session, Flight #4 — same afternoon — reminded me that experimental test flying keeps you humble. We got up, noticed something electrical wasn’t quite right, came back down, pulled the cowl, and figured it out. That’s the program, and the Garmin G3X makes this kind of detective work so much easier.

I’m sharing the full data and photos below in case anyone else has been down this road with their IO-540 alternator installation — and I’d genuinely love to hear your thoughts in the comments.

The Setup: Two Flights in One Day

Flight #3 happened early that same morning at KHEF — a roughly two-hour session that went really well. First flap deployments, west-side practice area, calm winds. You can watch the Flight 3 footage here, which covers that morning session right before this one:

By evening I was back at the airport for a second bite at the apple. The controller on duty hadn’t seen our experimental test program before, so we had a good chat on the radio about the practice area setup. During the run-up I noticed the mag drop on each side — left conventional magneto and right SDS CPI-2 electronic ignition — was running around 160 RPM per side, a bit more than I’m used to from my RV-7 background.

Mag drop of ~160 RPM per side with a conventional mag on the left and SDS CPI-2 on the right on an IO-540. Does that sound about right for this combination? I’d really appreciate a comparison point from other builders running this setup.

The Takeoff Smell — and the First Clue

Takeoff on 16L was otherwise normal. Almost immediately after rotation I caught a mild burning smell — subtle, but on a 4th-flight experimental you don’t ignore subtle. I knew we had a small burn spot on the cowl interior from an earlier exhaust pipe contact (now protected with aluminum foil tape and the pipe repositioned), so it might have been residual. But then the electrical picture started to change.

Normally Alternator 1 carries the bulk of the load and Alternator 2 handles residual backup loads. On this flight, Alt 1’s ammeter dropped into single digits — well below what the aircraft was actually drawing. Battery 1 was starting to discharge. Cycling the ALT 1 switch would briefly coax it back, but it wouldn’t hold normal output.

RV-10 N997CZ Flight 4 – G3X electrical page showing Bus 1 voltage dropping, VOLTS flagged in yellow
The G3X electrical page showing Bus 1 VOLTS flagged in yellow-orange, dropping out of the normal charging range. Bus 2 stayed healthy throughout. The data log shows Amps 1 fading from ~27A at rotation to just 4–5A mid-flight — well below what the ship was drawing.
RV-10 N997CZ Flight 4 – Pointing to the ALT 1 switch on lower console, slipping alternator belt
The ALT 1 switch on the lower console. I cycled this several times in flight — it would briefly recover then fall off again. That intermittent behavior pointed toward mechanical (belt slipping) rather than electrical (regulator or field) as the cause.

What the G3X Data Shows

This was a short flight — about 13 minutes airborne, max altitude 2,031 ft MSL, max IAS 166 kts. But the electrical log tells the story clearly. Bus 2 held solid at 14.1–14.2V throughout; Bus 1 steadily lost ground as Amps 1 faded from 28A to just 4–5A while Battery 1 discharged.

TimeBus 1 VoltsBus 2 VoltsAmps 1Amps 2Alt (ft)
19:0013.513.92825298
19:0113.514.024211,138
19:0213.414.122161,629
19:0413.214.213101,722
19:0613.014.2592,009
19:0812.914.2491,936
19:1012.914.2491,083

The decision to return was easy: no imminent emergency — Battery 2 and Alt 2 were healthy, and Battery 1 still had reserve — but continuing to discharge an unknown cause wasn’t prudent at this stage of testing.

Engine Temps: CHTs and Oil Temperature

While the electrical issue was the main story, I was watching engine temps closely too. CHTs peaked at 441°F on CHT-1 this flight, with cylinders 1, 2, 5, and 6 still running warmer than 3 and 4 — a consistent pattern since Flight #1 that seems to be gradually improving with each flight. Cylinders 3 and 4 are now comfortably below 350°F in cruise, which is encouraging.

Oil temperature came in at 215–220°F at taxi-in after landing — higher than I’d like, though this was after a high-power takeoff and immediate return to land with very little cruise cooling. We also found the oil cooler airflow door wasn’t quite at 90° open (the winter-operation door should be fully open in summer), so we straightened it. We’ll see if that makes a difference on the next flight.

RV-10 N997CZ Flight 4 – G3X engine page showing CHT temperatures, oil temp, and flagged VOLTS tile
The G3X main engine page mid-flight. CHTs running 363–368°F here, peaking at 441°F on CHT-1 during the flight. Oil temp visible on the left PFD engine section, climbing toward the 220°F seen at taxi-in (OAT 77°F). The VOLTS tile in the lower right is already flagged. Engine Hours 4.6 / Cycles 2.

The Post-Landing Find: Alternator Belt

After landing we pulled the cowl. The culprit was immediately apparent: noticeable slack in the alternator belt. Not a broken belt, not a failed regulator — just insufficient tension. Both the main lower pivot bolt and the smaller tensioning bolt were intact and the tensioning bolt was still safety-wired, but the belt had clearly stretched or the alternator had shifted slightly.

We loosened both bolts, used a screwdriver to lever proper tension back into the belt, re-tightened everything, and re-safety-wired. The intermittent charging behavior in flight — briefly recovering when I cycled the switch, then dropping off again — makes perfect sense in hindsight: the belt was marginal and slipping under load. I’m relieved it wasn’t a chafed or burned wire. Battery 1 went on the wall charger overnight.

The belt seemed fine at install and through the first three flights. Did it stretch after initial heat cycling? Is there a recommended belt tension spec or a “check after first N hours” item for the Lycoming IO-540 alternator drive I should be following? Would love to hear from anyone who’s been down this road.

Oil Cooler Door — Another Small Fix

As noted above, we found the oil cooler winter-operation door sitting at slightly less than 90° open, potentially restricting airflow to the cooler across all previous flights. We adjusted it to fully open. With the shorter flight profile and high-power takeoff, the 220°F oil temp is plausibly explained by the flight itself rather than restricted airflow — but the door is now confirmed fully open and we’ll have cleaner data going forward.

The Landing: A Real Improvement

Not all problems this flight. The full-flap landing at the end of Flight #4 was noticeably better than the steep close-in approach at the end of Flight #3. In Flight #3 I was at virtually full aft stick at roundout with nothing left in reserve — the RV-10’s limited elevator authority at forward CG with full flaps on a steep approach is a real thing.

For Flight #4 I used a much shallower approach angle, carried a touch more power, kept the nose slightly higher, and touched down at about 64–65 knots indicated. The flare felt natural and in-control. This will be the approach profile going forward.

Note on CG: Flying a fairly forward CG for these initial flights — intentional for early test stability — with ballast in the rear seats to nudge it back slightly. Limited elevator authority at forward CG + full flaps + steep approach is a documented RV-10 characteristic. Curious how others have managed approach technique in this configuration during early flights.

Items Still on the List

AHRS 1 tumbling on takeoff: PFD-1’s artificial horizon tumbles consistently when I apply takeoff power — every single flight. PFD-2 stays solid so it’s not a safety issue right now, but I want to understand it. Vibration? Connector seating? Has anyone seen this in a G3X installation?

CHT temperatures: Still watching closely. Peak temps hit 441°F on CHT-1. The hotter cylinders (1, 2, 5, 6) seem to be gradually trending down with each flight as the rings seat. Hoping to see all six under 400°F in level cruise before long — does that sound like a realistic expectation at ~4.5 engine hours, or should I be looking at baffling adjustments?

Fuel float gauges: Still getting hung up at the full position. Not urgent since the totalizer is primary, but the mechanical float/wire fit issue inside the tanks needs to be addressed eventually.

What’s Next

Before Flight #5: re-verify alternator belt tension and confirm Alt 1 charging properly on a ground run. Assuming that checks out, the goal is continued envelope expansion — more time at altitude, more cruise data, and continued CHT monitoring as the engine breaks in.


Your turn: If you have experience with alternator belt tension on Lycoming IO-540 installations, SDS CPI-2 mag drop numbers, G3X AHRS tumbling on takeoff, CHT break-in patterns, RV-10 approach technique with forward CG, or oil cooler management — please drop a comment below. Whether you’re an RV builder, an A&P, or just following along, your input is genuinely welcome here.

Please join the discussion or send feedback here: VAF Thread — RV10 N997CZ Takes to the Skies

Flight 2: N997CZ — Erratic Gauges, an Early Landing, and a Lesson in Crimp Connections

Flight 2 took place a week after the first flight, on April 17, 2026. If you haven’t read the first flight post, that’s probably the right place to start — it covers the aircraft, the context, and the CHT spike that set the stage for everything that followed.

This one was shorter, more stressful, and ended with a maintenance discovery that turned out to be both the cause of the problem and a straightforward fix. Here’s what happened.


The Setup

The original plan for Flight 2 was the same as Flight 1: west side of the field, 1,800 feet MSL, north-south legs in the practice area. But when I made the coordination call to Manassas tower that morning, the picture changed.

The controller asked me to keep my pattern on the east side of the field. On the east side, they could give me 1,400 feet MSL — 400 feet lower than Flight 1, and on the side of the field with less room to work in. For a second Phase 1 experimental flight, that wasn’t ideal. But it was what was available that day, so that’s what we did.

Full fuel on both sides — 30 gallons left, 30 gallons right.


The Flight

Takeoff was unremarkable except for two things that repeated from Flight 1: the AHRS-1 attitude indicator tumbled on the takeoff roll (same behavior as before — isolated to PFD1, PFD2 and the G5 standby both remained stable), and CHTs spiked above the warning limits during climb. This time all six cylinders went over 435°F, peaking somewhere in the 460–475°F range before settling down. Higher than Flight 1’s peak, which was unwelcome, and attributable to the later time of day and warmer ambient temperatures.

We were at 1,400 feet MSL with a compact pattern on the east side of the field. Not exactly the relaxed cruise conditions you’d want for watching CHTs settle, but the temperatures did come down as we moved out of the climb and into cruise power.

Then the Oil Temperature Started Misbehaving

Flight 1 had shown clean, stable oil temperature throughout. Flight 2 did not.

Partway through the flight, the oil temperature gauge spiked suddenly to an obviously unrealistic reading — well above what oil temperature can physically reach in a few seconds. I knew it wasn’t a real temperature (temperature can’t rise that fast), but an erratic gauge is still an erratic gauge. I noted it and kept flying.

It happened again. Then a third time — and this time the gauge didn’t just spike, it went dark. No reading at all for a minute or two.

Oil temperature gauge showing three erratic spikes and a dropout during Flight 2
The oil temperature trace from Flight 2. Three erratic spikes to off-scale high readings, followed by the gauge going completely dark. Oil pressure remained stable throughout — the problem was instrumentation, not the oil system itself.

Oil pressure was steady the entire time — 75–80 psi, never wavering. That was reassuring. A failed oil system shows up in the pressure first; the pressure was fine. But flying with no oil temperature indication, in a tight pattern at 1,400 feet, on a second experimental flight, with CHTs that had already been high — that was enough. I made the call to land early and figure it out on the ground.

Total flight time: approximately 28 minutes. Fuel burned: 9.5 gallons from the left tank (confirmed by both the totalizer and the fuel truck, which put exactly 9.5 gallons back in).


The Diagnosis

Post-flight, we went looking for the cause. It didn’t take long.

In the firewall-forward wiring, near the oil temperature probe, we found a crimp connector that hadn’t grabbed the wire properly. When we unwrapped the bundle and pulled on the wire, it came free by hand — zero resistance. That was the culprit: an intermittent connection that would open under vibration, spike the reading to an implausible value, then reconnect. The third time it disconnected, it stayed disconnected long enough to drop the gauge entirely.

I’d actually noticed some finickiness with these wires before the first flight — wiggling the bundle in the hangar had produced erratic gauge readings on the ground. I wasn’t able to reproduce it consistently enough to isolate the cause before Flight 1, and it didn’t manifest during Flight 1. It clearly manifested during Flight 2.

The fix: re-do the crimp, properly this time. Wrap the bundle back up. Done.

Flight 3 would show whether the fix held.


What I Took Away

Flight 2 was short and more stressful than I’d planned. But the outcome was fine—nothing broke, I made a conservative decision to land when my instrumentation became unreliable, and we found and fixed the actual problem before the next flight. That’s the process working as it should.

A few things I’m carrying forward:

  • Known issues need abort criteria before departure. If something is behaving oddly on the ground, decide in advance what you’ll do if it shows up in the air. Don’t leave that decision for the moment.
  • Airspace coordination is worth doing ahead of time—and worth holding firm on. Getting assigned the east side at 1,400 feet added unnecessary pressure to an already-demanding flight. For subsequent flights, I’ve made a point to coordinate specifically for the west side of the field. Until I have full confidence in the aircraft and it’s ready to venture further outside the Class Delta for the remaining flight test program, having the more open, higher-altitude practice area on the west side is genuinely important—not just a preference. I’d encourage any experimental builder doing early Phase 1 testing at a busy Class D airport to have that conversation with the tower in advance, and be clear about what you need and why.
  • The fuel totalizer appears accurate. Having the refueled quantity match the totalizer reading exactly was a genuinely useful data point—I’m more confident in that system now.

As always, if you’ve been through something similar—erratic instrumentation on an early test flight, a wiring issue that surfaced at an inconvenient time, or a tricky judgment call about when to land—I’d really like to hear about it in the comments. I don’t have all the answers on this airplane yet, and the conversations here have been more useful than I expected.

Up next: Flight 3: N997CZ — Two Hours West of the Field, Flaps for the First Time →

Please join the discussion or send feedback here: VAF Thread — RV10 N997CZ Takes to the Skies

2021 Annual Condition Inspection

Hobbs: 824.1, Tach: 735.4

Annual Condition Inspection started 2/27/21.

Compression check: 79/78/7878

Removed all wheel pants. Need to replace the right wheel. Left wheel and nose wheel were tires and tubes were replaced last year.

Lubricated aileron hinges, aileron external pushrod rod end bearing, flap lower (external) linkages. Lubricated prop, mixture, throttle, cabin heat, and alternate air push/pull controls both inside the cabin and outside in the engine compartment.

Removed spinner. Greased prop with 6 pumps of grease each side. Inspected bolts and safety wire. Reinstalled spinner.

Removed all baggage items from aircraft. Vacuumed carpet, removed interior carpet. Determined both magnetos had been previously IRAN’ed at 398.7 (left) and 525 (right) Tach times respectively. Current tach 735.4.

Removed 8 spark plugs.

Inspected and took pictures internal to each cylinder of intake and exhaust valves. Replaced all spark plugs with new.

RV7A Maintenance Work

3/3/17 Tach 162.6, Total Time 182.5

  • Fixed screen over fuel vents
  • Checked engine timing, good
  • Oil weep @ oil cooler hose fittings, upper & lower – tightened
  • Fixed air filter pop out from starting backfire
  • Fixed alternator wire chafing

3/26/17 Tach 170.3, Total Time 191.1

  • Changed oil; took oil sample; changed oil filter. Did not inspect oil suction screen.

4/12/17 Tach 172.5, Total Time 193.8

  • Changed 4 bottom spark plugs for new
  • Gapped 4 upper spark plugs
  • Installed lower cowl heat shield material

6/27/17 Tach 202.3, Total Time 227.9

  • Removed wheel pants
  • Removed wheels
  • Changed tires to new Dresser retreads, Goodyear Flight Custom III, & new tubes
  • Replaced both brake pads L & R
  • Repacked main wheel bearings L & R
  • Re-installed new tires & wheels
  • Re-installed wheel pants
  • Flew test flight to Winchester & back with John A.

7/1/17 Tach 203.9, Total Time 229.7

  • Larger retreads cracked wheel pants again on landing, so wheel pants were cutout more, and re-fiberglassed
  • Added white vinyl to nose gear leg fairing
  • Changed oil, filter, and checked oil suction screen

7/8/17 – 7/9/17 Tach 203.9, Total Time 229.7

  • Removed empennage fairing, painted with gloss white spray paint
  • Re-installed wheel pants
  • Oiled the exhaust stacks with mouse milk
  • Re-glued screen over L & R fuel vents

Miscellaneous ongoing maintenance

3/3/17

Replaced and re-glued the screens over both left and right fuel vent intakes.

There was a small weep of oil at the oil cooler / oil hose connections. I used steel fitting in the oil cooler (instead of aluminum) and did not get the oil lines tightened enough. I tried tightening them just a bit more while holding the steel fittings with another wrench. This seems to have stopped the slow weep.

I re-installed the engine air filter which had popped up from a small engine backfire during a previous start.

The alternator wire was chafing a bit. Fixed.

4/1/17

Changed oil. Took oil sample (was from end instead of middle of draining by accident). Changed oil filter. Did not change or check suction screen during this oil change.

4/12/17

Removed all 8 spark plugs. Determined 3 of 4 bottom spark plugs had lead build ups and decided to replace them (200 hours). Gapped the 4 upper plugs to < 0.020 and > 0.015 quickly but not very precisely.

Installed lower cowl heat shield material from Vans on the inside of the lower cowl to protect the fiberglass from the exhaust areas where it was starting to discolor.

First Annual

Aileron travel limits: section 15, page 15-2

Max Up/Down= 32/17
Minimum Up/Down= 25/15

Elevator  travel limits:

Max Up/Down= 30/25
Minimum Up/Down= 25/20

Measured 2016-12-10:

Ailerons: LU: 30, LD: 17, RU 32, RD 17

Elevator travel: 29 Up, 23 Down

max end of the range. i.e. 30* up and 25* down

Changed Oil

SB 14-02-05 Elevator Spar Cracks – Inspected – None found

SB 14-01-31 HS Front Spar Bend Cracks – Inspected – None found


http://www.precisionairmotive.com/servpubs.htm


Found wet B-Nut on rear side of fuel pump

Found loose spare AN365 nut under passenger seat pan
Found rivet junk in footwell area
Found plastic cap in footwell area
Removed passenger stick, cut zip ties
Removed left and right gear tower carpet covers
Found cracked engine baffle near oil cooler mount on #4 cylinder, added reinforcement
Each aileron trailing edge droops 3/16 when opposite aileron/flap/tip are in alignment
Routed GDL cable to dash top through hole
Added pin #15 on roll servo via spare white wire (CWS Disc) and spliced it into green CWS Disc wires for sticks under right passenger seat pan
Added prop leading edge tape
COMPRESSION TEST

/80        HOT_______COLD__Y__1._76__2._78__3.__78__4.__78__


SERVICE OR REPLACE SPARK PLUGS, GAP 0.016 TO 0.021

1B: 0.018 (Original)  1T: 0.018 (Newer Tempest)

2B: 0.018 (Original)  2T: 0.018 (Newer Tempest)

3B: 0.019 (Original)  3T: 0.018 (Newer Tempest)

4B: 0.018 (Original)  4T: 0.018 (Newer Tempest)

Install bottom plugs to 360-420 inch lbs torque (30-35 foot lbs)