N997CZ — Dynamic Prop Balancing: 0.57 IPS Down to 0.01

After the first five flights it was clear that N997CZ was sitting on more vibration than I wanted. The most visible symptom was the ADAHRS percent-deviation values logged by the G3X — they were chronically high during cruise on every one of the first five flights, and Garmin tech support had pointed out that high deviation values are often a sign that the attitude solution is fighting more vibration than it wants to. So when the airplane went into the hangar for the 25-day maintenance gap between Flight 5 and Flight 6, dynamic propeller balancing was one of three jobs on the list (alongside the CAN bus rewire and the left fuel-gauge float fix).

This is the story of that balance.

What dynamic propeller balancing actually is

Static balance — the kind you can do with the prop off the airplane on a balance stand — gets the prop to the point where it doesn’t have a preferred resting position. Dynamic balance is the next step: it deals with the residual imbalance that only shows up when the engine and prop are running at their actual operating RPM, with the actual installed combination of crank, flywheel, starter ring, spinner, and prop all spinning together as one mass.

The DynaVibe Classic balancer (RPX Technologies) does it with two sensors:

  • An accelerometer bolted to the top of the engine case, “as far forward as possible for maximum sensitivity… mounted vertically, perpendicular to piston travel.” The standard technique is to pull one of the case bolts along the top of the engine and reinstall it through the bracket that holds the accelerometer.
  • An optical pickup mounted on the same bracket, “approximately six inches behind the back of the propeller,” with its beam aimed at a small piece of reflective tape stuck to the back of the spinner backplate or starter ring. The optical pickup gives the balancer a once-per-revolution timing reference so it can tell the balancer not just the magnitude of the vibration but the angular location of the heavy spot.

(Quotes are from the DynaVibe Classic User Manual v1.09.)

With those two sensors hooked up, you start the engine and run it up to a steady cruise RPM — around 2,100 RPM in our case for the Lycoming IO-540. The balancer reads out two numbers: the vibration magnitude in inches per second (IPS), and the clock-angle of the heavy spot measured against the reflective-tape index. Then you stick trim weights opposite the heavy spot, run it again, see whether the magnitude dropped and where the new heavy spot ended up, and iterate.

The DynaVibe puts the result on a clear scale:
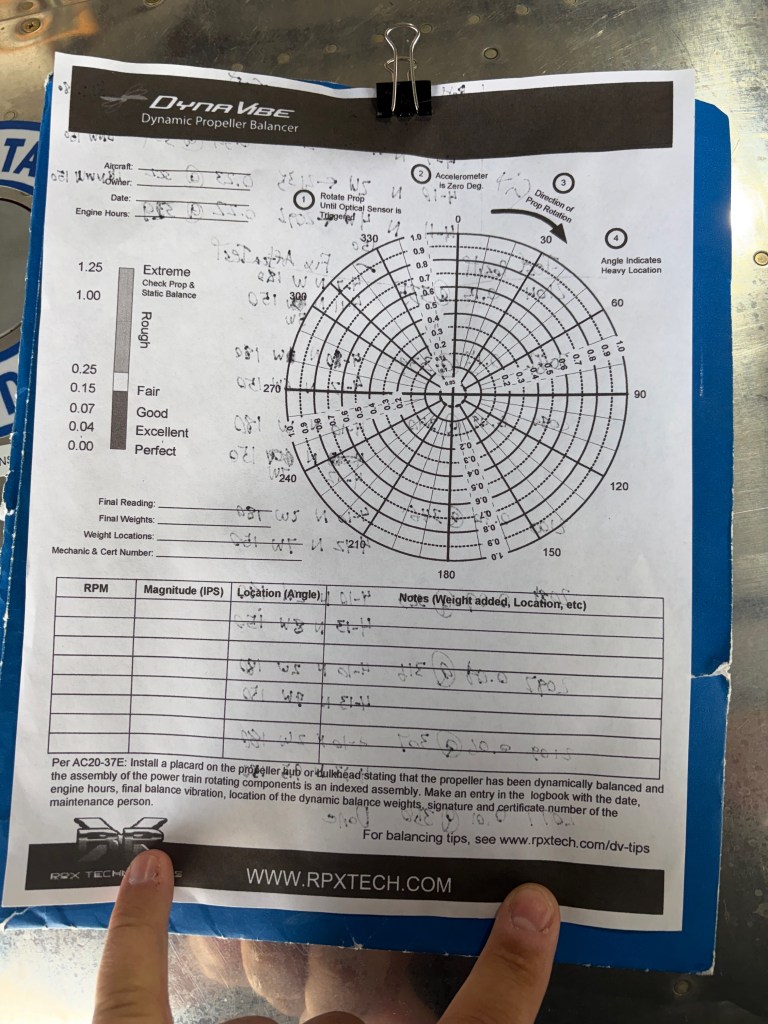
DynaVibe Dynamic Propeller Balancer form, showing the IPS magnitude scale: Extreme (≥1.25), Rough (0.25–1.00), Fair (0.15–0.25), Good (0.07–0.15), Excellent (0.04–0.07), Perfect (0.00–0.04). Polar chart for marking heavy-spot location.

The bands: Perfect under 0.04 IPS, Excellent through 0.07, Good through 0.15, Fair through 0.25, Rough all the way up to 1.00, Extreme above that. Anything in the Good band or better is acceptable for general aviation; Excellent or Perfect is the target if you have the time and patience to chase it.

Trim-weight construction

The trim weights on this airplane go on the starter ring gear, which has twelve bolt holes spaced every 30°. We assembled the weights out of standard hardware: AN4 bolts in various lengths, AN4 washers, and AN4 lock nuts. AN4 is a ¼”-diameter aircraft bolt; the dash number is the length in eighths of an inch — so an AN4-7 is ¼” × ⁷⁄₈” long, an AN4-10 is ¼” × 1¼”, an AN4-13 is ¼” × 1⅝”, and so on.

The catch: each bolt has limited thread engagement for the lock nut, so you can only stack about one or two washers on a given bolt before you have to step up to the next longer bolt size. Bumping the bolt up a length adds the equivalent of a washer or so of weight all on its own, which gives the balancing procedure a slightly quantized feel — you’re not adding weight continuously, you’re adding it in discrete steps of either a washer or a bolt-length-bump.

The session — twelve runs, eleven adjustments

Initial run, before any trim weights were added: 0.57 IPS at 345° at 2105 RPM. Solidly in the Rough band.

What follows is the entire in-hangar log:
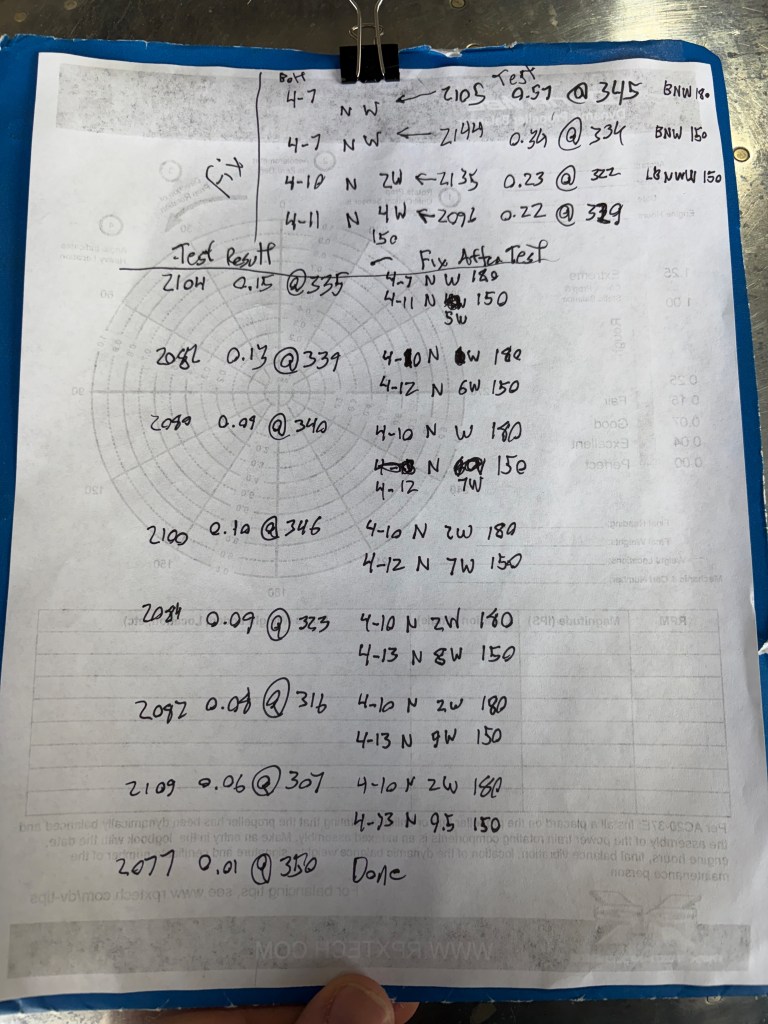
Handwritten iteration log from the prop balance session: starting at 0.57 IPS @ 345° and converging through twelve trim-weight adjustments to a final reading of 0.01 IPS at 350°.

Decoded as a table — each row is one measurement, the “Fix applied” column is what we added or changed between this run and the next, and the rightmost column is the running weight state the airplane was carrying when the next measurement was taken:

#RPMIPSHeavy spotFix applied for next runRunning weight state after fix
1 (bare prop)21050.57345°AN4-7 + nut + 1 washer at 180°180°: AN4-7 N+W
221440.34334°AN4-7 + nut + 1 washer at 150°180°: AN4-7 N+W · 150°: AN4-7 N+W
321350.23322°Upgrade 150° to AN4-10 + nut + 2 washers180°: AN4-7 N+W · 150°: AN4-10 N+2W
420960.22329°150°: AN4-10 → AN4-11; washers 2 → 4180°: AN4-7 N+W · 150°: AN4-11 N+4W
521040.15335°One more washer at 150° (bolt stays AN4-11)180°: AN4-7 N+W · 150°: AN4-11 N+5W
620820.13339°150°: AN4-11 → AN4-12; washers 5 → 6180°: AN4-7 N+W · 150°: AN4-12 N+6W
720800.09340°180° → AN4-10 N+W; 150° adds washer → AN4-12 N+7W180°: AN4-10 N+W · 150°: AN4-12 N+7W
821000.10346°Add washer at 180° → AN4-10 N+2W180°: AN4-10 N+2W · 150°: AN4-12 N+7W
920840.09323°150°: AN4-12 → AN4-13; washers 7 → 8180°: AN4-10 N+2W · 150°: AN4-13 N+8W
1020820.08316°One more washer at 150° → AN4-13 N+9W180°: AN4-10 N+2W · 150°: AN4-13 N+9W
1121090.06307°Add a thin (half) washer at 150° → AN4-13 N+9.5W180°: AN4-10 N+2W · 150°: AN4-13 N+9.5W
1220770.01350°Done — achieved 0.01 twice with DynaVibe averaging (the instrument floor)Final installed: 180°: AN4-10 N+2W · 150°: AN4-13 N+9.5W

A couple of things worth noting from the table:

  • The heavy-spot angle moved around the clock as the magnitude came down. It started at 345°, walked counterclockwise to 307° by step 11, then jumped to 350° on the final run. Once you’re in the Good / Excellent range, the angular position is increasingly noise-dominated — small changes in RPM, OAT, or run-to-run engine settling can shift the indicated heavy-spot by tens of degrees while the magnitude barely moves.
  • The step backward at #8 (0.09 → 0.10) is the classic instrument-floor signature. When you’re under ~0.1 IPS, the noise floor of the balancer is comparable to the imbalance you’re trying to chase, and small runs that look like regressions are usually just measurement scatter. We worked through it and kept converging.
  • The final two readings used the DynaVibe’s averaging mode — it takes multiple-revolution samples and reports a stable mean. We saw 0.01 twice in a row in that mode, which is essentially the floor of the instrument. Calling it done was an easy decision.

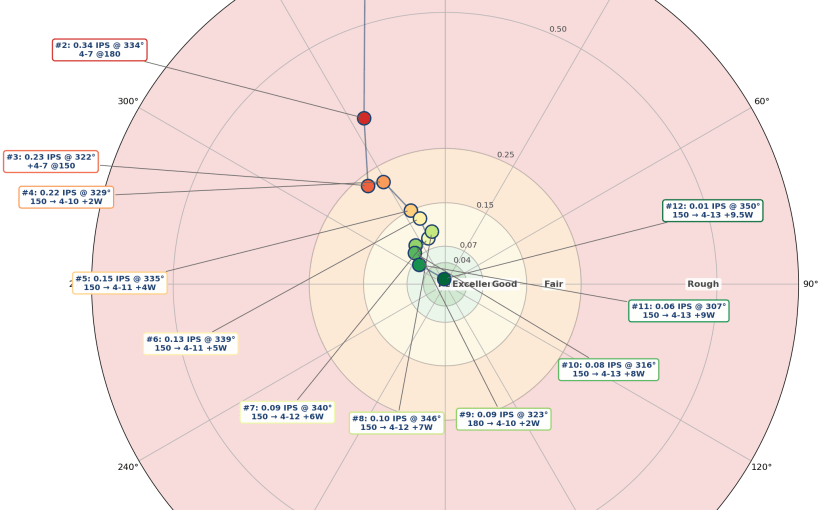
The convergence as a polar “bullseye” plot — each dot is one measurement, walking from the Rough band on the outer edge in toward Perfect at the center:
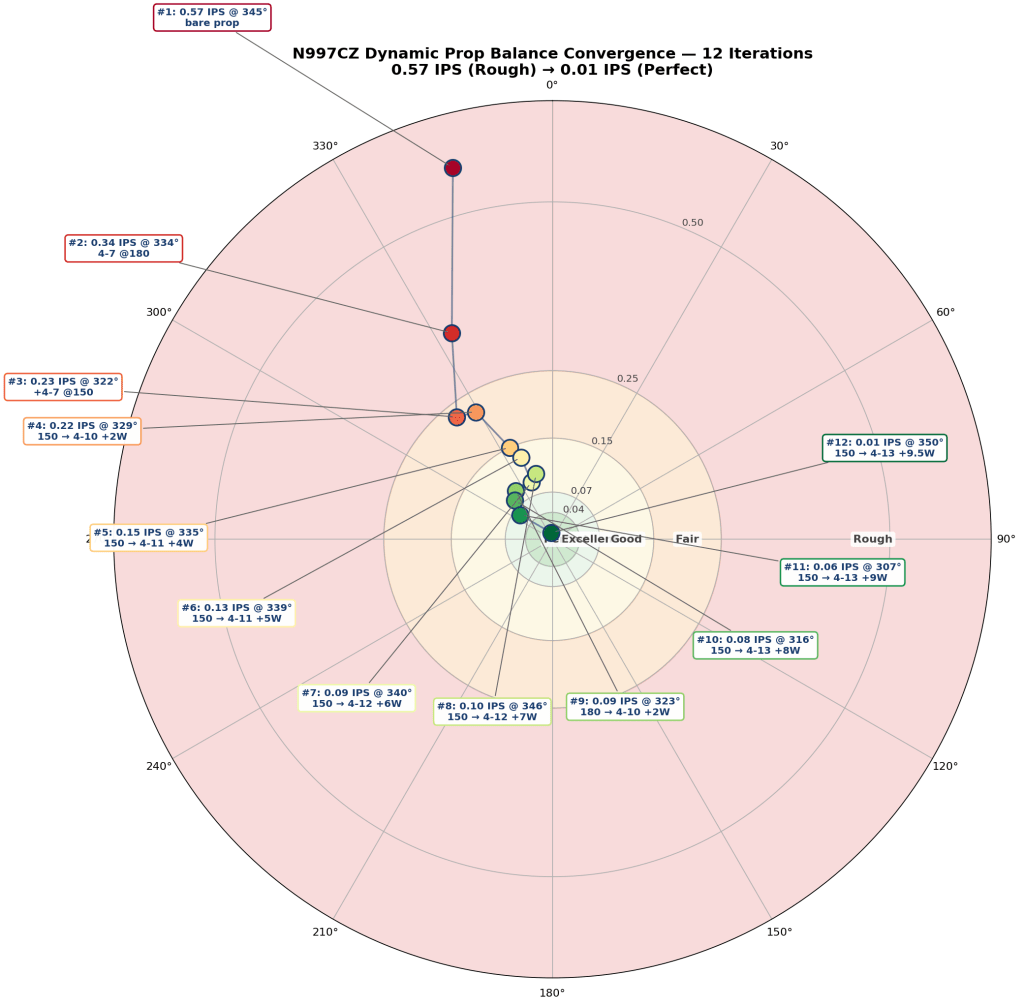
Polar convergence chart of the 12 balance measurements. Concentric bands show the DynaVibe IPS categories (Rough / Fair / Good / Excellent / Perfect). Dots are color-coded from red (first measurement, 0.57 IPS) through green (final, 0.01 IPS), connected by a path showing the order of measurements. Each dot is annotated with its measurement number, IPS value, heavy-spot angle, and the trim-weight configuration that was in place when that measurement was taken.

End to end the magnitude trended:

0.57 → 0.34 → 0.23 → 0.22 → 0.15 → 0.13 → 0.09 → 0.10 → 0.09 → 0.08 → 0.06 → 0.01 IPS.

Twelve runs, eleven trim-weight changes, the better part of an afternoon, and the airplane went from Rough to Perfect. A ~57× reduction in cruise vibration magnitude.

What it bought me in flight

The whole point of doing this was to clean up the ADAHRS environment. The G3X logs the ADAHRS percent-deviation on every flight for all three units — the two GSU 25C ADAHRSes on the sub-panel, and the G5 standby on the main panel — so the question was whether the flight-after-flight median deviation actually came down once the prop was smooth.

It did:
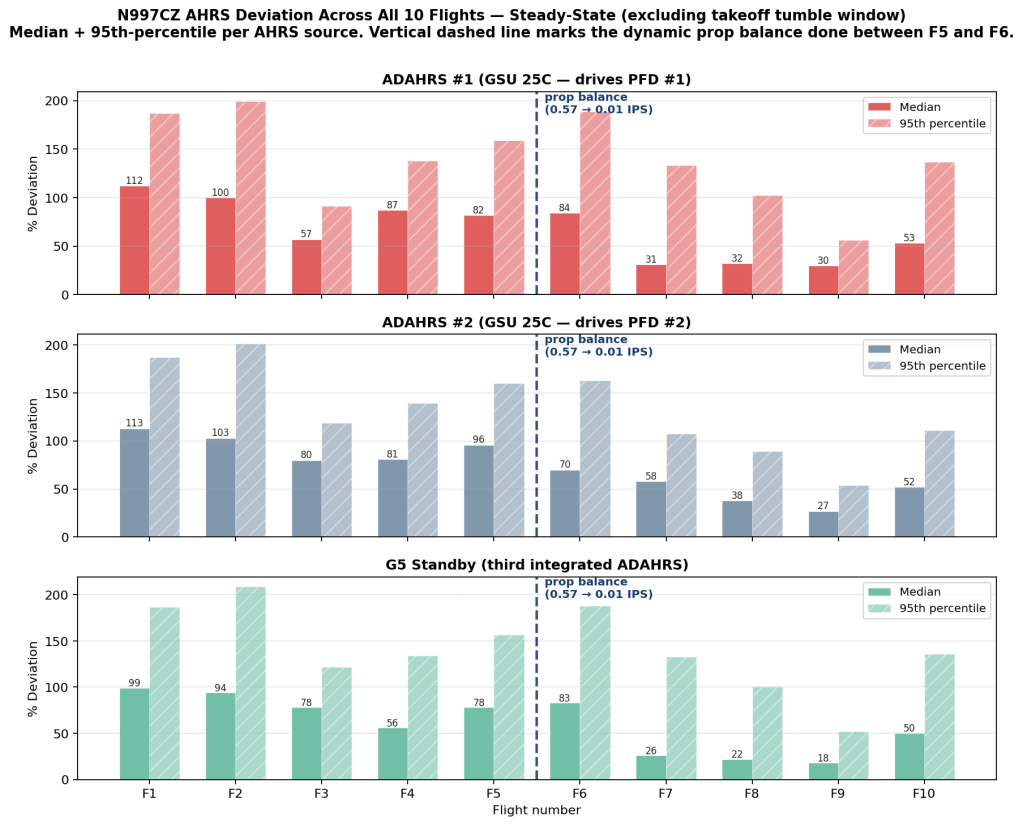
Bar chart of median and 95th-percentile ADAHRS deviation across all 10 N997CZ flights, for ADAHRS #1, ADAHRS #2, and the G5 standby. A vertical dashed line at F5.5 marks the dynamic prop balance. Pre-balance medians cluster at 80–115%; post-balance flights F7–F9 drop into the 18–58% range.

Each panel is one ADAHRS source: the two GSU 25Cs and the G5 standby. The dashed vertical line is where the prop balance happened — between Flight 5 and Flight 6. Median deviation values pre-balance hovered in the 80–115% band across all three units. The first post-balance flight (F6) was a short low-altitude shakedown and showed only modest improvement, but F7 through F9 — the first three flights at altitude after the balance — settled into the 18–58% band. Median deviation roughly halved on the GSU 25Cs and dropped by nearly 75% on the G5.

That last detail — that the G5 showed the biggest relative improvement — fits the geometry: the G5 lives on the main instrument panel, further aft from the firewall and the engine, with more structural compliance in the path between it and the source of the vibration. With the engine vibration that was reaching it now ~57× smaller, the residual deviation on that unit is dominated by other sources, and those sources are small.

What it didn’t fix

The thing dynamic prop balancing does NOT fix is the takeoff tumble — the PFD #1 attitude going upside down on the takeoff roll, every flight, 1–11 seconds after takeoff power application. That phenomenon was the original reason I started looking at ADAHRS data, and it has persisted unchanged through both the CAN bus rewire and the prop balance. Once two of the three leading environmental suspects (CAN noise, engine vibration) have been ruled out, what’s left is the GSU 25C hardware itself, and that’s now an open Garmin case against Service Bulletin SB 2144. (More on that in a future post.)

The takeaway

If you’ve got an experimental airplane with a fresh engine/prop install and you haven’t done a dynamic balance yet, it is — based on this single data point, take it with appropriate salt — worth the afternoon. The before/after on cabin feel is obvious, the before/after on ADAHRS deviation is measurable, and getting into the Excellent or Perfect band is achievable with patience and trim washers.

Twelve runs. Rough to Perfect.
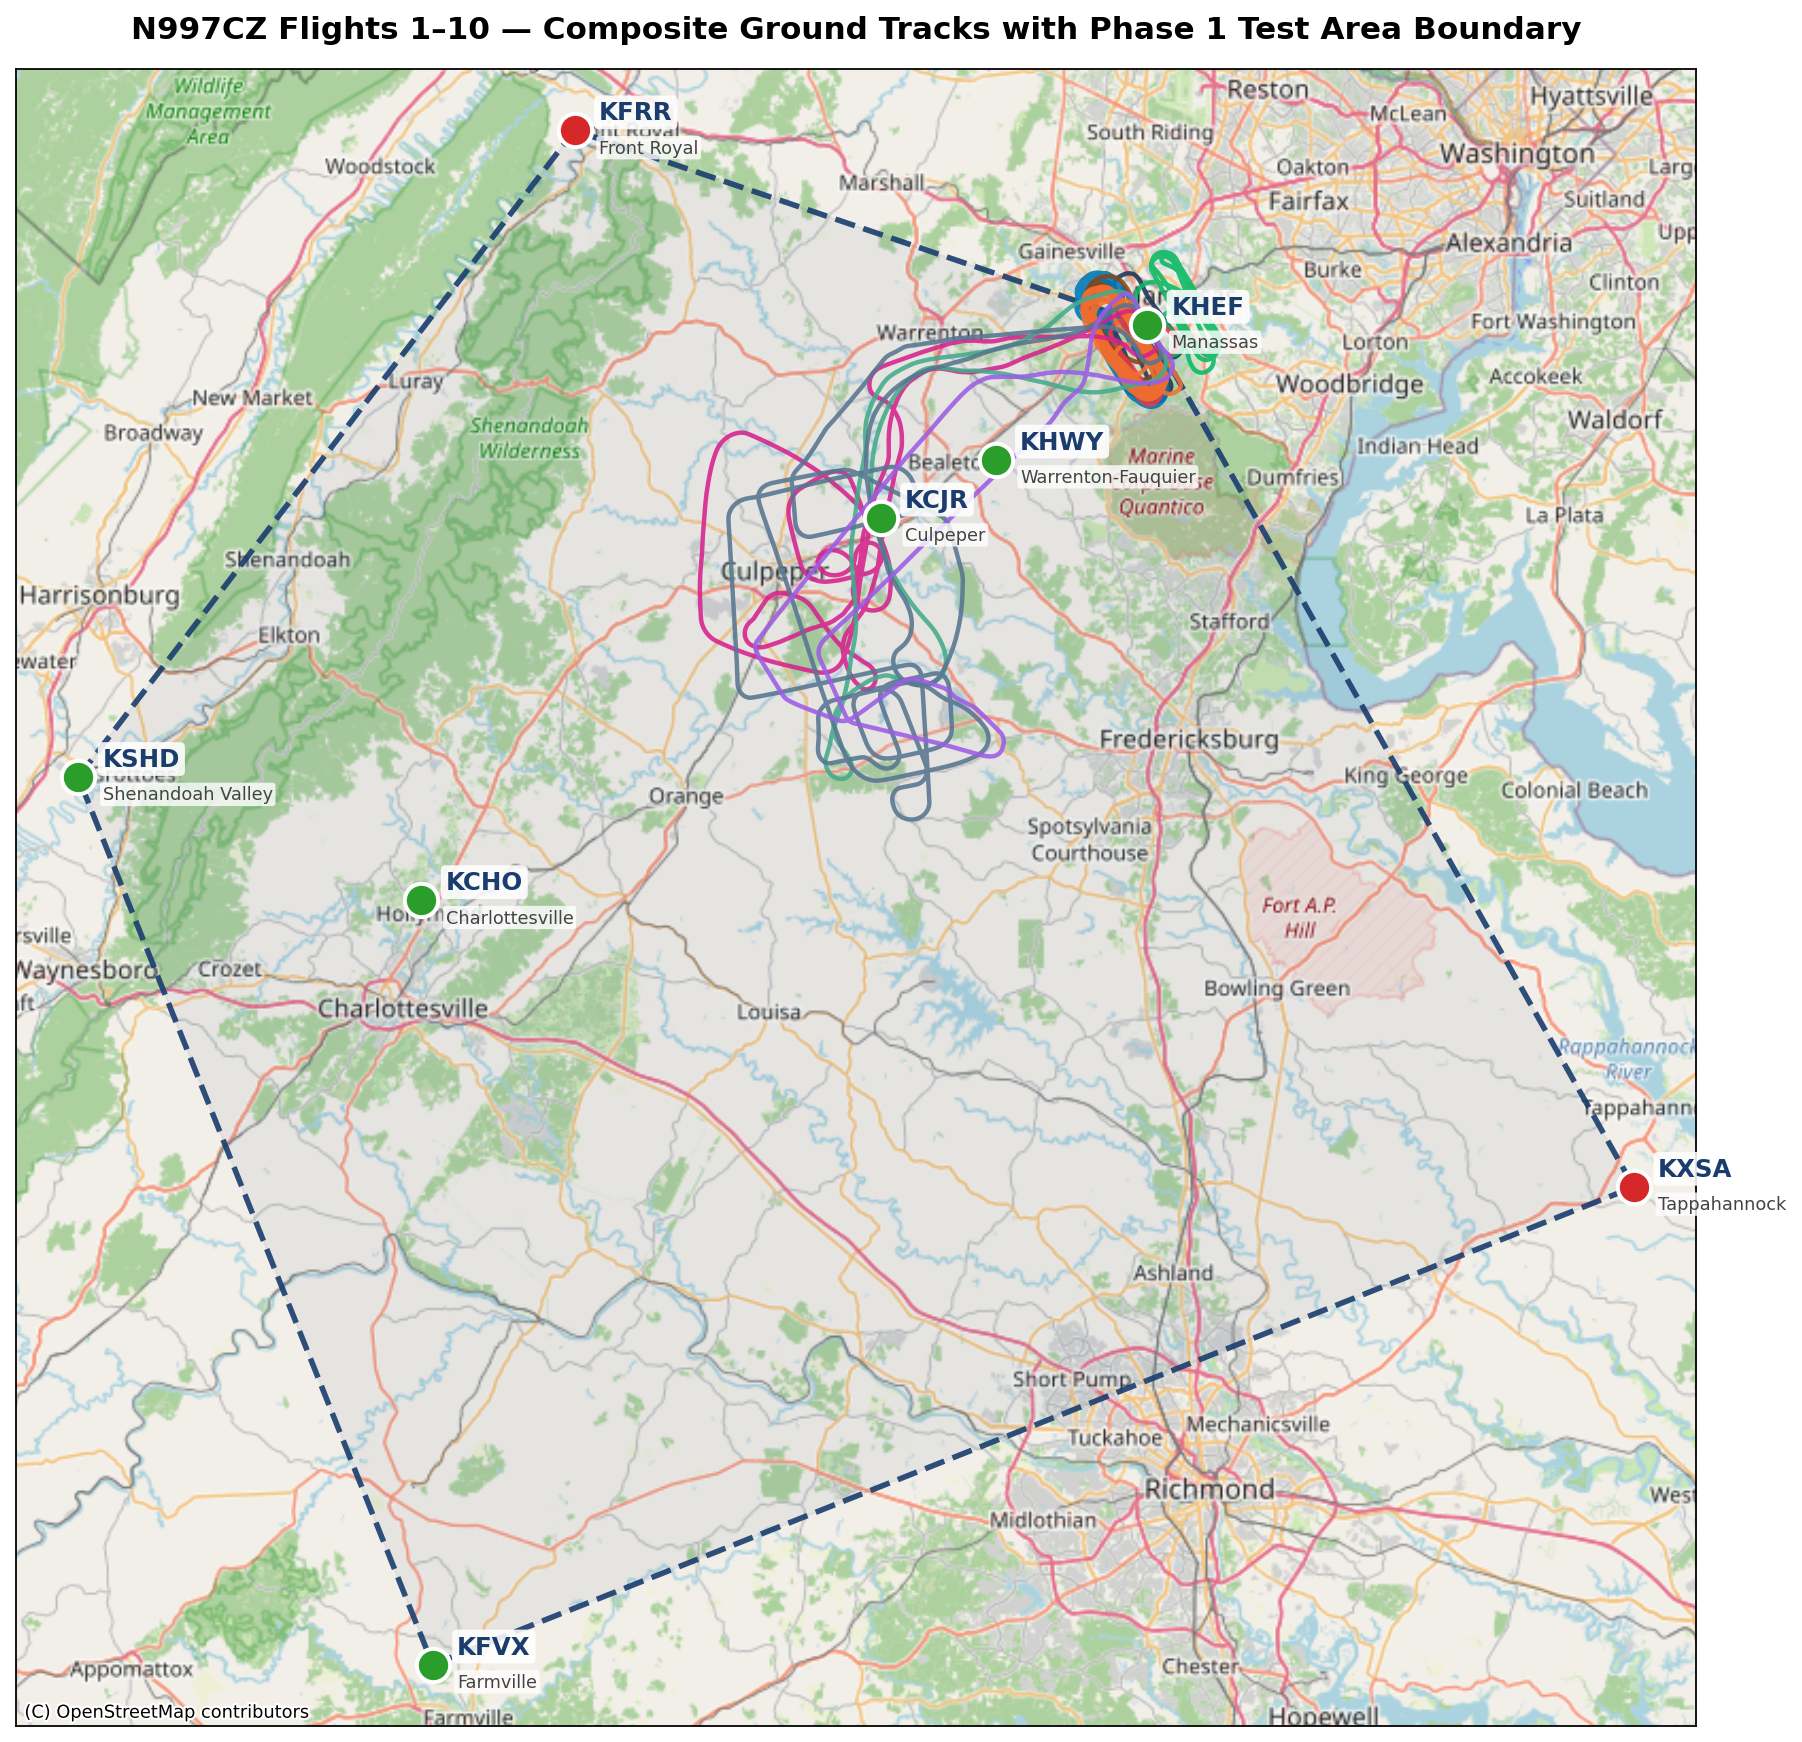
N997CZ — The Phase 1 Test Area: Five Boundary Corners, Six Landing Airports

Composite ground tracks for N997CZ Flights 1 through 10 with the Phase 1 test area pentagon overlay. Green dots are airports where N997CZ is approved to land; red dots are boundary corners where landing is not approved.
N997CZ Flights 1–10, color-coded, overlaid on the Phase 1 test-area pentagon. Green dots are airports where I’m approved to land; red dots are boundary corners where I am not.

Every experimental amateur-built airplane has to do its first few dozen hours of flying inside a defined geographic test area. That’s a Phase 1 requirement, written into the aircraft’s operating limitations and signed off by the FAA’s Designated Airworthiness Representative (DAR) when the airplane is issued its airworthiness certificate. You can fly anywhere you want inside the area; you can’t fly outside it until Phase 1 is complete.

I went into the conversation with my DAR with an ambitious proposal: twelve airports scattered across central Virginia, several of them anchoring the boundary of the test area and all of them on the approved landing list — places I could put the airplane down on a runway if anything went wrong. The DAR took a look and came back with a constraint from the FAA: the approved landing list had to be reduced to no more than six airports. Twelve was too many; six was the cap.

So we kept the boundary pentagon and pared the landing list down. Two of those concepts are now separate:

The boundary — the pentagon that encloses the test area — is defined by five waypoints:

  • KFRR — Front Royal-Warren County (NW corner)
  • KHEF — Manassas Regional (NE corner, my home base)
  • KXSA — Tappahannock-Essex County (SE corner)
  • KFVX — Farmville Regional (S corner)
  • KSHD — Shenandoah Valley Regional / Staunton (W corner)

The landing list — the six airports where I’m actually approved to put the airplane down — is six airports, three of which happen to also be on the boundary:

  • KHEF Manassas (boundary + landing)
  • KFVX Farmville (boundary + landing)
  • KSHD Shenandoah Valley (boundary + landing)
  • KHWY Warrenton-Fauquier (interior landing)
  • KCJR Culpeper Regional (interior landing)
  • KCHO Charlottesville-Albemarle (interior landing)

All six show up on the map as green dots. The remaining two boundary corners — KFRR (Front Royal) and KXSA (Tappahannock) — are red dots: they help define the shape of the test area, but I’m not approved to land there.

The constraint behind all of this came from a rule of thumb the DAR worked through with me: at the airplane’s cruise speed (~160 kt), I should be able to reach a runway within roughly a 30-minute leg. Thirty minutes at 160 knots is 80 nautical miles, and the six landing airports we kept are positioned so that no point inside the pentagon is more than that 80-nm window from one of them. That’s a reasonable margin while the engine is still breaking in.

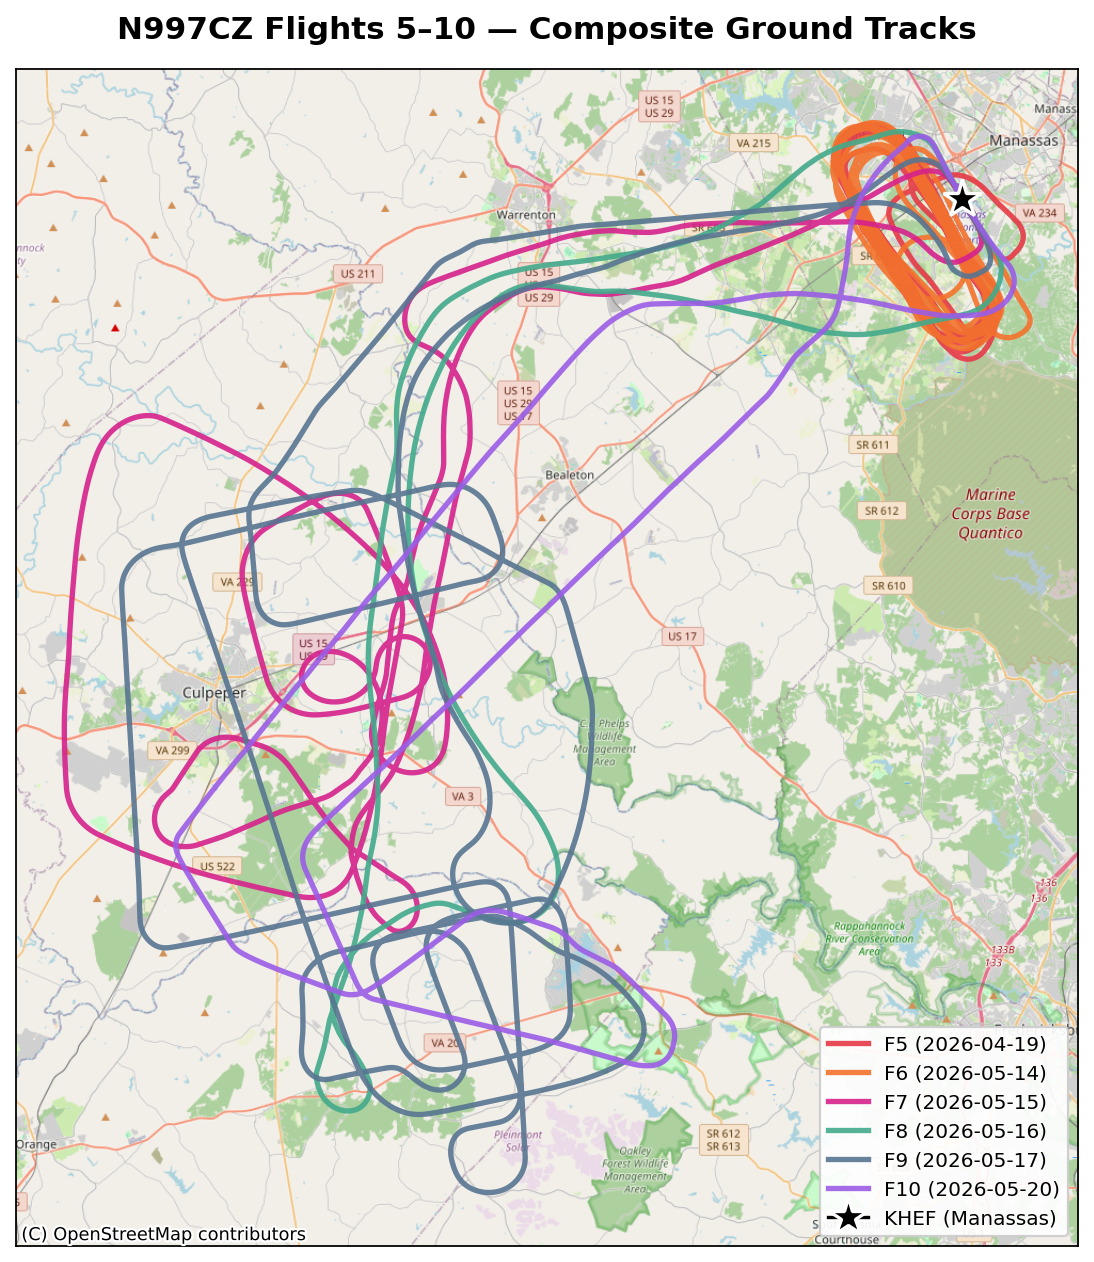
The map at the top of this post overlays all ten Phase 1 flights so far on that pentagon. You can see how much of it I’ve actually been using: the first six flights (F1–F6) stayed close to KHEF — local pattern work and the early shakedown profiles. Starting with F7 I pushed out toward the Casanova / Culpeper practice area in the western part of the pentagon, and F8 / F9 / F10 all worked roughly in the same neighborhood. Most of the pentagon’s southern reach is still unflown.

There’s a lot of test card left to fly inside this shape, and plenty of room to do it.

N997CZ — Flights 5 Through 10: A Catch-Up Post

Composite ground tracks for N997CZ Flights 5 through 10, color-coded by flight, on OpenStreetMap tiles
Composite ground tracks for N997CZ Flights 5 through 10 — KHEF marked with a star, each flight color-coded.

I owe the blog about six flights. Some of that is because I’ve been heads-down on the actual flying, some because every flight in this stretch turned up at least one new thing worth investigating, and some because the bigger investigations — the CAN bus rewire, the AHRS situation, the CHT data — kept demanding their own dedicated posts.

So rather than try to retroactively write six separate Flight N posts, here’s a single catch-up running from Flight 5 through Flight 10, hitting the headline from each. The dedicated deep-dive posts cover the analysis side; this is the chronology.


The Numbers

FltDateFlt hrsCyclesFuel (gal)Dist (nm)Total hrs
52026-04-191.4421.3155.36.0
62026-05-141.3519.1149.17.4
72026-05-151.7619.4169.38.9
82026-05-161.1712.096.69.8
92026-05-171.7823.3230.111.4
102026-05-201.0811.7104.212.4

Eight engine hours of additional flight time across six flights. About 900 nautical miles flown. ~107 gallons burned. From ~6 engine hours coming into this batch to ~12.4 out of it. Phase 1 on this airplane is a flight-test-card program, not a fixed-hours one — we work through the required test cards rather than counting down to a hard hours limit — but the experimental Lycoming IO-540 with the SDS electronic ignition would put a 40-hour floor on Phase 1 even if we were counting hours. So 12.4 engine hours is early in the program, not midway.


Flight 5 — April 19. The Last Flight of “Phase 1A.”

1.4 engine hours · 21.3 gal · 155 nm.

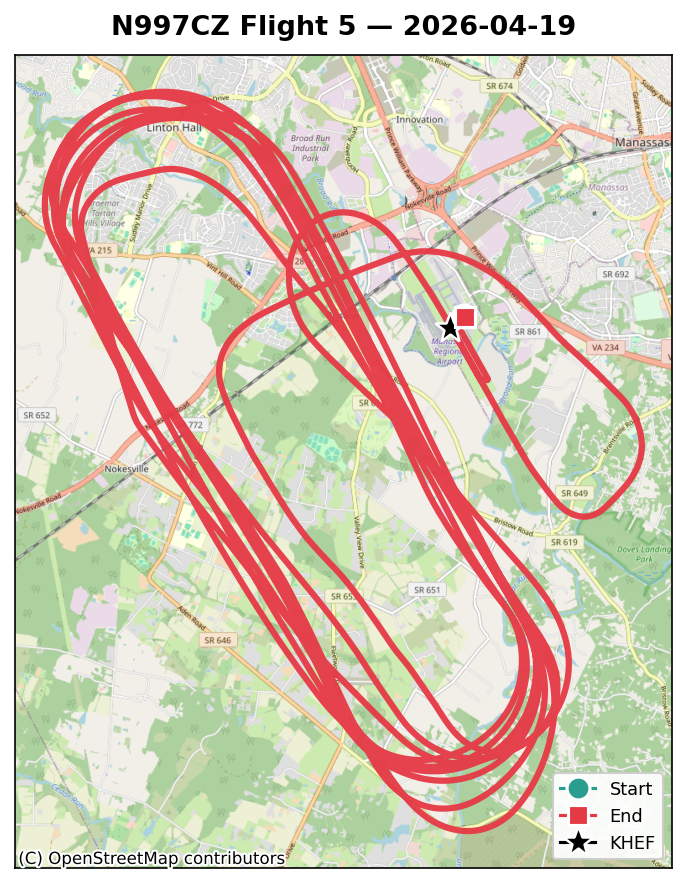
Ground track for Flight 5 — local pattern work near KHEF
Flight 5 — local pattern work near KHEF.

Flight 5 was a per-cylinder CHT survey at altitude — methodical, mostly uneventful, and the last flight in what I now think of as Phase 1A: the batch of early flights that locked in the questions we’d spend the next month answering. I used roughly 13 gallons out of the left tank and landed needing a top-up — a fine reminder that I needed to start trusting the totalizer more and the gauges less.

The other thing F5 made clear was that the ADAHRS deviation problem was real and reproducible, not a Flight 1 fluke. PFD #1 tumbled on the takeoff roll, percentage-deviation values were spiking high, and the pattern matched the four flights before it. Time to stop flying and start fixing.


The Maintenance Gap — April 19 to May 14

Twenty-five days on the ground for what turned out to be three separate jobs:

  • CAN bus rewire — completed May 13. The Garmin G3X harness was both over-length (~96.5 ft total vs Garmin’s 66 ft max) and built with the wrong wire (standard aircraft shielded twisted pair instead of 120 Ω spec cable). New harness: 57.7 ft of Carlisle IT CAN24TST120(CIT). Full writeup is here.
  • Dynamic prop balance — went from 0.57 IPS down to 0.01 IPS. That’s a ~57× reduction. The engine cowl is now noticeably calmer in the air.
  • Left fuel-gauge float reoriented — the left tank gauge had been reading frozen high since first fueling. Root cause turned out to be the float-arm wire positioning the float too close to the tank’s interior ribs / baffle, where it would get physically stuck. The 2025 Van’s plans update shows a different way to bend the float-arm wire that orients the float more laterally and gives it more clearance to move up and down. Implementing that new bend pattern appears to have fixed it — the left gauge now tracks correctly through the readable band. (Full write-up to follow in a future post.) The right-side gauge is still stuck up (same root cause suspected, same fix likely needed), still on the to-do list.

Three problems addressed, one bench-flight worth of confidence restored, and we were back at the runway.


Flight 6 — May 14. First Flight Back, and a Surprise.

1.3 engine hours · 19.1 gal · 149 nm.

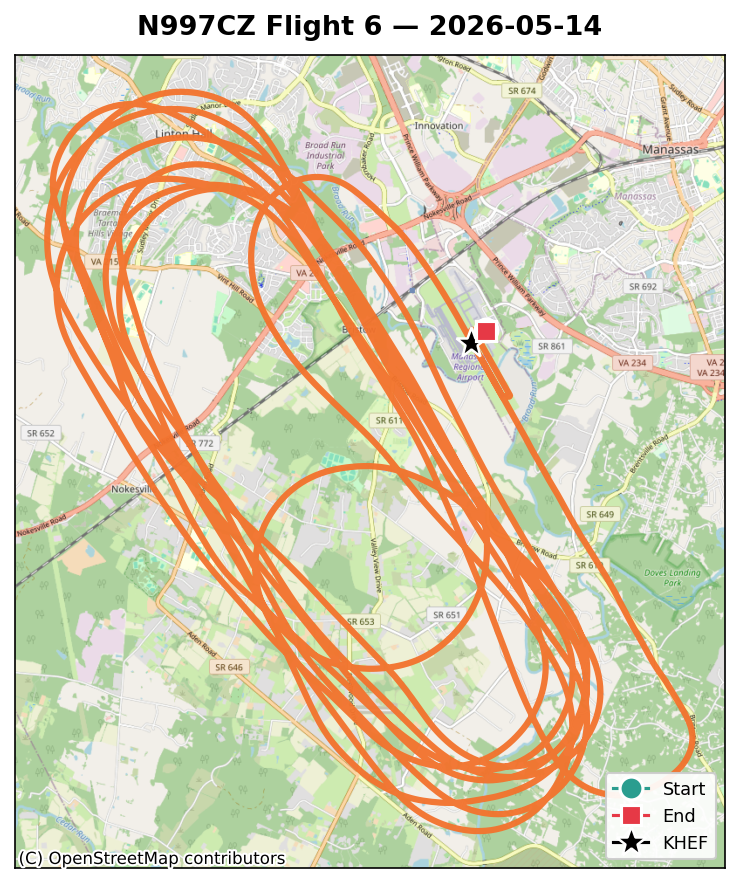
Ground track for Flight 6 — low, slow shakedown around KHEF after the CAN-bus rewire
Flight 6 — low, slow shakedown after the CAN-bus rewire.

F6 was deliberately a low, slow shakedown — peak ~2,070 ft, just enough to verify everything still worked after a month of wrenching. The CAN bus data was immediately, dramatically clean (zero protocol errors across the whole flight; pre-rewire flights had several hundred Bus-Off events apiece). That part was a win.

The surprise was carbon monoxide. The G3X CO Guardian had read essentially zero on every one of Flights 1 through 5. On Flight 6, with nothing changed about the engine, exhaust, or cabin sealing other than the avionics rewire, cabin CO peaked at about 7 ppm. Not alarming in absolute terms — the working alarm threshold is around 35 ppm — but a new signature that hadn’t been there before. The leading suspect, which I’ll come back to in a future post, is the firewall heat doors not seating fully closed.

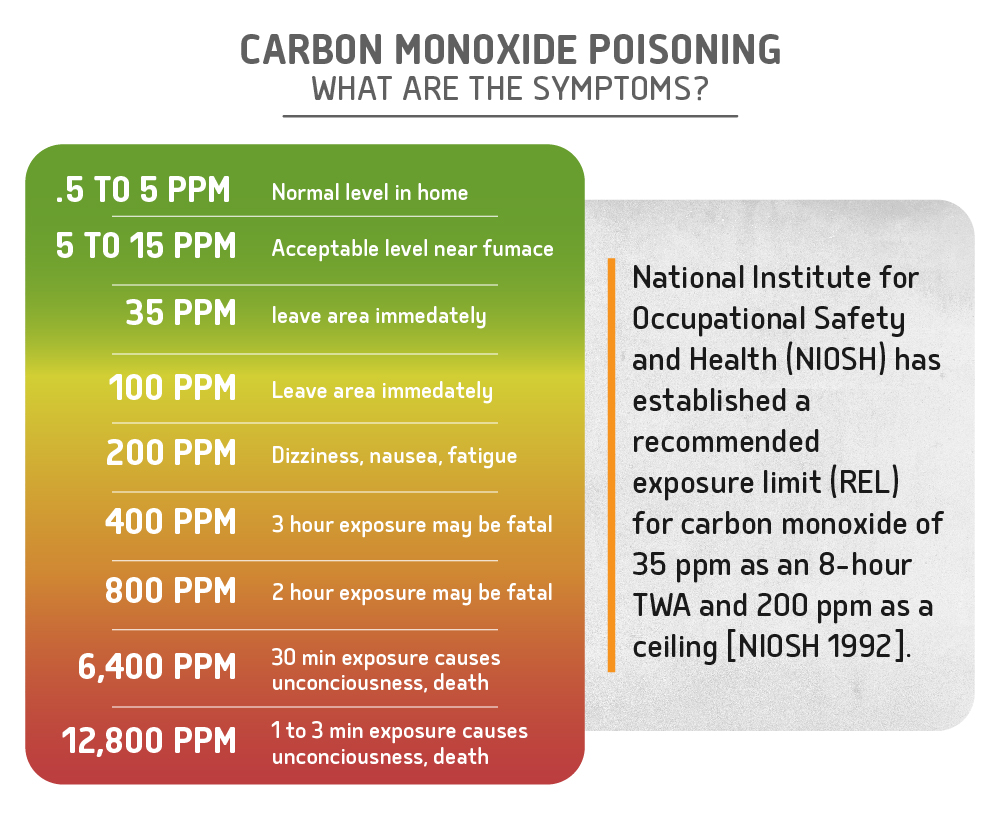
For context on what those PPM numbers mean as the values climb on later flights, here’s the standard CO exposure scale:

Carbon monoxide symptoms by PPM level — NIOSH-based exposure thresholds
CO symptoms by PPM level (image courtesy TFT Pneumatic).

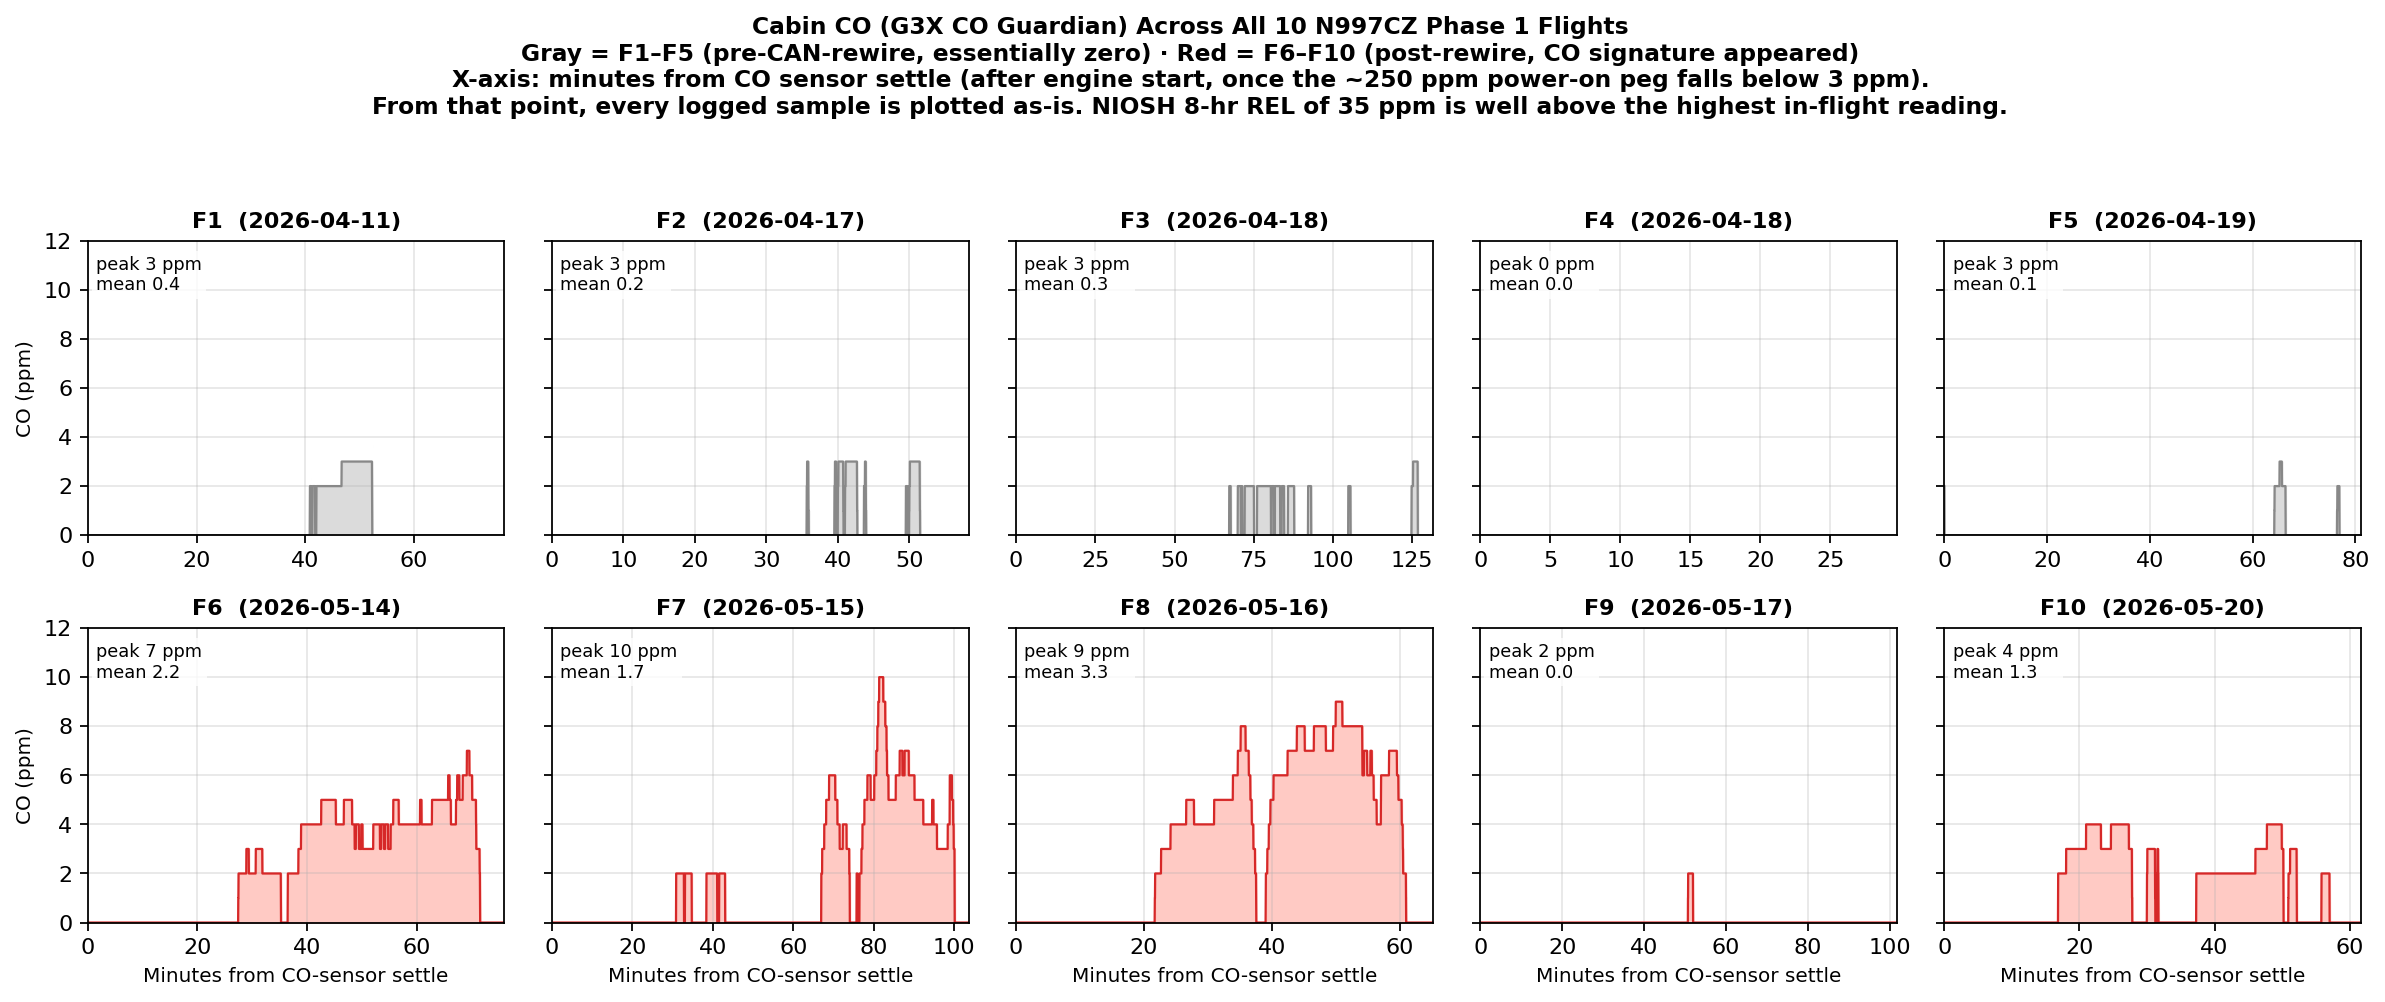
And here’s what the G3X CO Guardian actually measured in the cabin across all ten flights:

Cabin CO across all 10 N997CZ Phase 1 flights — F1–F5 essentially zero (gray), F6–F10 showing the new CO signature (red). NIOSH 35 ppm REL is well above any reading shown.
Cabin CO across all 10 N997CZ flights. Gray = F1–F5 (pre-CAN-rewire, essentially zero). Red = F6–F10 (post-rewire, CO signature appeared). NIOSH 35 ppm REL is well above any reading shown.

The story the chart tells: nothing on F1 through F5 (a few 1–3 ppm blips, mean below 0.5), then a clear new pattern starting at F6, peaking at 10 ppm on F7 during the slow-flight stalls and at 9 ppm on F8 with the wing roots taped. F9 looks essentially clean — but it was a benign autopilot-tuning profile. F10 is back to small numbers under a short, more aggressive profile.


Flight 7 — May 15. Out of the Pattern. First Stalls. First Airspeed Cal.

1.7 engine hours · 19.4 gal · 169 nm.

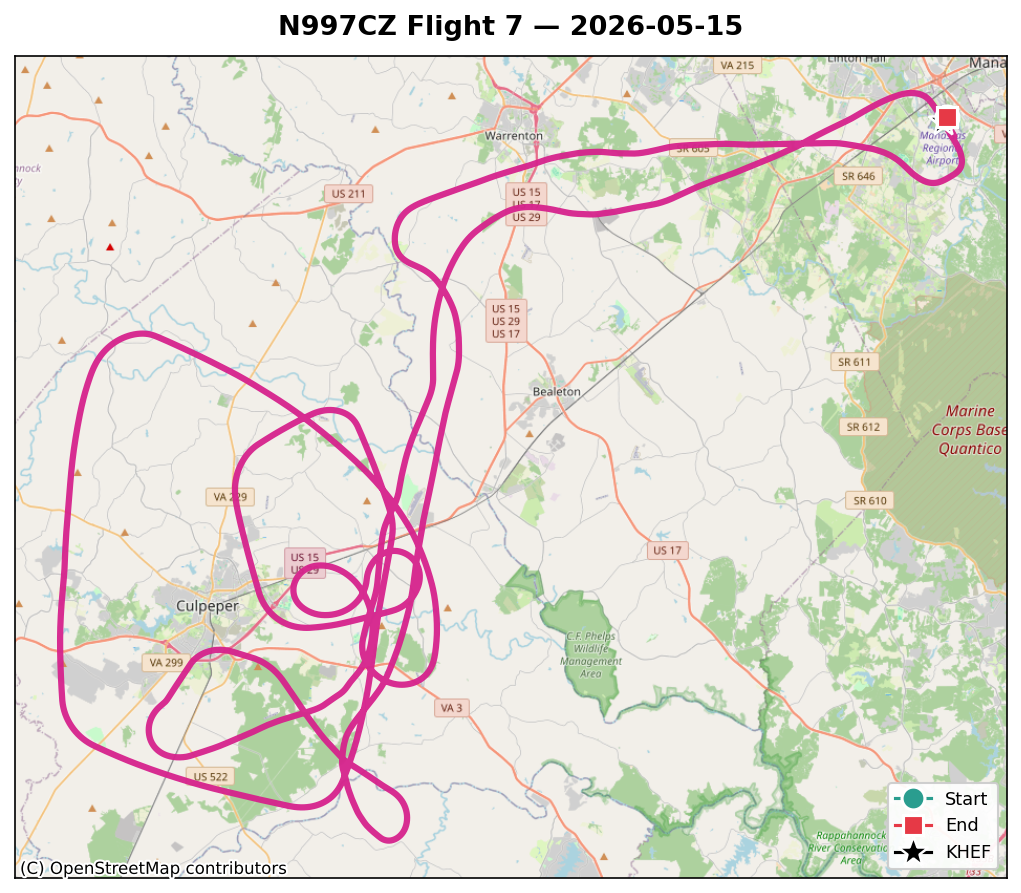
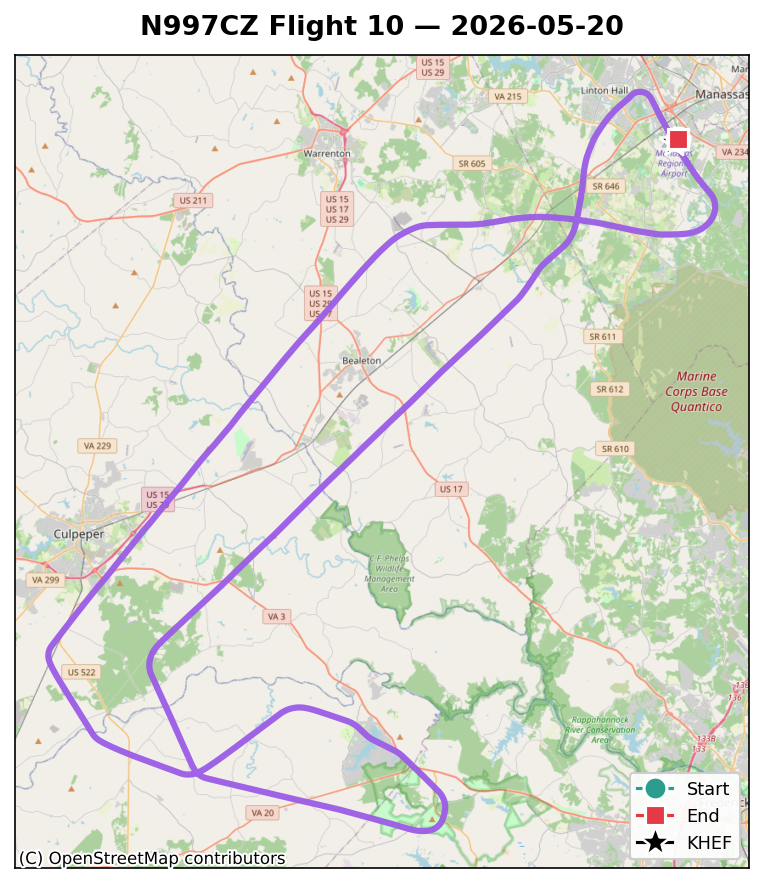
Ground track for Flight 7 — first push west toward Casanova / Culpeper for the stall series
Flight 7 — first push west toward the Casanova / Culpeper practice area.

Flight 7 was the first time I really left the immediate KHEF area. Climbed to about 8,800 ft west of the field and ran a clean-configuration stall series at light forward CG: about 1 kt per second deceleration, minimum airspeed ~58 KIAS before heavy buffet, no clean nose break yet. Wing roots were still bare (the wing-root grommet seal had been a contender for the CO source at this point) and cabin CO peaked at 10 ppm during the slow-flight portion of the flight — confirming that whatever was leaking was somehow correlated with high angle of attack or low airspeed, not just temperature.

Flight 7 also gave me a clean airspeed-calibration dataset I hadn’t planned on. Over about 22 minutes at ~7,000 ft and ~148 KIAS, I’d flown a mix of straightish legs and curving legs while working other test cards — not a single deliberate 360° turn, just a happy combination of headings that, taken together, ended up giving the GPS ground-speed vector enough azimuth coverage to support the GPS circle method. With 1,336 samples spread across the full compass and a circle-fit RMS of 2.4 kt, the result said the pitot-static system is essentially clean in cruise — position error +0.9 kt at ~148 KIAS. One cal point in the books; more to come at other airspeeds.


Flight 8 — May 16. Aggressive Stalls, and the Autopilot Wants to Dive.

1.1 engine hours · 12.0 gal · 97 nm.

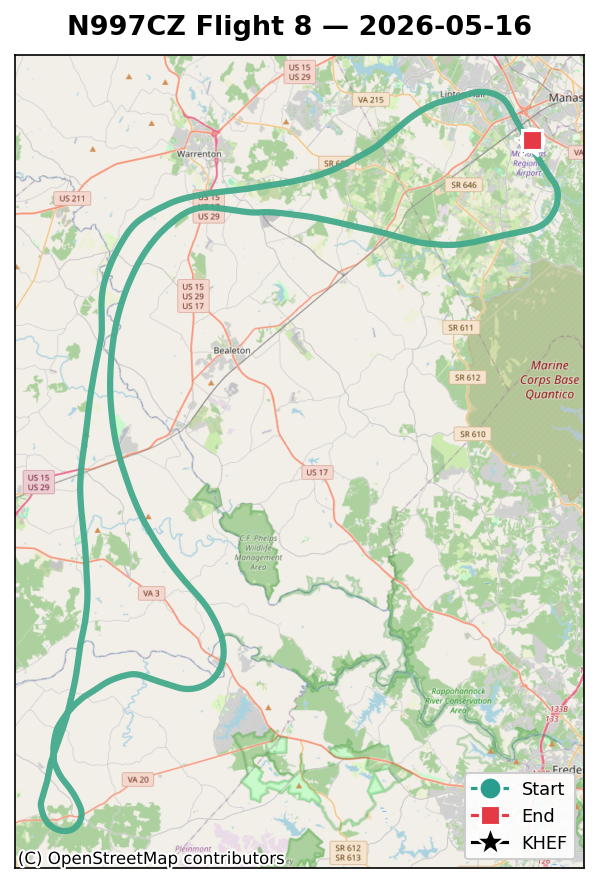
Ground track for Flight 8 — back to the practice area for deeper stalls and the first AP engagement
Flight 8 — back to the practice area for deeper stalls and the first autopilot engagement.

I went back up to ~8,500 ft on F8 with more aggressive intentions: deeper stalls, more flap deployment, slower minimum airspeeds. Minimum logged IAS was 45.9 kt at about 7,900 ft, which is well into the “we’re not in the certified envelope anymore” territory and exactly what Phase 1 is for. Wing roots were taped on this flight to test the wing-root-as-CO-source theory.

Cabin CO peaked at 9 ppm anyway — actually with the highest mean CO reading of any flight to date. Wing roots, ruled out. The leading edge of the diagnosis shifted to the firewall heat doors. (More to come in a dedicated CO post; the investigation is still active.)

And then there was the autopilot. First time I engaged the AP in this airplane, it commanded a nose dive. Pitch channel sense was reversed — the AP was simply trying to hold pitch level, but with the servo direction wired backwards every correction it made was the wrong one, so it just kept pushing the nose over into a dive. We disengaged immediately, hand-flew the rest of the flight, and changed the G3X pitch servo direction from “normal” to “reversed” on the ground after landing. Configuration error, not a hardware failure, but a useful reminder of why we test these things at altitude before relying on them.


Flight 9 — May 17. Autopilot Tuning. And a Visit From an Old Friend.

1.7 engine hours · 23.3 gal · 230 nm.

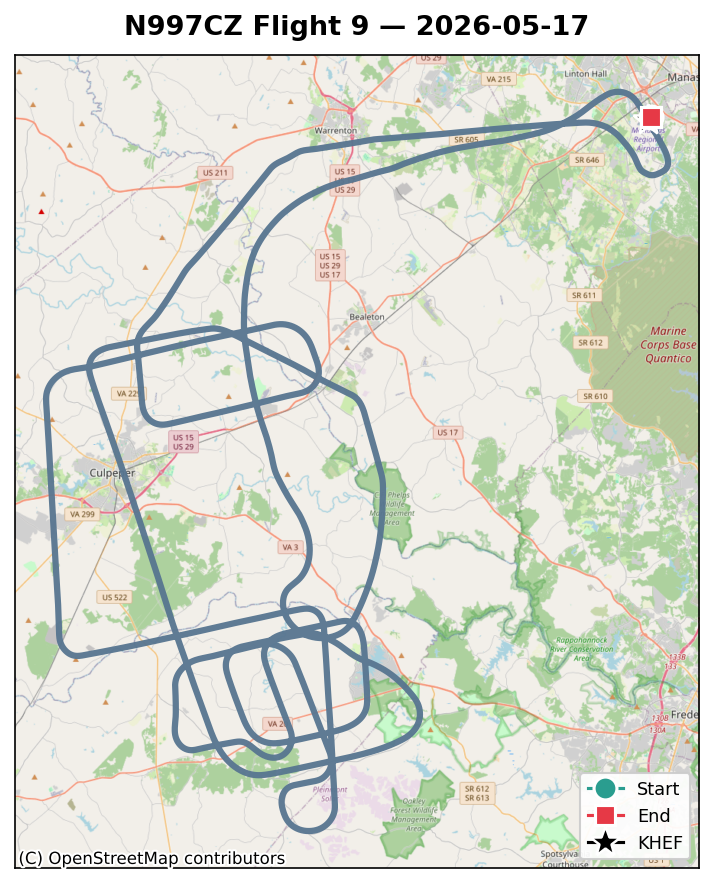
Ground track for Flight 9 — autopilot tuning west of Casanova / Culpeper, with the Harry T and Bob H air-to-air rendezvous
Flight 9 — autopilot tuning west of Casanova / Culpeper. Includes the air-to-air rendezvous.

F9 was an autopilot tuning flight: 1.7 hours, max GPS altitude ~9,100 ft, mostly hand-flown to get up to altitude and then about 60% of the cruise samples on the autopilot. Confirmed the pitch-reversal fix from F8 — the AP now correctly climbs when it wants to climb. Worked the roll gain from 0.5 up to 0.7 and back to a settled 0.6, with the roll servo max torque bumped from 15% to about 40%. Roll axis is now tracking well; pitch tuning is up next.

The fun part of F9 was the air-to-air. Harry T and Bob H (Bob’s Cessna N8EM, “8 Echo Mike”) took off about 15 minutes behind me and joined up in the practice area west of Casanova / Culpeper. I worked at about 8,500 ft, they worked at about 3,000 ft, and we relayed live updates on the AP tuning progress on the air-to-air “fingers” frequency, 123.45 MHz. Visual contact. First time flying N997CZ alongside Bob’s airplane. The kind of flight where the data takes a backseat to the smile.

Two data-related notes from F9: cabin CO was essentially zero for the whole flight (the profile was too benign for the AoA-correlated leak signature to express itself, but worth logging). And the 11 autopilot-stabilized wings-level legs at ~8,500 ft / ~145 KIAS that came out of the tuning work happened to produce a perfect second airspeed-calibration data point: position error +0.5 kt, matching the F7 GPS-circle result almost exactly. Two cal points, two methods, two days apart — the pitot-static system is clean in cruise.

Full airspeed-calibration writeup — methodology (constant-IAS GPS circle, multi-leg wind triangle), per-leg data tables, and the F7/F9 cross-validation — is available as a PDF download below.

F9 was also the first confirmed mid-flight tank switch. Post-flight refueling receipt was 22.1 gal vs totalizer 23.3 gal (1.2 gal / 5% — within fuel-flow calibration tolerance), with the right tank taking about 8–9 gallons. Working tank split for this flight: ~13.5 L / ~8.5 R.


Flight 10 — May 20. The First Configuration Change.

1.0 engine hours · 11.7 gal · 104 nm.

Ground track for Flight 10 — air-dam-removal test, max GPS altitude ~11,080 ft
Flight 10 — air-dam-removal test. Max GPS altitude ~11,080 ft, a new high for N997CZ.

F10 was the first deliberate configuration change to the airframe since the maintenance gap. The Cyl 1 front air dam was removed before the flight to see whether more cooling air would lower Cyl 1’s persistently-hottest CHTs (and at what cost to the cylinders downstream of it). About an hour of engine time, max GPS altitude ~11,080 ft (a new high for this airplane), warm day with cruise OAT around 71 °F.

I’ll be honest: I didn’t check the weather before this one. It was a beautiful blue-sky day with a few white puffballs of fair-weather cumulus, and I was preoccupied with the air-dam mod. Departing Manassas to the west I could see some thunderstorm activity well to the north — at the time it looked like it was on the far side of Dulles, possibly out near Leesburg, and based on that I felt comfortable climbing west and away from it to do the test profile.

Up at 10,000–11,000 ft and turned around looking back east, the situation had changed. The storm had organized and was starting to encroach on Dulles and the corridor between Dulles and Manassas. Decision time was easy: hightail it home. I came back to Manassas and they had me land from the north to the south with the thunderstorm just behind my tail. Wheels down, taxi clear, into the chocks, shut down, debrief in the cockpit — all of that with the sky behind me turning increasingly serious.

Maybe one or two minutes after engine shutdown I opened the cabin door. The gust front hit exactly then. It took everything Harry and I had between us to keep the cabin door from being ripped off the hinges by the wind, and then it took everything we had to push the airplane back into the hangar against the gusts. The RV-7’s tow bar lives in the other hangar; we made it work, but N997CZ needs its own tow bar. Added to the parts list.

Headline result of the actual test, OAT-adjusted, F9 → F10: Cyl 1 max CHT dropped 33 °F. About 23 °F of that drop is attributable to the air-dam change beyond the cooling the other cylinders got on the same flight. Strong, clean signal. The downside, also predicted: Cyl 5 max went UP +9 °F — that’s the rear cylinder on the right bank, downstream of the redirected airflow. It’s a “canary” reading on whether the air dam was protecting Cyl 5’s climb cooling. F11 will tell us whether F10 was noise on a small sample, or whether we need a partial air dam to keep Cyl 5 happy.

Full CHT trend analysis across all 10 flights is its own dedicated post (the short version: the cylinder ranking has held invariant across all 10 flights, real break-in is visible in the climb maxes but essentially absent in cruise, and I was leaning too early per Lycoming’s SI 1427C).


Where We Are Now

12.4 engine hours in, with plenty of Phase 1 test cards still to fly. The headline open items going into F11 and beyond:

  • AHRS still tumbling on the takeoff roll every flight. CAN bus is clean, vibration is essentially eliminated (0.01 IPS), so the GSU 25C hardware itself is the leading suspect. I’ve just sent Garmin a fresh writeup closing the loop on the CAN bus rewire result and the prop balance result, alongside a 10-flight analysis showing the AHRS tumble pattern is identical before and after both fixes — and asked them once again about Service Bulletin SB 2144 and the potential need to swap or recall the two GSU 25C units on N997CZ. Waiting to hear back.
  • Cabin CO investigation continues. Firewall heat doors are the leading hypothesis; tape-test still to fly.
  • Cyl 5 climb cooling — F11 will tell us whether the air-dam removal was a free win or whether we owe Cyl 5 a partial fix.
  • Airspeed calibration at slow-flight speeds (~80, 100, 120 KIAS) — only the cruise point has been mapped so far.
  • Right fuel-tank float still stuck up. To-do.
  • Pitch autopilot tuning — roll is settled; pitch gains are next.
  • Flight 5 dedicated post — never going to happen at this point; consider this paragraph the substitute.

Next post will probably be the CO investigation, depending on which one closes out first. As always, thanks for following along.

— Jim

N997CZ — 10 Flights of CHT Data, and How I Was Wrong About Break-In

If you’ve been following the N997CZ journal, you’ll know that cylinder-head temperatures have been on my mind since the very first takeoff. Flight 1’s Cyl 1 peaked over 450°F before I’d even cleared the pattern, and from that moment on, every flight has carried with it a small cardiac event for me when I look down at the engine page on the G3X.

After ten flights and about 13 engine hours, I’ve finally pulled all of that CHT data into one place, run some regressions across it, and learned that a lot of what I thought I was seeing wasn’t quite right. This is the story of what the data actually shows — and where my initial interpretation broke down once I added one more variable.


Why CHTs Matter on a New Engine

For anyone new to all of this: cylinder-head temperature is the temperature of the metal at the top of each combustion cylinder, measured by a thermocouple right at the spark plug boss. Lycoming’s redline on the IO-540 is 500°F. The general guidance for break-in is to keep CHTs comfortably under 420°F during cruise and well clear of redline during climb, but more importantly to let the engine work: high power, full-rich mixture, no babying. The piston rings are seating against the cylinder walls during these first 25 to 50 hours, and that process needs combustion pressure and heat to happen properly.

The trade-off is that you’re running an engine hot, and you’re learning its baffling system, its idiosyncrasies, with no historical data to compare against. So you watch. And you write down what you see. And, in my case, you eventually pull it all into Python and start asking questions.


The Method: One Regression Per Cylinder, OAT Normalized

CHTs depend strongly on outside air temperature. A 70°F day produces materially hotter cylinders than a 40°F day, all else equal, just because the cooling air arriving at the baffles is hotter. So before I could see a meaningful “break-in” trend across ten flights spread over five weeks of spring weather, I needed to normalize for OAT.

I pulled the cruise window from each flight’s G3X log (filtered to RPM ≥ 2400 and altitude relatively steady), grabbed the OAT (°F) and the per-cylinder CHTs (°F), and fit a simple two-term regression for each cylinder:

CHT_cruise = a + b · OAT + c · flight_number

b tells me the OAT sensitivity (°F of CHT per °F of OAT — engineering rule of thumb is around 1.0). c is the break-in slope: how fast that cylinder is cooling off as the engine accumulates hours, after controlling for OAT.

I also kept the raw max CHTs flight-by-flight (peak during the climb), since climb is where the cooling system runs nearest its capacity and where any improvement in heat transfer would show up most clearly.


What I Thought I Was Seeing

The first fit was across all ten flights, F1 through F10. The numbers looked beautiful:

  • Cyl 1: c = −2.75 °F/flight. Hottest cylinder. Cooling fastest.
  • Cyl 2: c = −1.52 °F/flight.
  • Cyl 4: c = −1.31 °F/flight.
  • Cyl 6: c = −1.33 °F/flight.

That fits the classic break-in story so well. The hottest cylinder breaking in fastest. Rings seating. The cruise temps trending down at a measurable rate. I wrote it up, called the family in to admire the regression coefficients, and started drafting a post about how my engine was breaking in nicely.

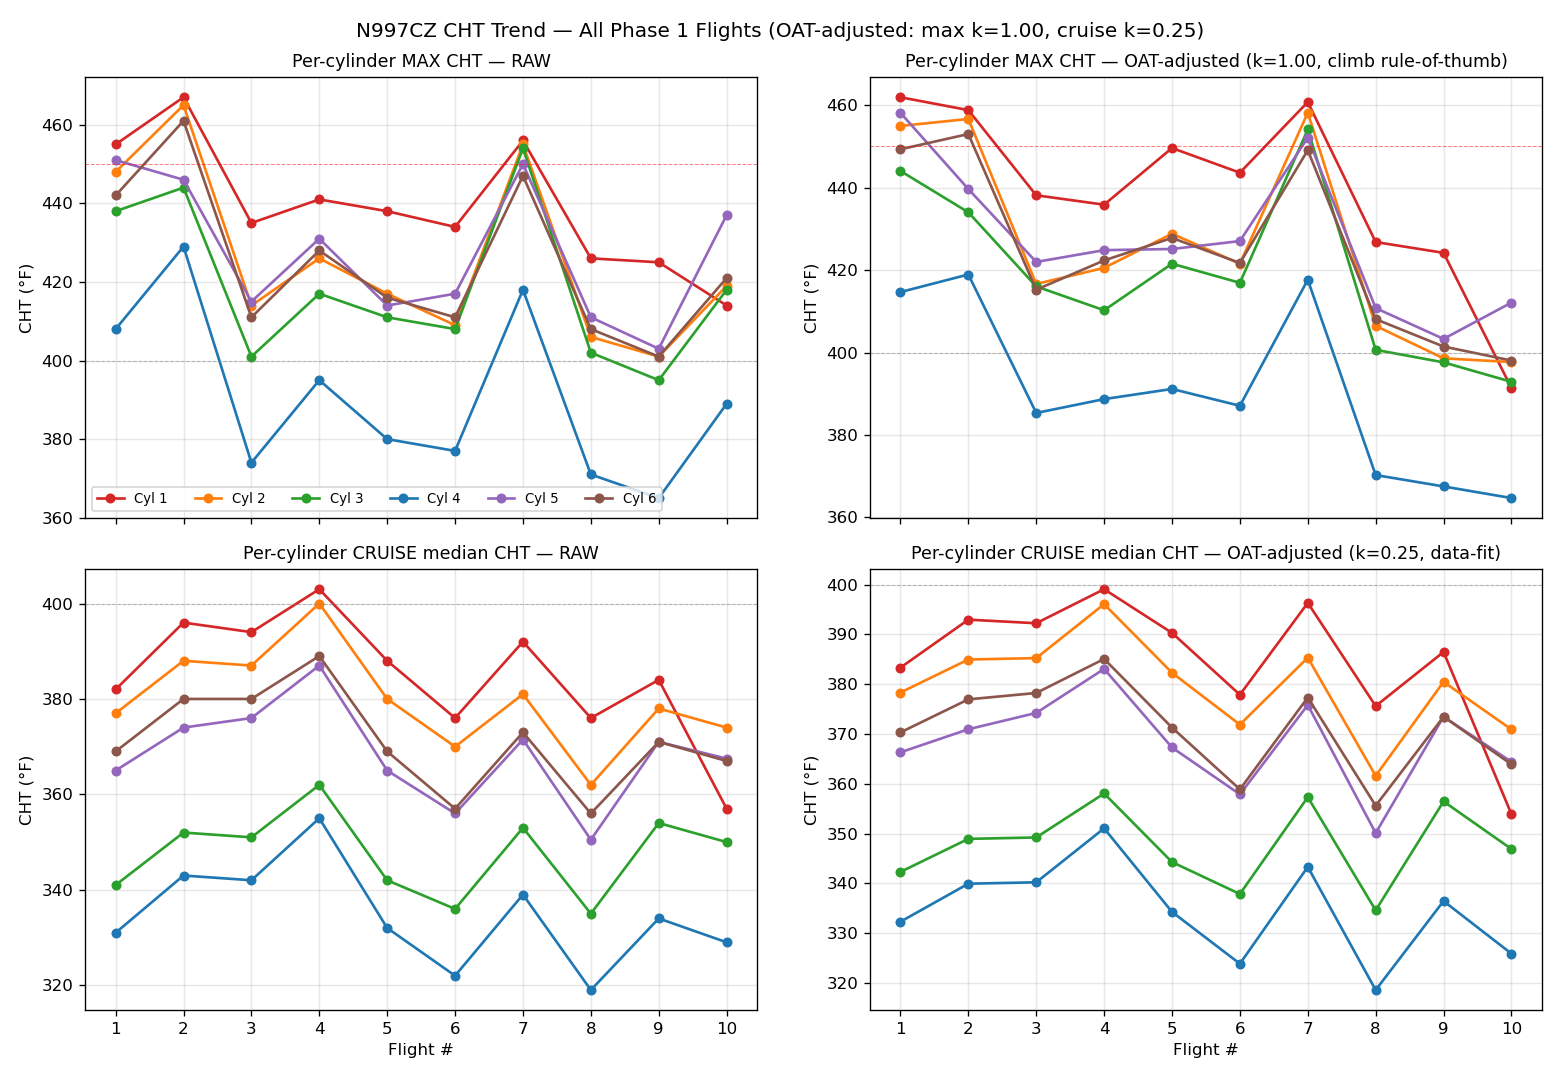
CHT trend chart — OAT-normalized cruise CHT across all 10 flights, per cylinder
CHT trend across all 10 flights, OAT-normalized cruise values per cylinder. Looks like clean break-in cooling. It isn’t.

Then I added one more variable.


The Thing That Broke the Story

The variable was fuel flow. I’d been logging it the whole time, but I hadn’t pulled it into the CHT analysis. The thought was: what is each flight’s mean cruise fuel flow, and does it correlate with CHT in any obvious way?

Here’s what it looked like:

FlightMean cruise FF (gph)nm/gal
F122.66.9
F219.57.5
F318.47.9
F420.37.2
F521.17.1
F619.838.11
F715.689.61
F816.49.9
F916.79.3
F1015.610.4

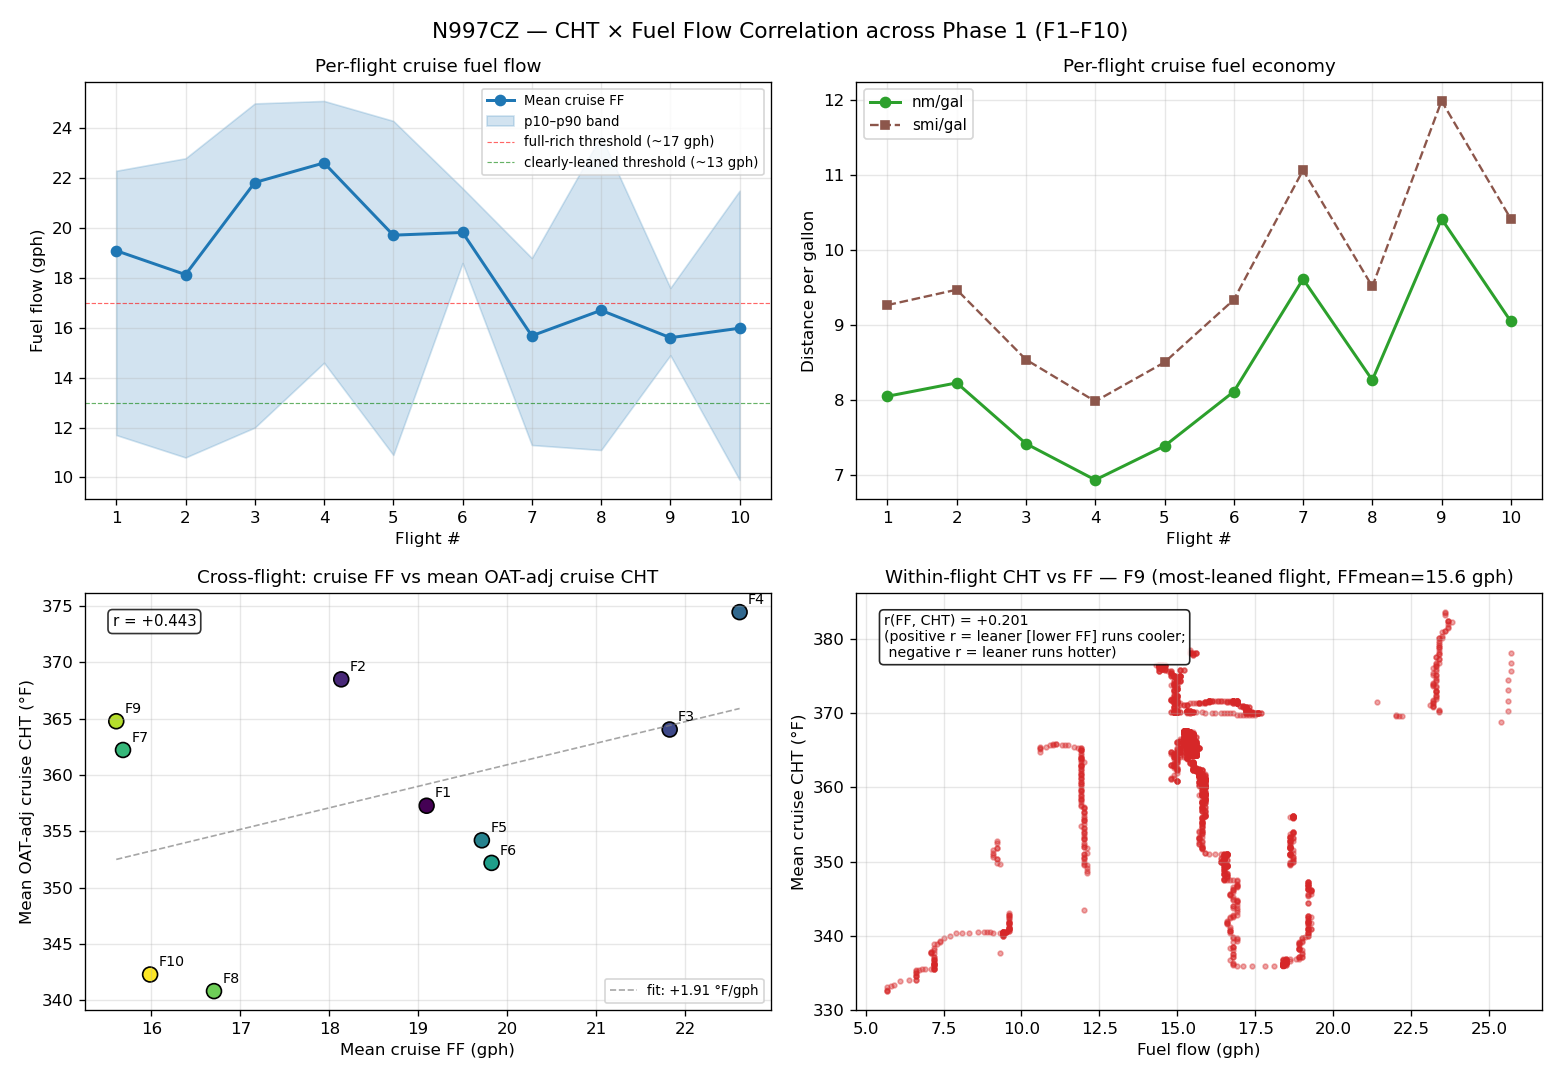
Look at the step between F6 and F7. Mean cruise fuel flow dropped from 19.83 to 15.68 gph — a sharp single-flight transition — and fuel economy stepped from 8.11 to 9.61 nm/gal (+18%). Every F7+ flight runs leaner than every F1–F6 flight, without exception.

That step is exactly what it looks like: it’s where I started leaning the mixture. F1 through F6 were flown with the mixture at full rich, per the typical break-in playbook. By F7 — about 10 engine hours in — I’d decided I had enough data to start running a little leaner in cruise, and the fuel-flow numbers tell the story.

CHT vs fuel flow chart across 10 flights showing the F7 leaning transition
CHT vs fuel flow across the 10 flights. The sharp step at F7 is where I started leaning the mixture — the exact same step that was being smeared into a false “break-in cooling” trend by the all-flights regression.

Now look at what that did to CHTs. The F6 → F7 comparison, OAT-adjusted: cruise CHT went UP +10°F from F6 to F7 (352°F → 362°F across the cylinder array). That’s the textbook leaning signature — pulling the mixture leaner moves combustion peak temperatures closer to the cylinder head, and head temps respond.

In other words, my break-in regression across F1 through F10 was fitting a smooth line through what is actually two different operating regimes. The “cruise CHT is dropping” trend wasn’t break-in; it was 60–70% the F7 leaning step pulling the F7+ flights down toward a different equilibrium. The regression couldn’t tell the difference.

It gets worse. Flight 10 had another step change: I pulled the air dam in front of Cyl 1. That’s a physical change to the cooling baffling. Another shift in the operating regime, layered on top of the leaning regime.


Re-fitting on the Clean Range

Once you know about a regime change, you fit around it, not across it. So I re-ran the regression on F1 through F6 only — the clean, full-rich, no-air-dam-mod range — and the picture changed entirely:

  • Cyl 1 c = +0.29 °F/flight (was −2.75 in the all-flights fit)
  • Cyl 2 c = +0.37 (was −1.52)
  • Cyl 3 c = +0.35 (was +0.10)
  • Cyl 4 c = +0.02 (was −1.31)
  • Cyl 5 c = −0.02 (was −0.86)
  • Cyl 6 c = −0.67 (was −1.33)
  • Mean c = +0.06 °F/flight (was −1.28)

Cruise CHT break-in, in the full-rich regime, is essentially zero. The cylinders are not measurably cooling at cruise as the engine accumulates hours. The earlier “Cyl 1 broke in fastest at −2.75°F/flight” was about 60–70% the F7 leaning step plus the F10 air-dam mod. The actual break-in signal in cruise data, in the regime where break-in is supposed to be happening, is statistical noise.

And the OAT sensitivity that I’d been wondering about (the all-flights fit said b ≈ +0.25, way below the engineering rule of thumb of 1.0) snapped back into shape when I limited it to the clean regime: b ≈ +0.89 °F CHT per °F OAT in F1–F6 only. The rule-of-thumb is roughly right for this engine in full-rich cruise; the previous low number was suppressed by mixing in the leaning regime.


Where Break-In Actually Shows Up

So is my engine breaking in at all? Yes — but the signal lives in maximum CHTs (climb conditions), not in cruise.

FlightCyl 1 MAX CHT
F1455°F
F2442°F
F3438°F
F4438°F
F5437°F
F6434°F

That’s a −21°F drop over six flights for the hottest cylinder, in conditions where the cooling system is running near its capacity. That’s the break-in signature. Climb is where the engine is making the most heat per unit of cooling air; that’s where any improvement in heat transfer (or any small reduction in friction work) is going to be most visible.

The lesson: cruise has so much cooling margin that ring-seating doesn’t move cruise temps in any measurable way. If you want to see break-in in your CHT data, look at the climb maxes, not at cruise medians. I’d been looking at the wrong column.


Lycoming SI 1427C and the Leaning Mistake

While I’m being honest about what I got wrong: Lycoming Service Instruction 1427C explicitly says do not lean during break-in. I leaned at Flight 7, which was around 10 engine hours of total operation — earlier than the manufacturer recommends. The good news is that F8 and F10 don’t show any distress signature (no CHT excursions, no rough running, no oil consumption surprises I can see), so it’s probably fine.

But the cleaner path for the remaining ~12 to 15 hours of break-in is to go back to full rich at high power, and let the cylinders finish seating against the cylinder walls without me changing the operating point underneath them.

There’s a second piece of Lycoming guidance worth flagging: their actual gold-standard test for “is break-in complete?” isn’t CHT at all. It’s oil consumption. When per-hour oil add stabilizes at a low and consistent rate, the rings have seated. I haven’t been tracking oil consumption nearly carefully enough through these first 10 flights, and that’s a habit I’m going to fix going forward.


The F10 Experiment

I mentioned the F10 air-dam removal in passing — that deserves its own paragraph because the result is interesting.

Cyl 1 has consistently been the hottest cylinder on this engine, and the cylinder layout (Lycoming IO-540, right bank front to rear: 1 → 3 → 5; left bank front to rear: 2 → 4 → 6) puts it at the front of the right bank, where you’d expect it to be getting the freshest, coolest induction air. So why is it always the hottest?

One hypothesis was that the small air-dam baffle in front of Cyl 1 was redirecting too much cooling air past it (toward Cyl 3 and Cyl 5 deeper in the bank) and not onto it. So I pulled the air dam before Flight 10 to see what happened.

The result, OAT-adjusted, F9 → F10 deltas:

  • Cyl 1 cruise: −32°F. Cyl 1 max: −33°F. That’s about 23°F of extra cooling on Cyl 1 beyond what the other (control) cylinders saw. Strong, clean air-dam-removal signal.
  • Cyl 3 (right middle, downstream of the redirected air): no penalty. Cruise tracked the control group; max actually dropped slightly.
  • Cyl 5 (right rear, downstream): the canary. Cruise tracked the control group. But max Cyl 5 went UP +9°F while every other cylinder went down 0–10°F. That’s a 12–18°F relative warm-up in the high-stress climb regime, on the cylinder that’s furthest downstream on the right bank.

So the air dam was doing real work — keeping enough air flow over to the back of the right bank to keep Cyl 5 happy during climb. F11 will be the test. If Cyl 5 max stays elevated relative to the trend, that’s a real climb-cooling cost and I’ll need to think about a partial air dam or a different baffle modification. If Cyl 5 pulls back into line, F10 was noise on a small sample size.


What I’d Do Differently

A few takeaways from this round of analysis, mostly aimed at past-me:

  1. Don’t lean during break-in. Lycoming says so, and it confounds your data in addition to whatever it does to your engine. I should have stayed full-rich for the first 25 hours.
  2. Always split your regression at known regime changes. Adding fuel flow as a variable, or just visually inspecting it for step changes, would have caught this before I started believing the −2.75 °F/flight number. A regression doesn’t know about operating regimes; you have to tell it.
  3. For break-in, watch max CHT, not cruise CHT. That’s where the cooling system is closest to its limits, and that’s where any change in heat transfer will show up. Cruise has too much margin to be a useful break-in metric on this engine.
  4. Track oil consumption rigorously. It’s the actual answer to “is break-in done?” — and I’ve been treating it as a footnote.
  5. Single-flight changes are not break-in. F10 looked great on Cyl 1, but it was one data point against a known air-dam-removal mod. F11/F12 will tell us whether that’s the new baseline or a fluke, and whether the Cyl 5 climb-cooling cost is real.

A Footnote on How This Analysis Got Done

I want to be honest about the workflow here, because it’s something I’m thinking about a lot lately. I built the original “Cyl 1 is breaking in fast” regression in an afternoon, and I was ready to ship it. The reason it didn’t ship that way is that I was talking through the result with Claude — Anthropic’s AI assistant — and it kept asking annoying questions like “have you looked at whether fuel flow changes across these flights?” and “are you sure the operating point is the same?” The fuel-flow analysis that broke the story open was prompted by exactly that kind of push-back.

I’ll write a longer post on this workflow at some point, but the short version: AI-assisted data analysis is genuinely useful for catching the things a tired homebuilder is about to ship. It’s also a useful collaborator for sanity-checking the math, generating the chart, and writing the script that drops a fuel-flow column into an existing dataframe. None of which is a substitute for thinking about the data carefully — but it’s a force multiplier on the thinking.


What’s Next

F11 and F12 are going to be the air-dam follow-up flights. The plan: go back to full-rich mixture, fly a representative climb-and-cruise profile, see what Cyl 1 cruise (does it stay near 354°F, or does it drop further — that distinguishes mod-only effect from continuing break-in) and Cyl 5 max (does it stay elevated, or pull back in line) do. And start logging oil add events more carefully so I have the actual break-in metric Lycoming cares about.

If you’re working through Phase 1 on a new engine yourself and you’ve been staring at CHT numbers wondering what they’re telling you, I hope this is useful. The headline I’d leave you with: watch the maxes, not the means; don’t change two things at once if you can avoid it; and if your data tells you a beautiful story, ask it what’s missing before you publish.


Posted from N997CZ flight test program — see the CAN Bus Rewire post for the most recent system-level fix, and the First Flight post for the origin of the CHT story.

N997CZ — CAN Bus Rewire: Fixing the Basics Before Chasing Vibration

After the ADAHRS vibration analysis across the first five flights, Garmin’s guidance was unambiguous: fix the CAN bus first, then work the vibration problem. The data showed sustained % deviation throughout every flight — but some of those readings may have been contaminated by CAN bus dropouts rather than pure vibration. You can’t separate the two until the bus is clean.

So before touching the prop balance or the ADAHRS mounts, we pulled the old harness and rewired the entire CAN bus from scratch with the correct 120Ω controlled-impedance spec wire.

Why does this matter? Garmin specifies a maximum CAN bus length of 20 meters (66 feet) using controlled-impedance twisted pair wire. The original N997CZ installation used standard shielded twisted pair — not the specified 120Ω wire — and measured approximately 96.5 feet total. Both the wrong wire and the excessive length can cause impedance mismatches, signal reflections, and the kind of intermittent dropouts Garmin’s tech support confirmed in Flights 1–3.

Before and After: Every Node on the Bus

The CAN bus in N997CZ runs as a daisy chain from the PFD1 terminator through thirteen avionics boxes to the roll servo terminator at the far end. The measurements below are the wire lengths between adjacent nodes — not the lengths attributable to any single box.

Node Was New length
PFD1 TERM

63" 28"
G5 Sockets

55" 20"
ADAHRS #1 Sockets

34" 15"
ADAHRS #2 Sockets

83" 20"
EIS Sockets

89" 28"
Audio panel 3-row pin

86" 28"
GMC507 autopilot 3-row pin

84" 28"
GAD27 Sockets

71" 37"
MFD Sockets

73" 36"
PFD2 Sockets

75" 35"
COM2 (GTR20) Sockets

32" 28"
GAD29 ARINC Sockets

193" 181"
Pitch servo

220" 208"
Roll servo TERM
Total 1,158" / 96.5 ft 692" / 57.7 ft

Wire lengths in inches between adjacent CAN bus nodes. New length = larger of wire-only vs. shield & pin measurement. Garmin max: 792" / 66 ft.

96.5 ft
Old total
57.7 ft
New total
−38.8 ft
Saved
66 ft
Garmin max
The new harness comes in at 57.7 ft — comfortably under Garmin’s 66 ft maximum. The old harness was 30.5 ft over spec.

What’s Next

With the CAN bus now on spec wire and properly sized, the next flights will establish a clean baseline. If the % deviation drops significantly, that confirms the old wiring was a major contributor. Whatever remains after that points squarely at vibration — and the prop balance, SB 2144 GSU assessment, and mount evaluation are queued up to address it.