
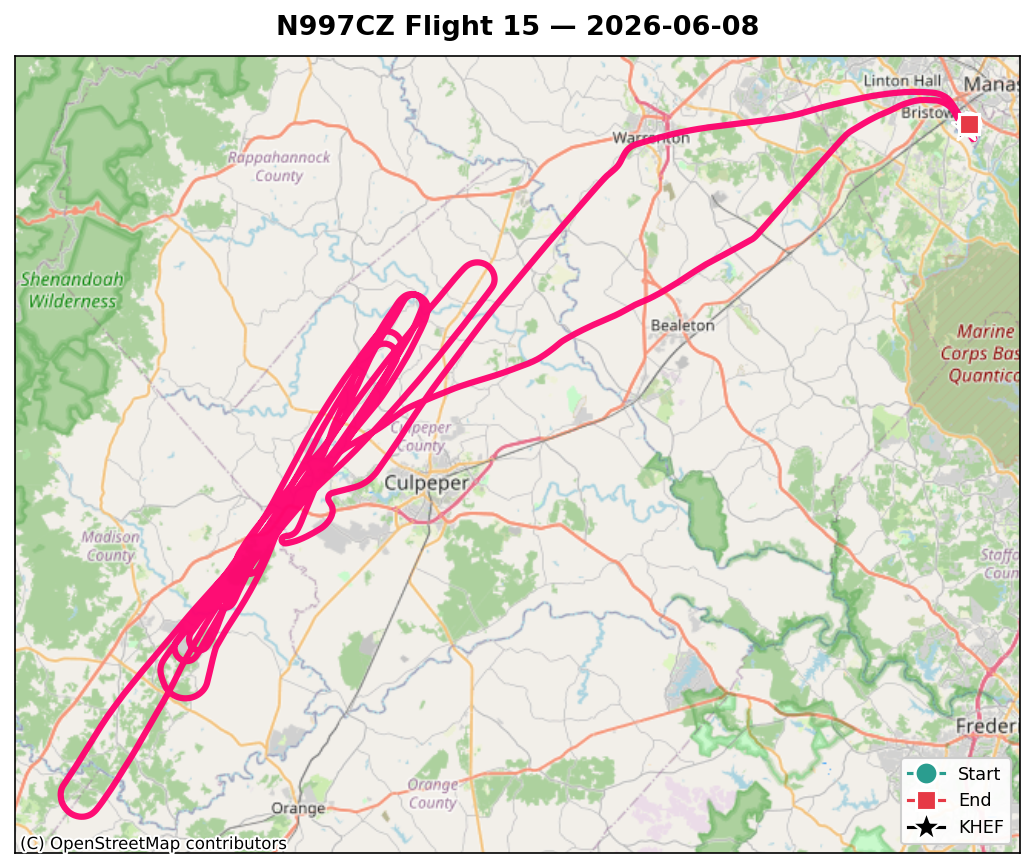
Flight 15 was the longest sortie of the program so far — three hours on the Hobbs — and it had one main job: measure how fast this airplane climbs, and at what speed it climbs best. That means a sawtooth: a stack of timed full-power climbs, each flown at a different airspeed, so the rate-of-climb-versus-speed curve falls out of the data.
It also carried over the one stall card Flight 13 didn’t get to — the accelerated/turning stall — so this post has a little of everything.
The Numbers
| Date | 2026-06-08 (morning) |
| Engine time | ~2.9 hr (longest yet; ~3.0 hr Hobbs) |
| Engine hours | 19.1 → 22.0 |
| Max altitude | ~7,700 ft MSL (7,961 ft GPS) |
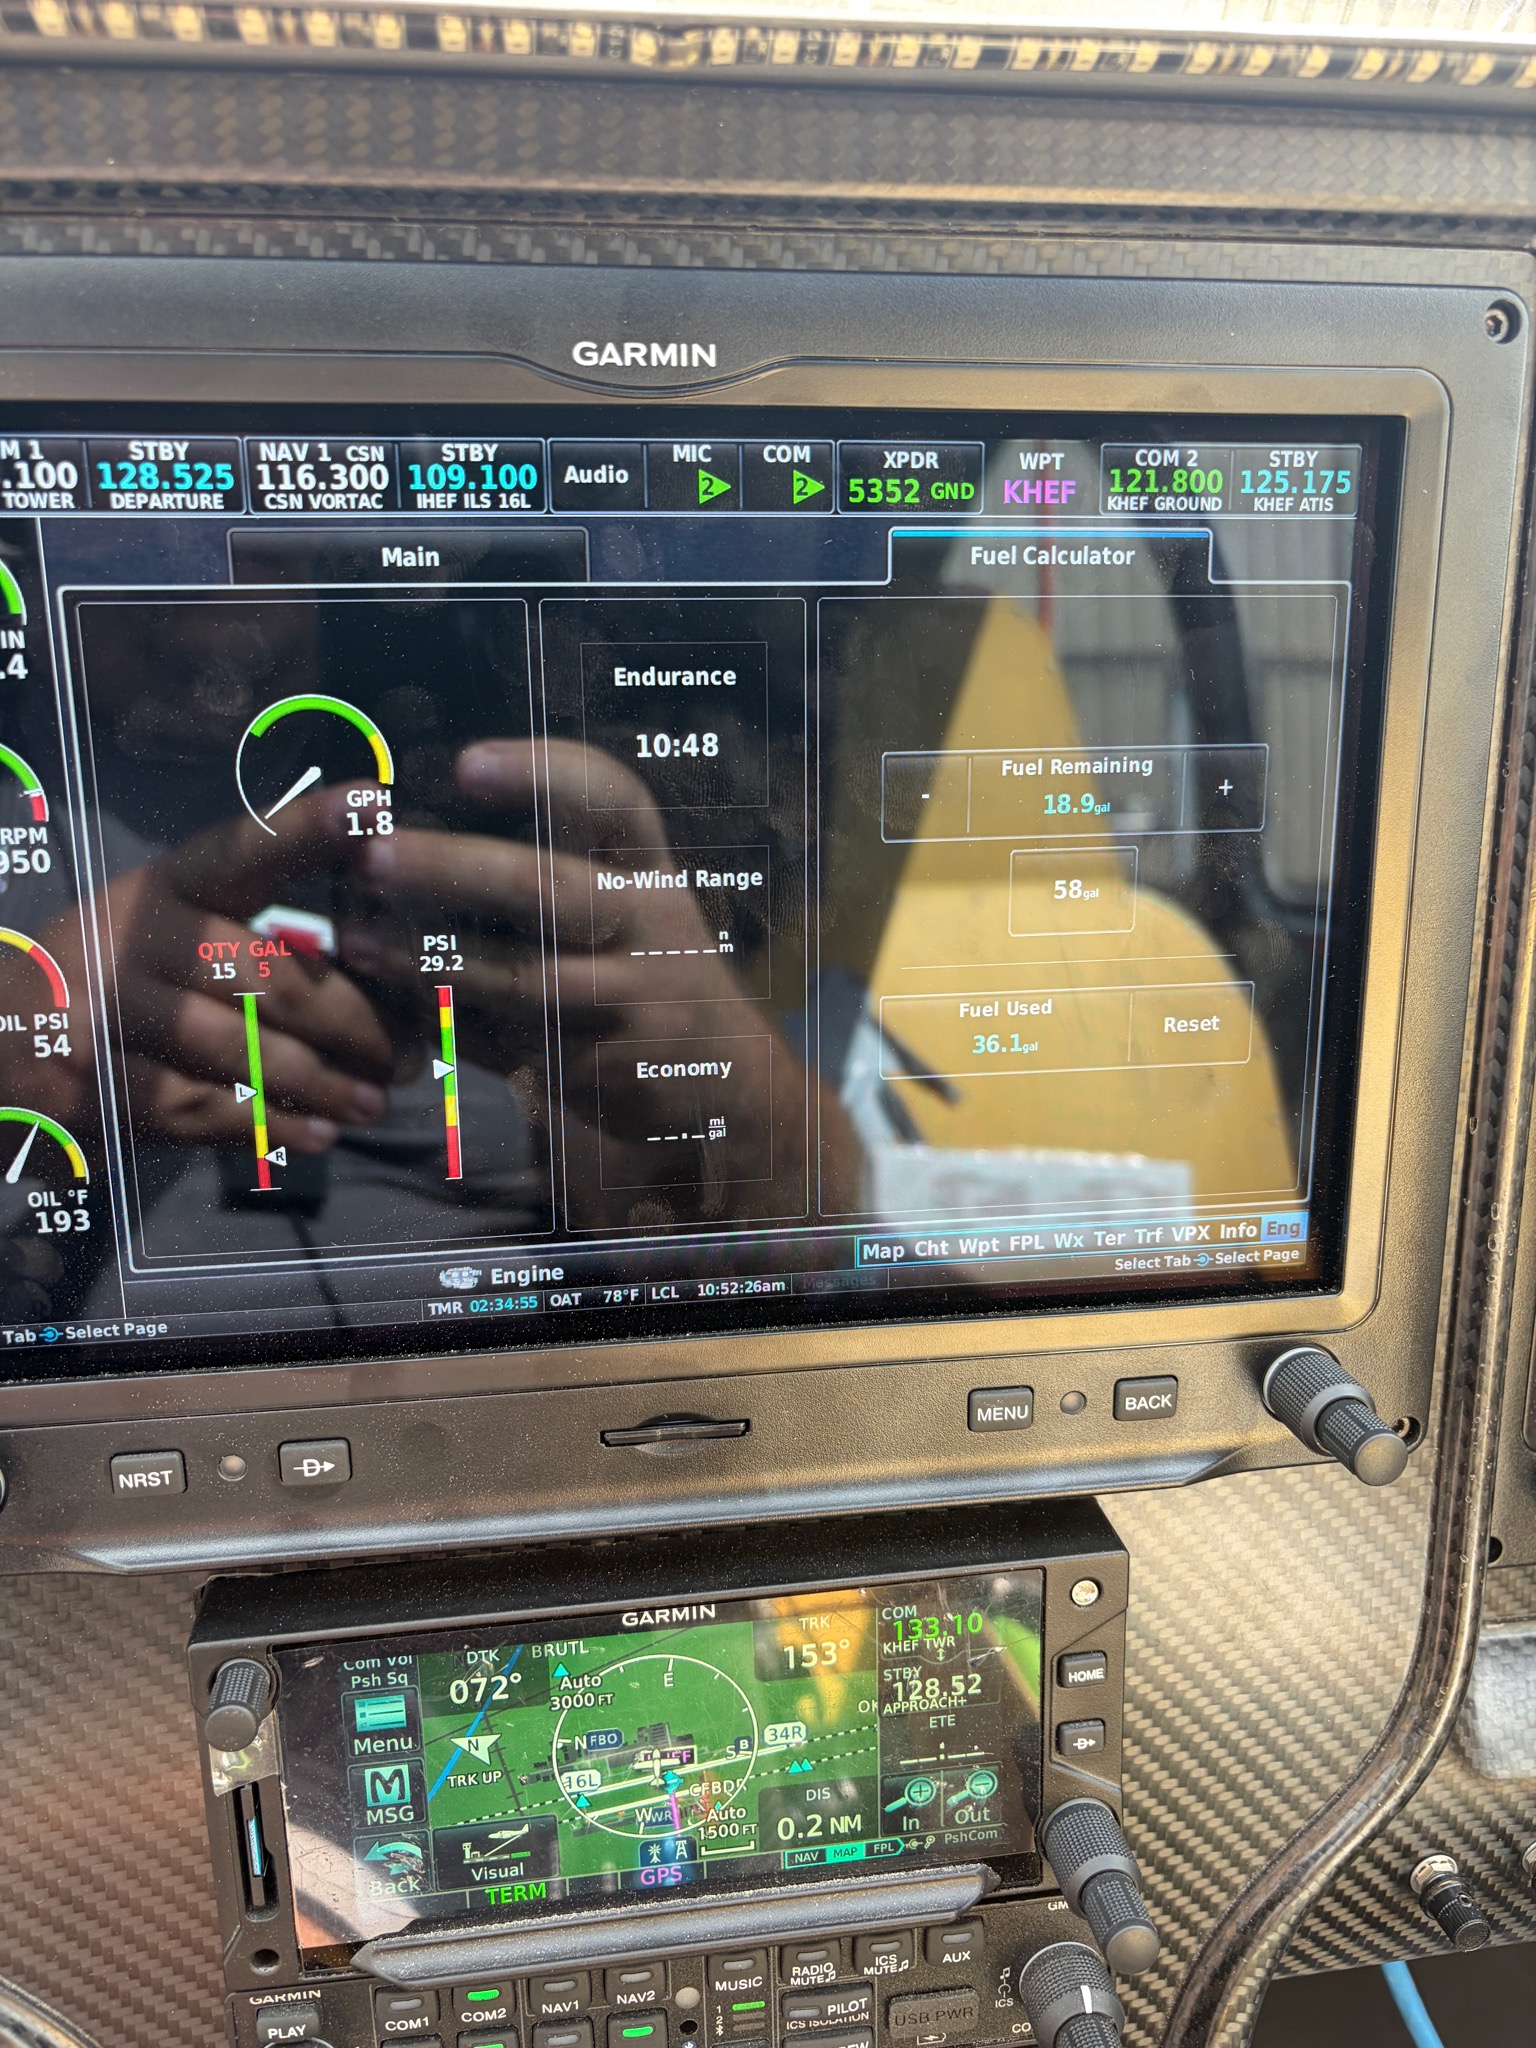
| Fuel used | 36.1 gal (totalizer) — matched the truck receipt (36.40 gal) to 0.3 gal |
| Cards flown | 15-1 (accel/turning stall), 15-2 (climb set-up + cooling), 15-3 (sawtooth climbs) |
| Conditions | cool-ish morning (cruise OAT +61 °F) |
📄 Test cards: Flight 15 test cards (PDF)
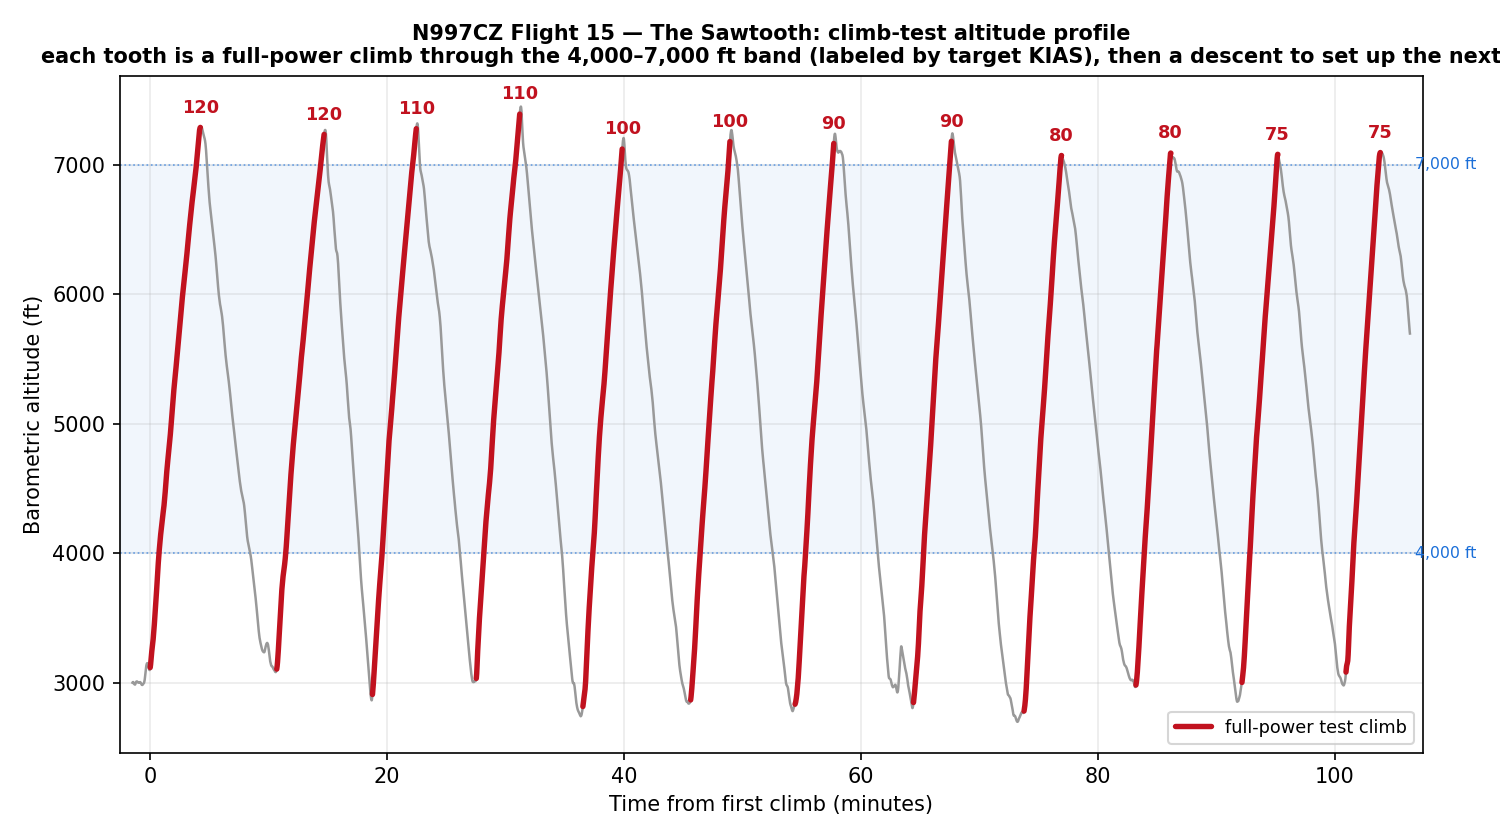
The Sawtooth
The plan: two full-power climbs at each of 120, 110, 100, 90, 80, and 75 KIAS — twelve timed test climbs in all — each one taken through the same 4,000-to-7,000 ft band so the runs are directly comparable. Flown back to back, the altitude trace draws the maneuver’s namesake: a row of teeth, each a full-power climb up through the band followed by a descent to set up the next.
Timing each of those climbs gives the headline result — rate of climb against indicated airspeed:
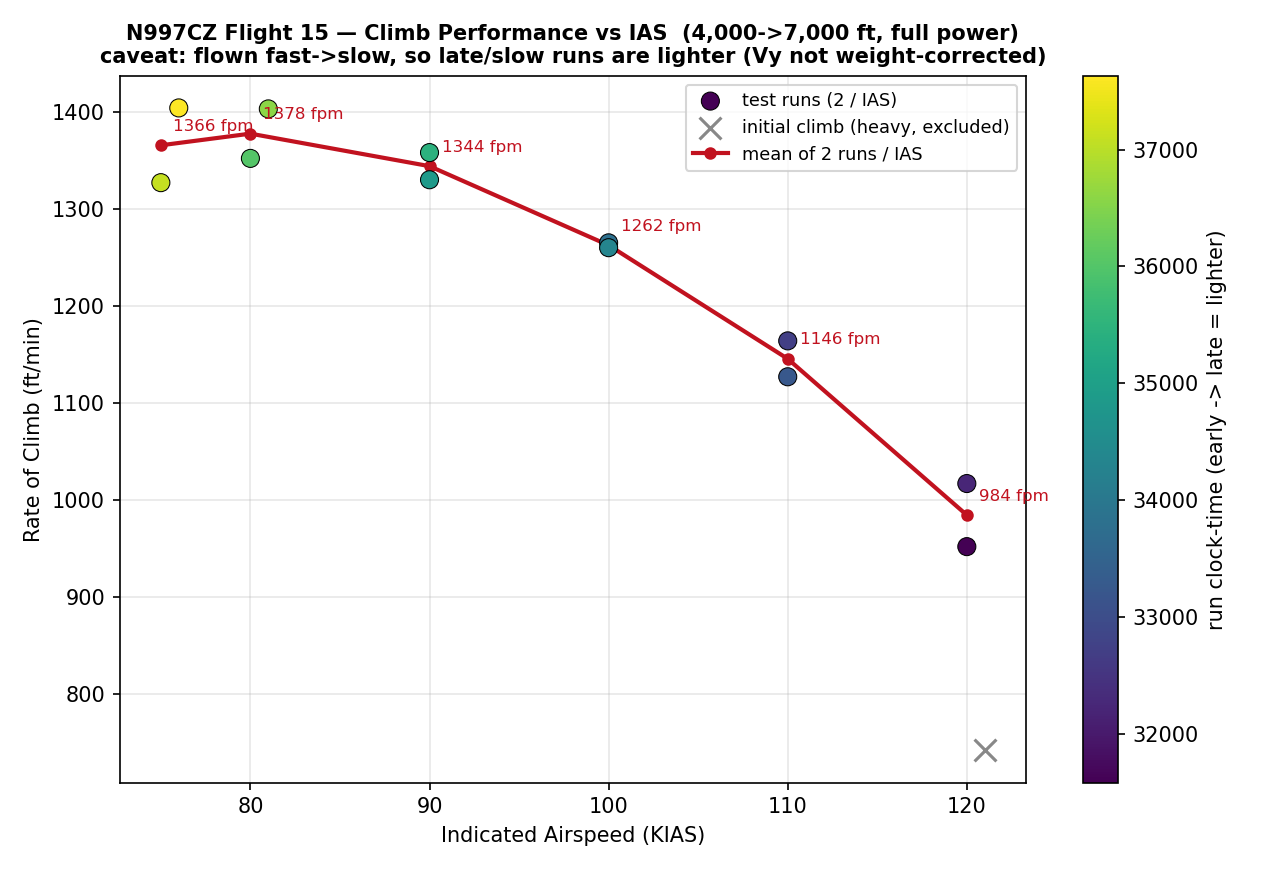
Read the raw numbers and the airplane looks like it climbs best slow: roughly 1,000 fpm at 120 KIAS rising to ~1,470 fpm near 80 KIAS. But there’s a catch, and it’s an important one. The runs were flown fast-to-slow over two hours, so by the time we got to the slow climbs the airplane was lighter — it had burned an hour-plus of fuel. A lighter airplane climbs better, so some of that “80 knots is best” result is really just “the airplane weighed less by then.”
The honest takeaway: the raw best-rate speed sits around 80 KIAS, but after correcting for the weight change, Vy is more likely up around 85–90 KIAS. Pulling the clean, weight-normalized Vx/Vy out of this dataset is a data-reduction job still on the bench — a good subject for its own post.
Cooling Held
Climb testing is where you find out whether your cooling can take sustained full power. The card set hard limits — back off if any CHT hit 420 °F, level off and enrich at 450 °F. We never got close: every climb topped out between 366 and 411 °F, with Cylinder 5 the hottest (411 °F), exactly as the air-dam canary from earlier flights predicted. No aborts, plenty of margin.
The Carried Stall
Before the climbs, we cleaned up unfinished business from Flight 13: the accelerated / turning stall (card 15-1). Three banked breaks in each direction at about 25° of bank, breaking around 60–65 KIAS with the nose up and the G unloaded at the break. Textbook, and the last stall card in the deck is now checked off.
Cabin CO stayed benign all flight (peak 2 ppm), and the new overhauled AHRS #1 behaved — though the other attitude unit had a tell on this flight, which is a story told in full in the AHRS post.
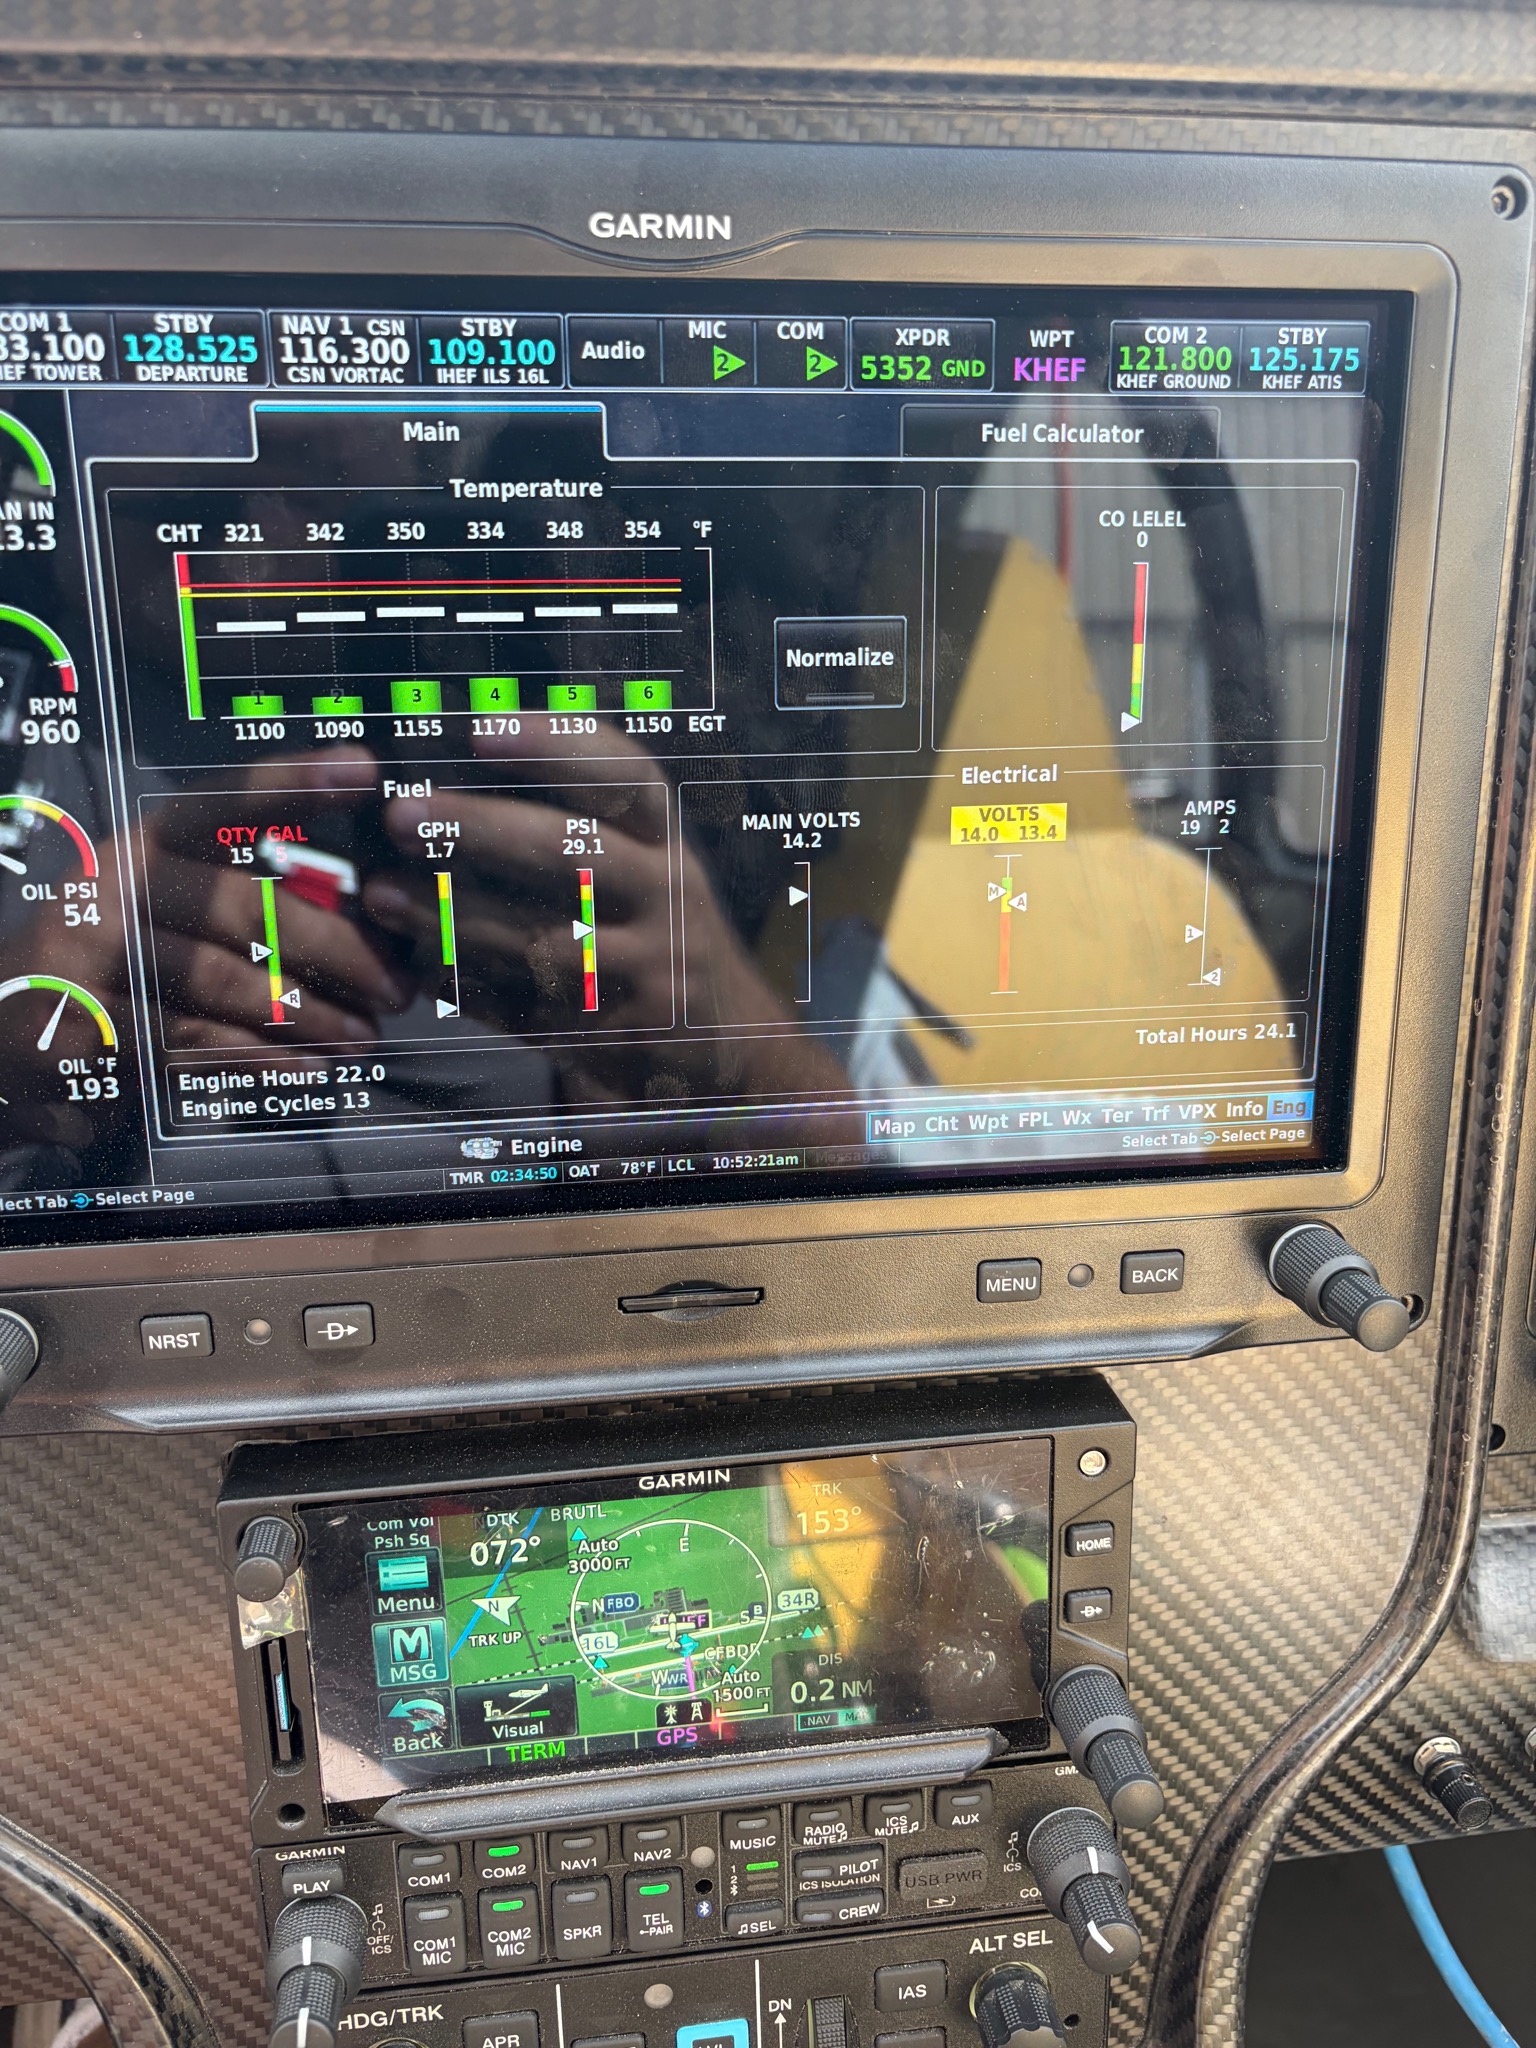
After Shutdown
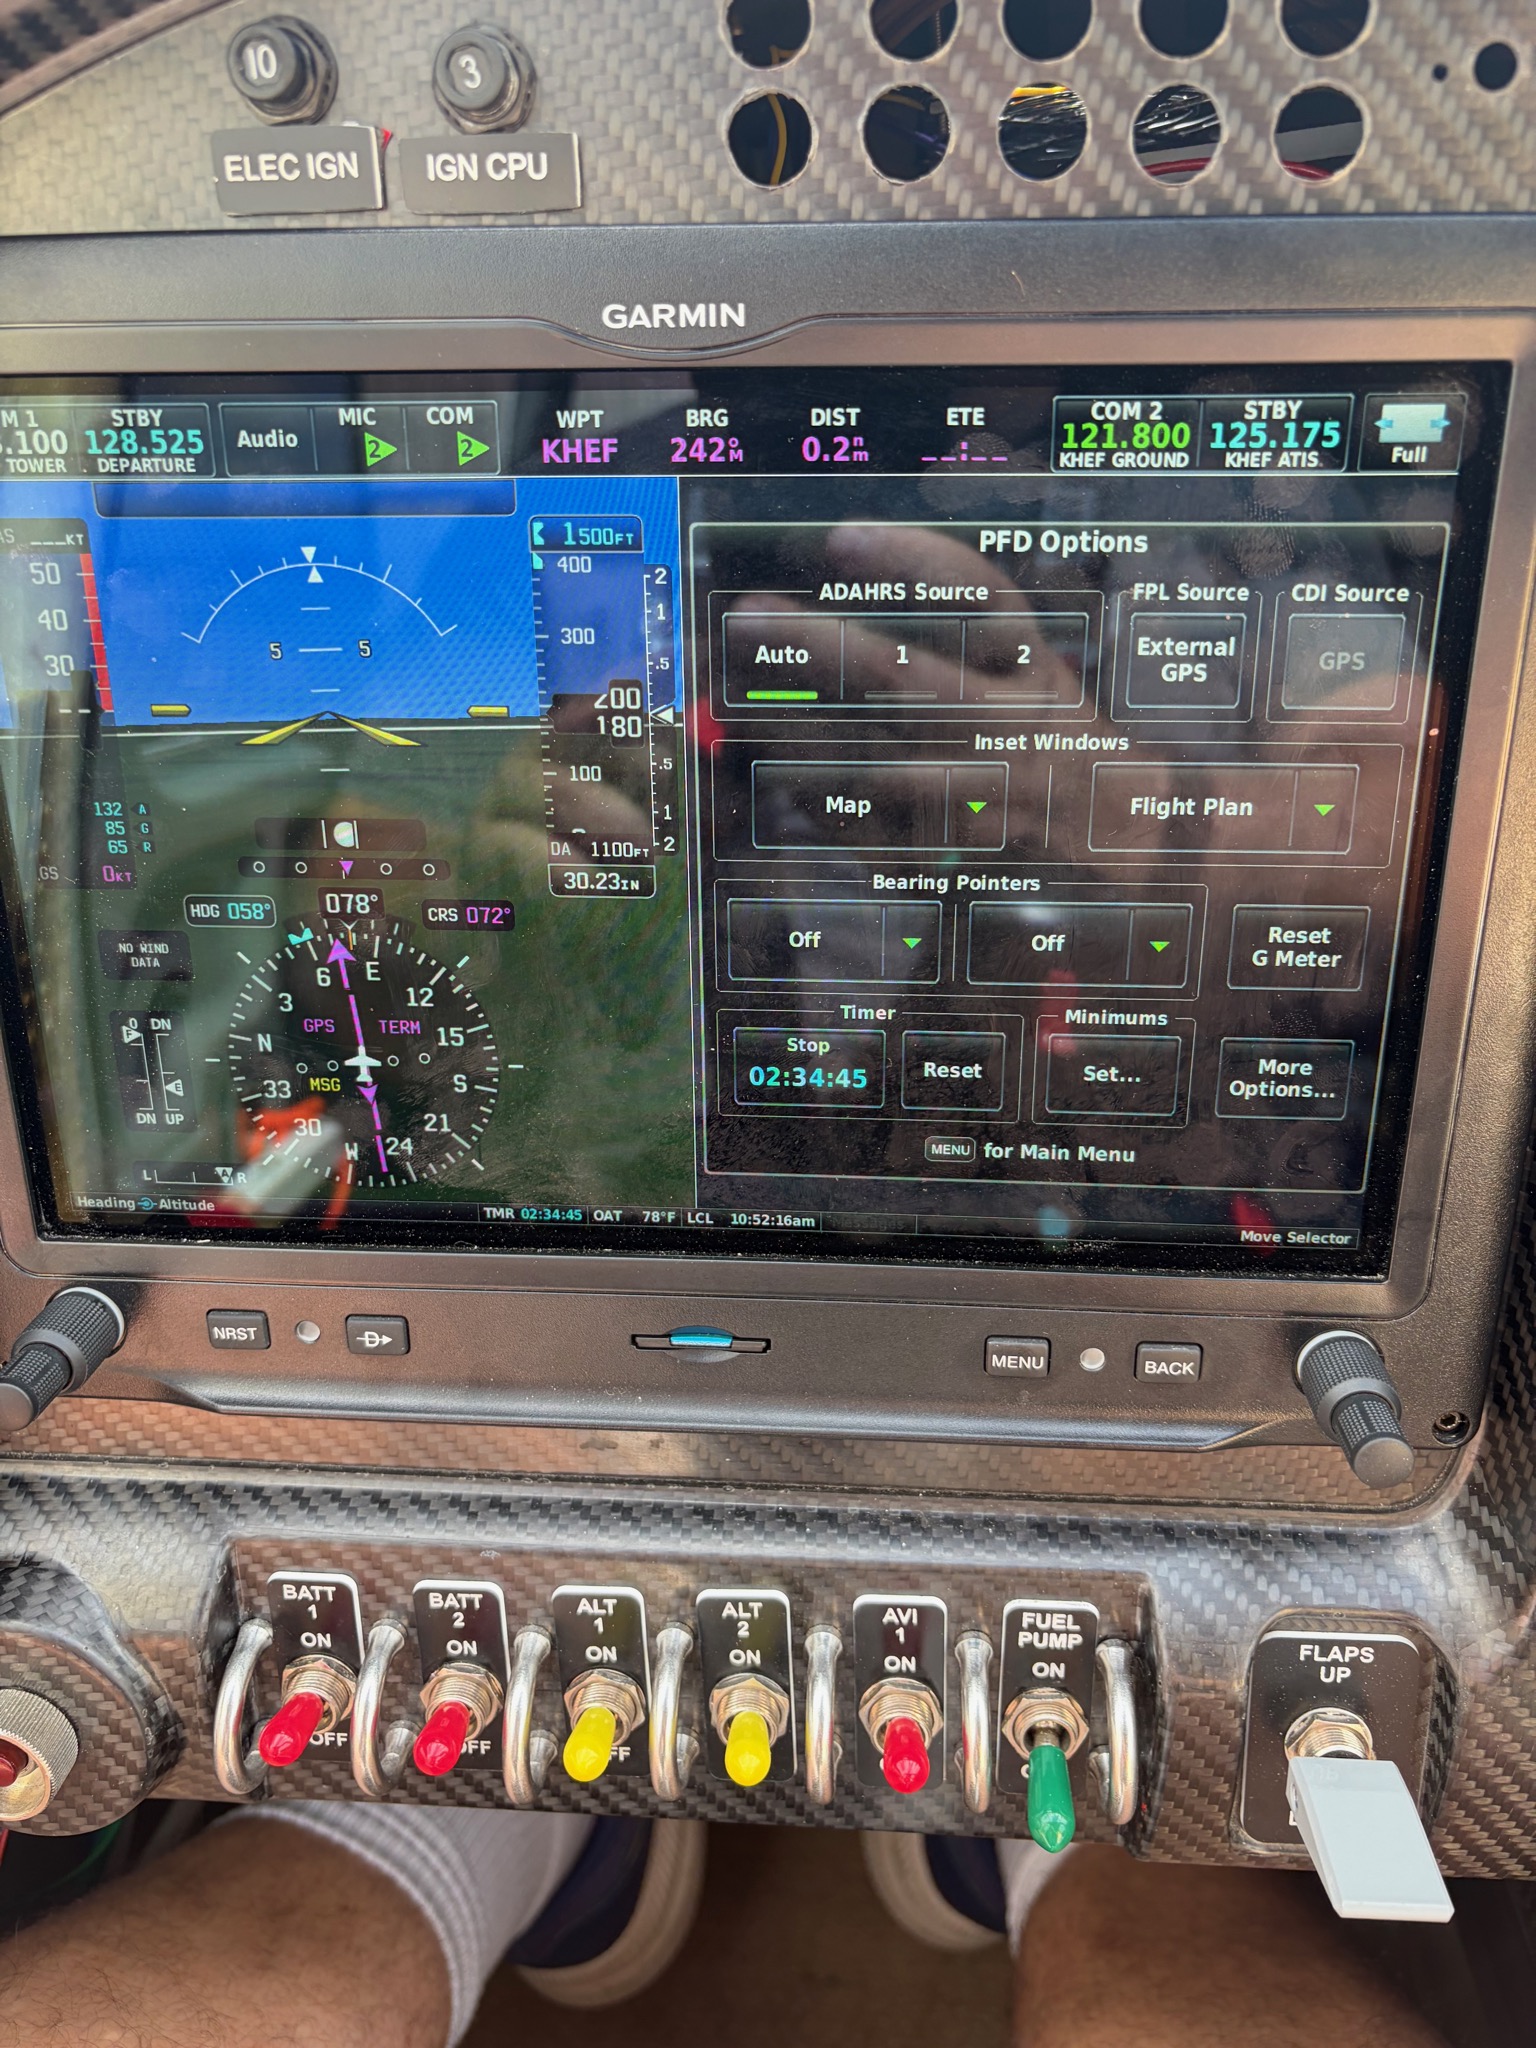
A few panel photos from the ramp after the flight — documentation of the day’s totals, not in-flight readings:
Bottom Line
Three hours, twelve timed climbs, a carried stall finished, and cooling that never blinked. The sawtooth is in the can; the weight-corrected Vx/Vy reduction is the homework. Next up: cruise performance and leaning.
— Jim
