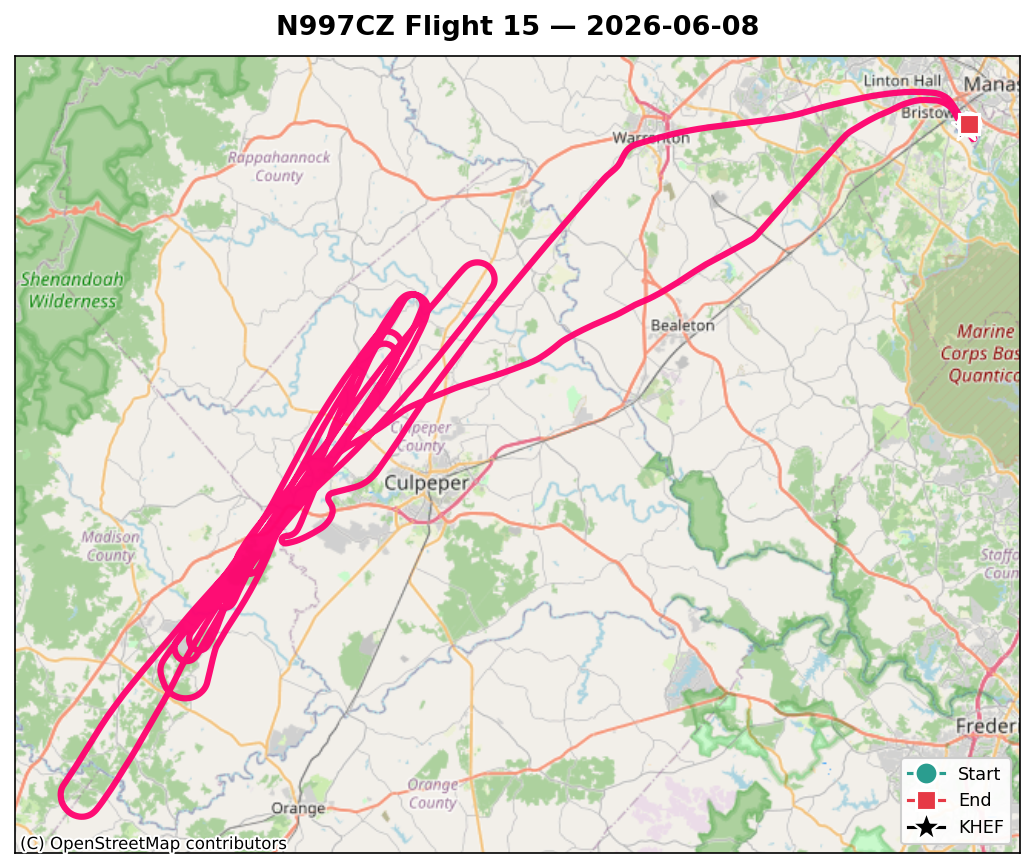
N997CZ Flight 15 ground track — the day’s flight over the Phase 1 test area
Flight 15 was the longest sortie of the program so far — three hours on the Hobbs — and it had one main job: measure how fast this airplane climbs, and at what speed it climbs best. That means a sawtooth: a stack of timed full-power climbs, each flown at a different airspeed, so the rate-of-climb-versus-speed curve falls out of the data.
It also carried over the one stall card Flight 13 didn’t get to — the accelerated/turning stall — so this post has a little of everything.
The Numbers
Date
2026-06-08 (morning)
Engine time
~2.9 hr (longest yet; ~3.0 hr Hobbs)
Engine hours
19.1 → 22.0
Max altitude
~7,700 ft MSL (7,961 ft GPS)
Fuel used
36.1 gal (totalizer) — matched the truck receipt (36.40 gal) to 0.3 gal
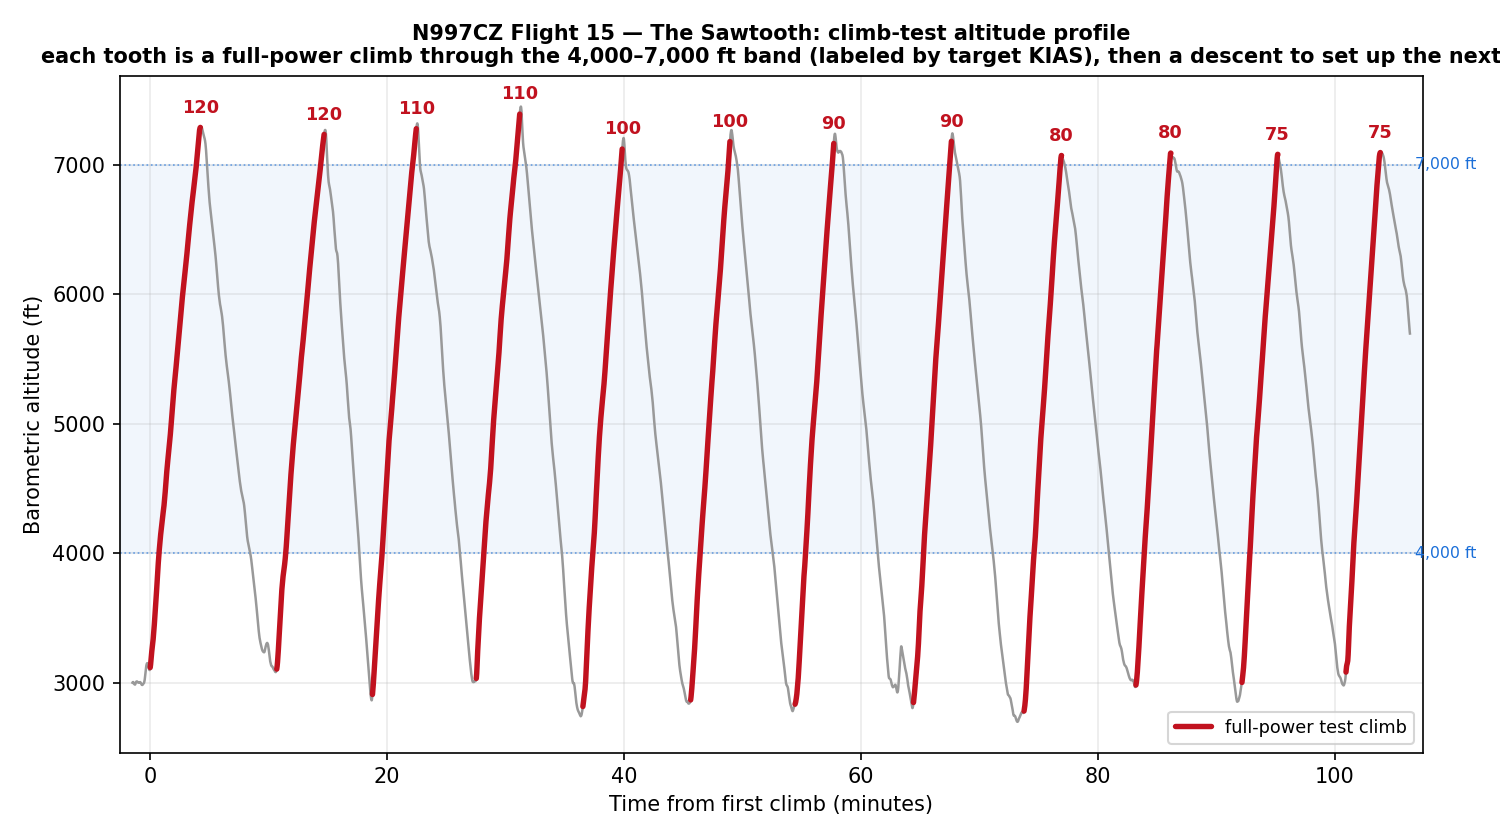
The plan: two full-power climbs at each of 120, 110, 100, 90, 80, and 75 KIAS — twelve timed test climbs in all — each one taken through the same 4,000-to-7,000 ft band so the runs are directly comparable. Flown back to back, the altitude trace draws the maneuver’s namesake: a row of teeth, each a full-power climb up through the band followed by a descent to set up the next.
Flight 15 climb-test altitude profile — the literal sawtooth: each tooth a full-power climb through the 4,000–7,000 ft band, labeled by target KIAS
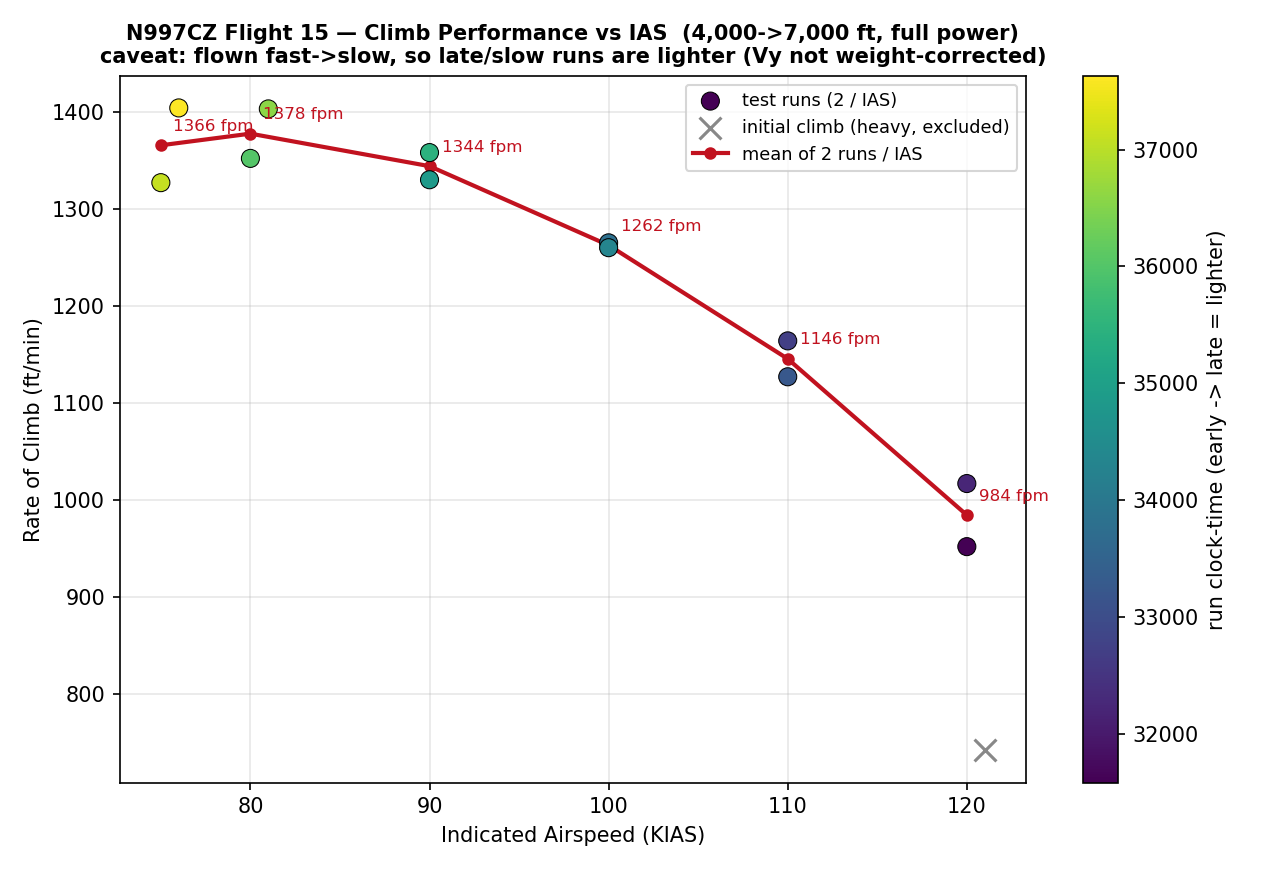
Timing each of those climbs gives the headline result — rate of climb against indicated airspeed:
Rate of climb vs indicated airspeed — raw sawtooth result (weight-biased; see text)
Read the raw numbers and the airplane looks like it climbs best slow: roughly 1,000 fpm at 120 KIAS rising to ~1,470 fpm near 80 KIAS. But there’s a catch, and it’s an important one. The runs were flown fast-to-slow over two hours, so by the time we got to the slow climbs the airplane was lighter — it had burned an hour-plus of fuel. A lighter airplane climbs better, so some of that “80 knots is best” result is really just “the airplane weighed less by then.”
The honest takeaway: the raw best-rate speed sits around 80 KIAS, but after correcting for the weight change, Vy is more likely up around 85–90 KIAS. Pulling the clean, weight-normalized Vx/Vy out of this dataset is a data-reduction job still on the bench — a good subject for its own post.
Cooling Held
Climb testing is where you find out whether your cooling can take sustained full power. The card set hard limits — back off if any CHT hit 420 °F, level off and enrich at 450 °F. We never got close: every climb topped out between 366 and 411 °F, with Cylinder 5 the hottest (411 °F), exactly as the air-dam canary from earlier flights predicted. No aborts, plenty of margin.
The Carried Stall
Before the climbs, we cleaned up unfinished business from Flight 13: the accelerated / turning stall (card 15-1). Three banked breaks in each direction at about 25° of bank, breaking around 60–65 KIAS with the nose up and the G unloaded at the break. Textbook, and the last stall card in the deck is now checked off.
Cabin CO stayed benign all flight (peak 2 ppm), and the new overhauled AHRS #1 behaved — though the other attitude unit had a tell on this flight, which is a story told in full in the AHRS post.
After Shutdown
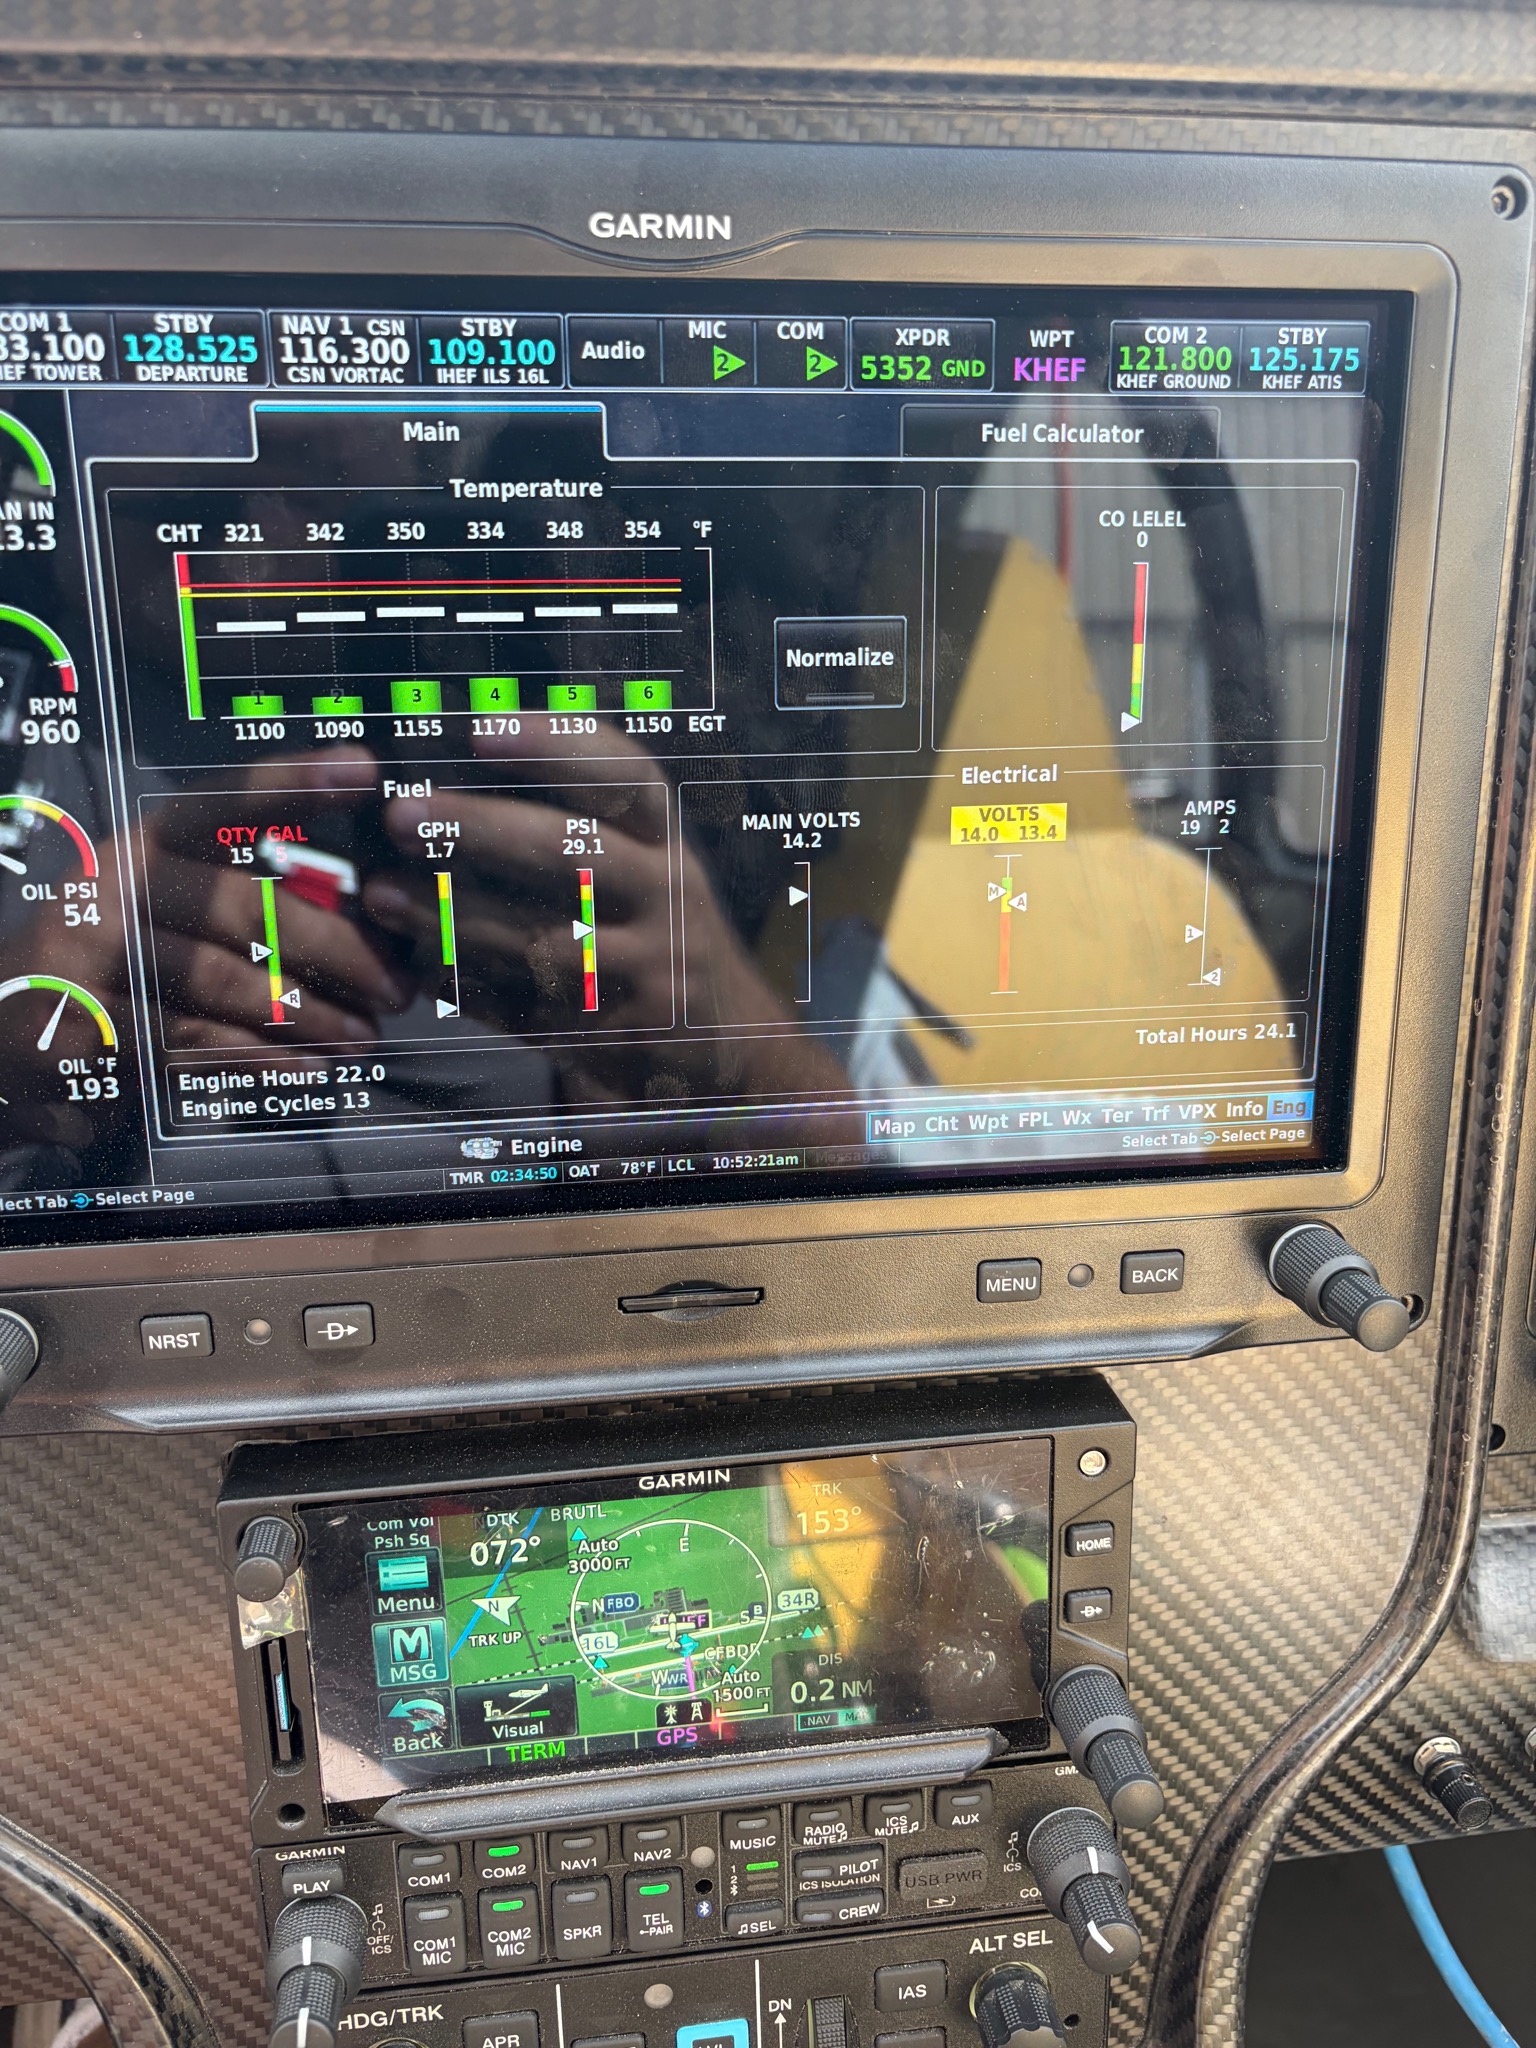
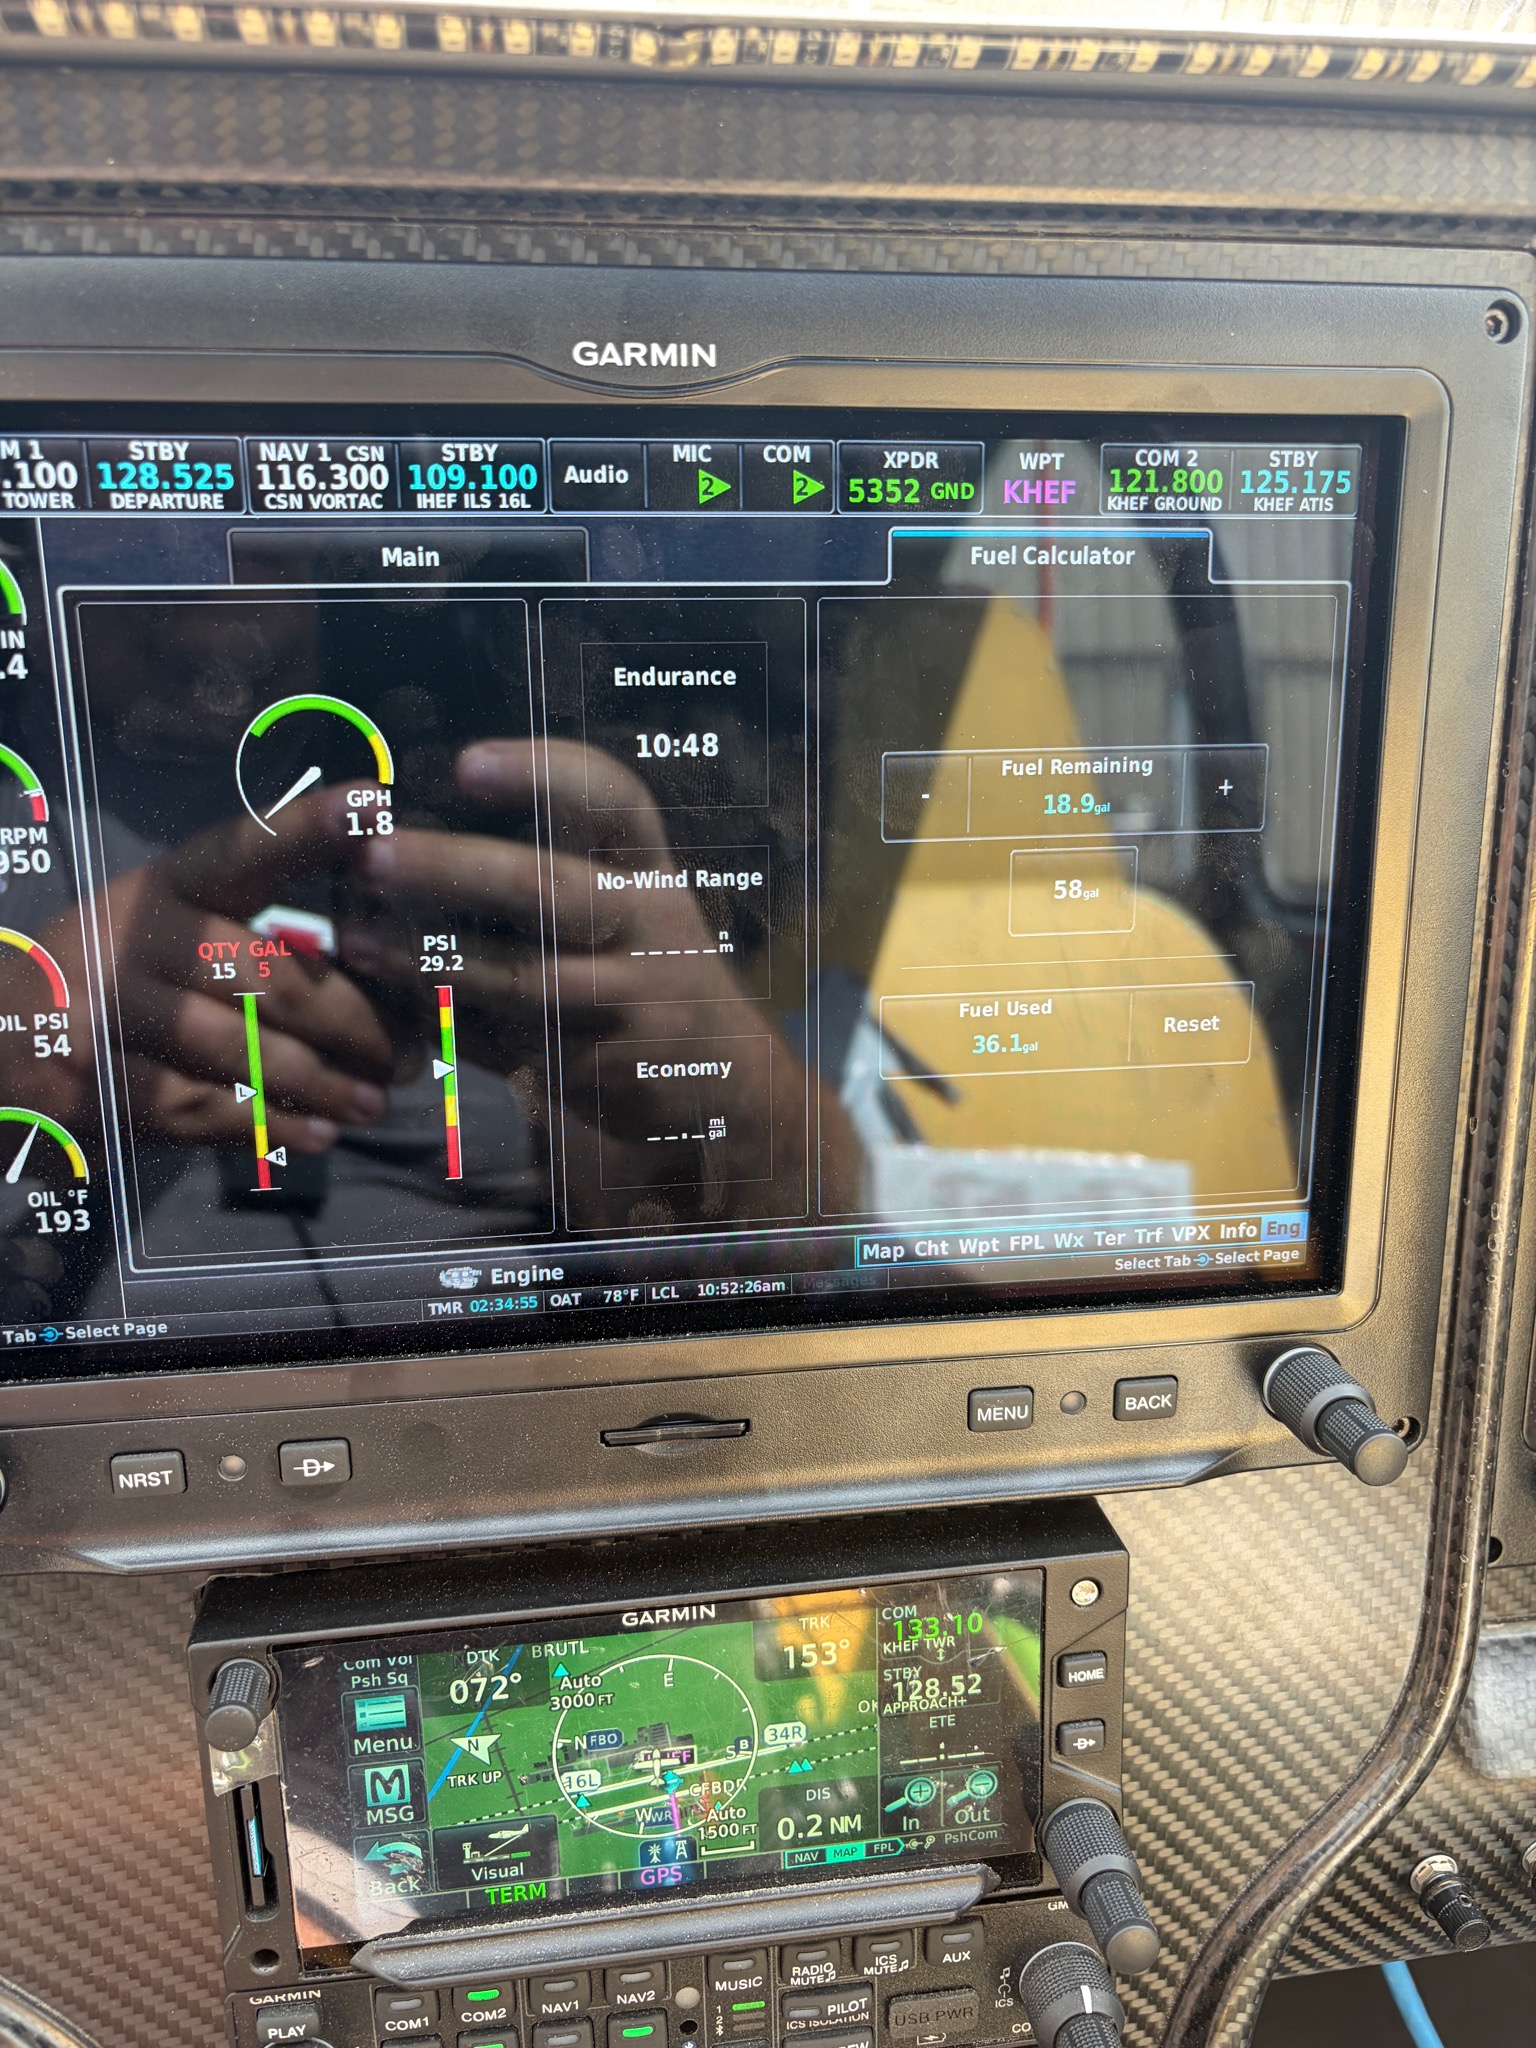
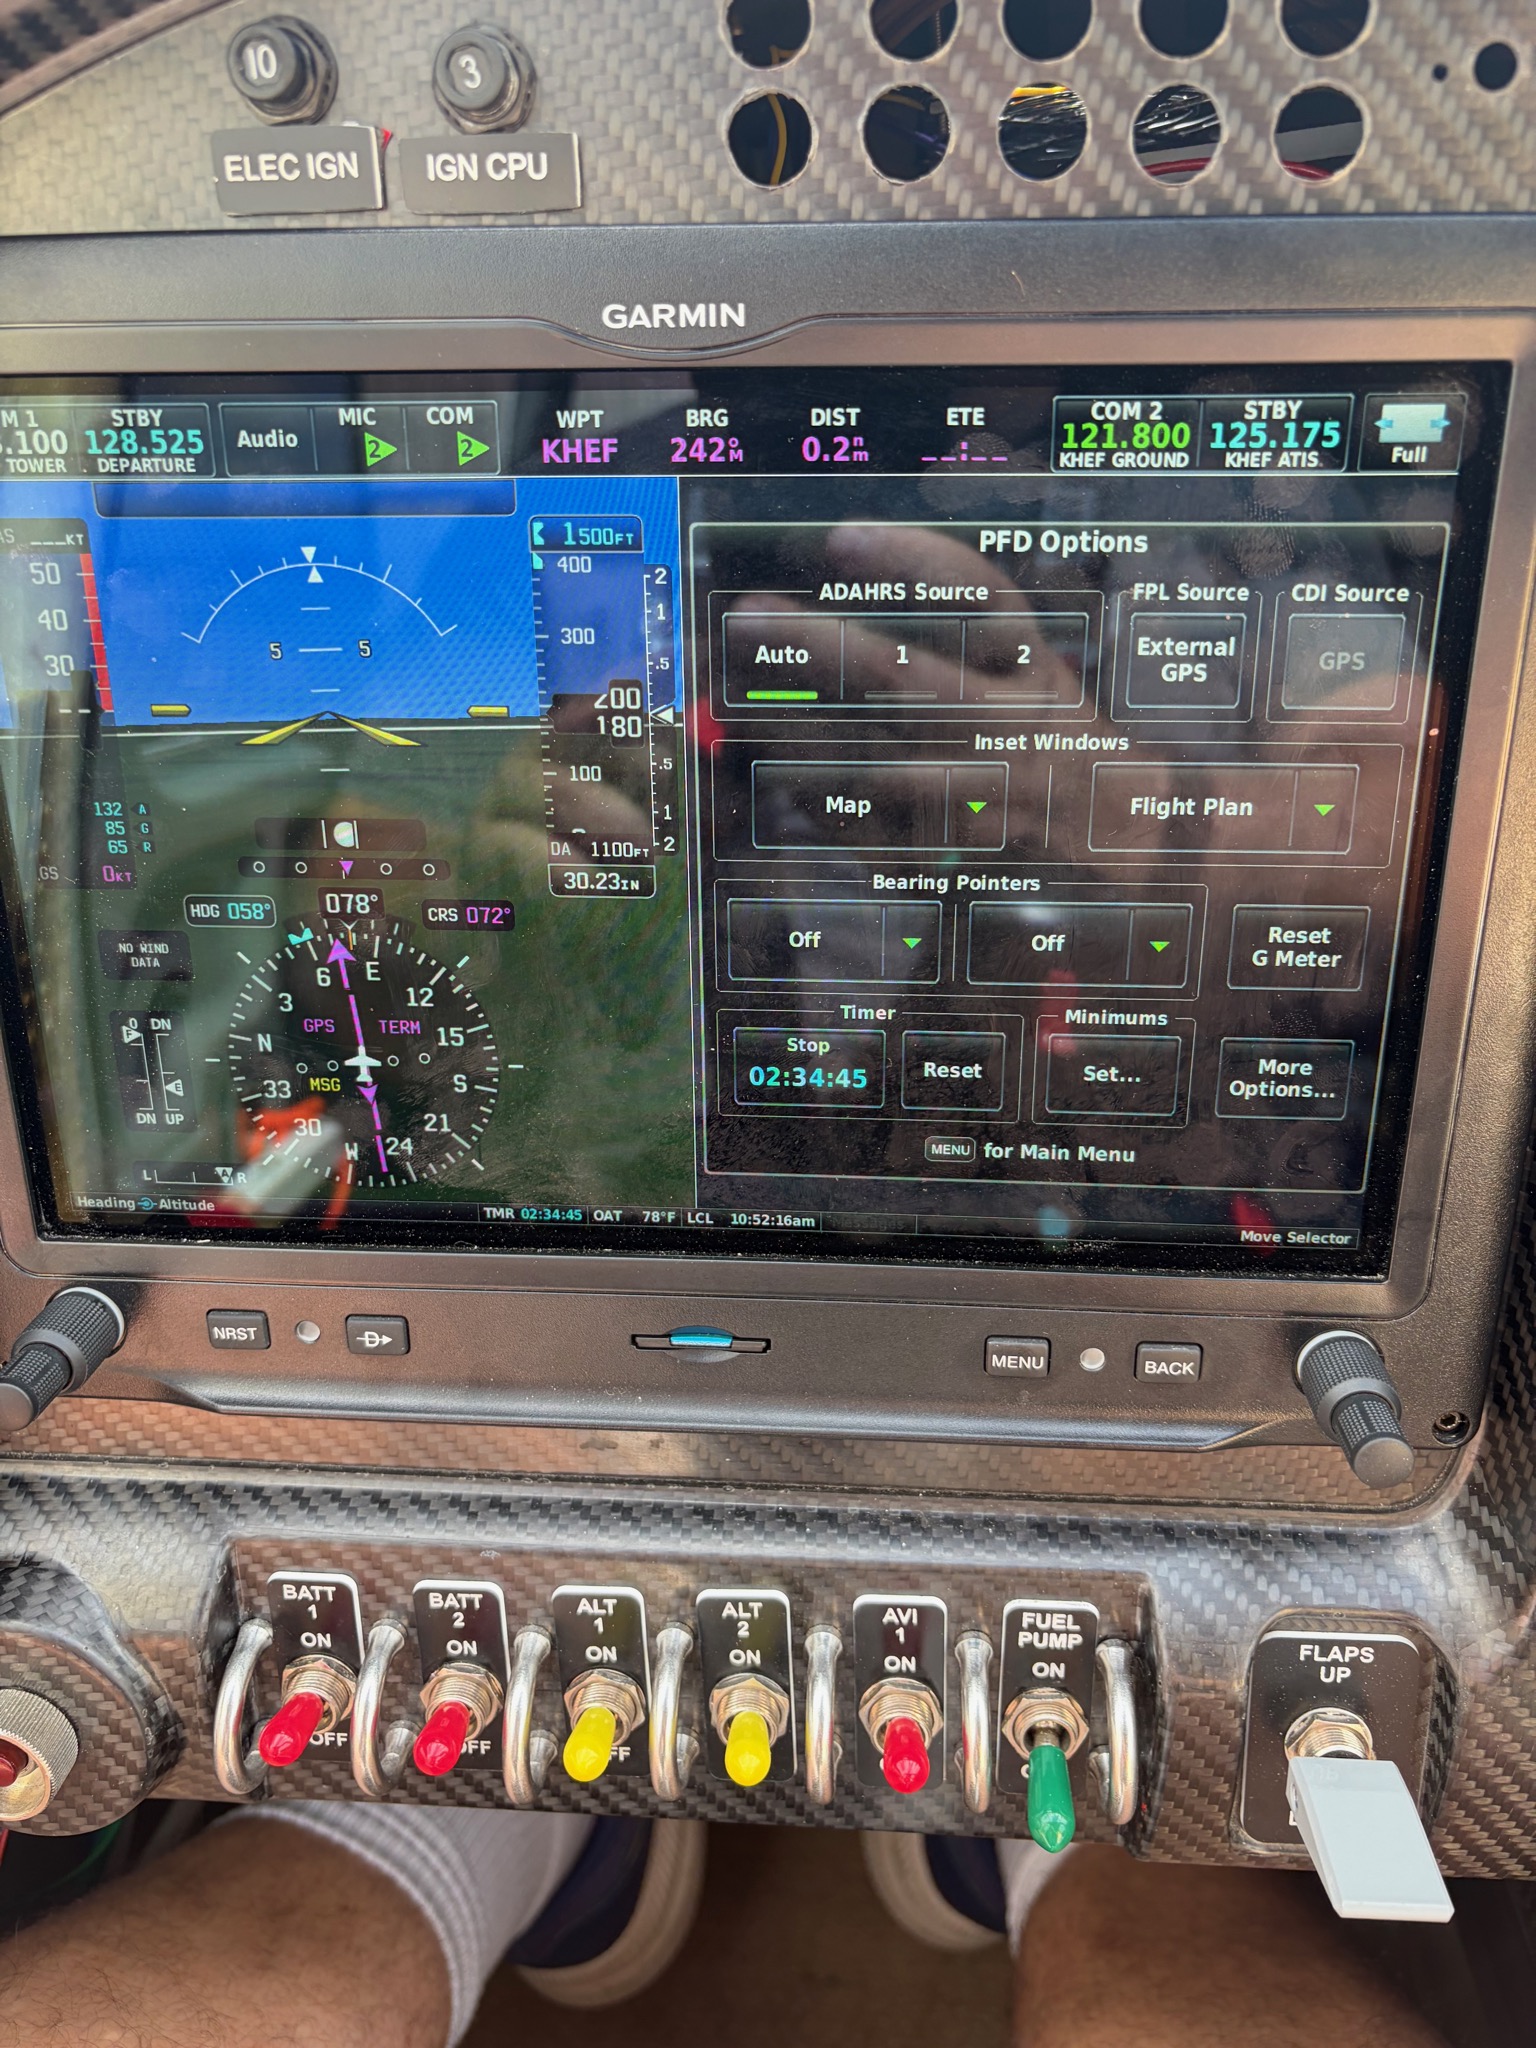
A few panel photos from the ramp after the flight — documentation of the day’s totals, not in-flight readings:
The G3X engine page after shutdown — CHTs already settling into the 320s–350s following the three-hour sortieThe Fuel Calculator at shutdown — 36.1 gallons used, matching the truck receipt to a third of a gallonThe PFD’s ADAHRS source page at shutdown — three attitude sources, all in agreement at the end of a long day
Bottom Line
Three hours, twelve timed climbs, a carried stall finished, and cooling that never blinked. The sawtooth is in the can; the weight-corrected Vx/Vy reduction is the homework. Next up: cruise performance and leaning.
Ground track for Flight 13 over the Phase 1 test area.
Every flight test program has a day where you stop sneaking up on the stall and just go fly it. For N997CZ, that was Flight 13. The slow flight and first banked stalls on Flight 12 had shown the airplane was honest at high angle of attack; this flight was about systematically documenting where the wing quits — clean, with flaps, and with power on — and doing all of it with a lot of sky underneath.
It was also the flight that finally set the airplane free of round numbers: a new program-high altitude of 11,520 ft MSL (12,069 ft GPS).
The Numbers
Date
2026-06-07
Engine time
~2.2 hr
Distance
233.3 nm (GPS path)
Fuel used
24.1 gal (totalizer)
Engine hours
16.2 → 18.3
Max altitude
~11,520 ft MSL (12,069 ft GPS) — new program high
Cruise OAT
+67 °F (warm day)
Loading
solo, light weight
Cruise mixture
leanest yet — ~11.5 gph
The Card Deck
Flight 12 only got partway through the stability cards before the slow-flight work used up the morning, so this flight’s deck rolled the leftovers in with the stall series — eight cards in fly order: area set-up, steady-heading sideslips, spiral stability checks, then the pre-stall set-up and recovery drill, and finally the stalls themselves — 1-g clean, full-flap, and power-on. (The last card, accelerated/turning stalls, didn’t get flown before fuel and the warm afternoon said go home — it carries forward.)
The sideslips and spiral stability points were flown and are sitting in the log waiting for their own data reduction — a future post once the numbers are out.
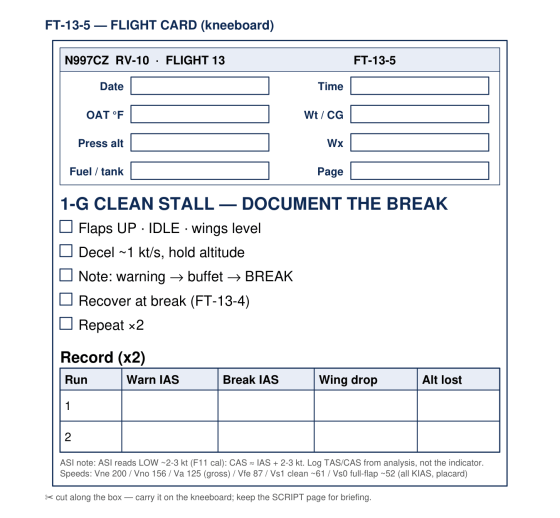
The full 16-page deck — a briefing script page for each card plus a boxed, cut-out kneeboard card for the cockpit — is here: Flight 13 test cards (PDF). Here’s one from the deck, the 1-g clean stall:
The FT-13-5 kneeboard card — 1-g clean stall, document the break.
The Stall Block
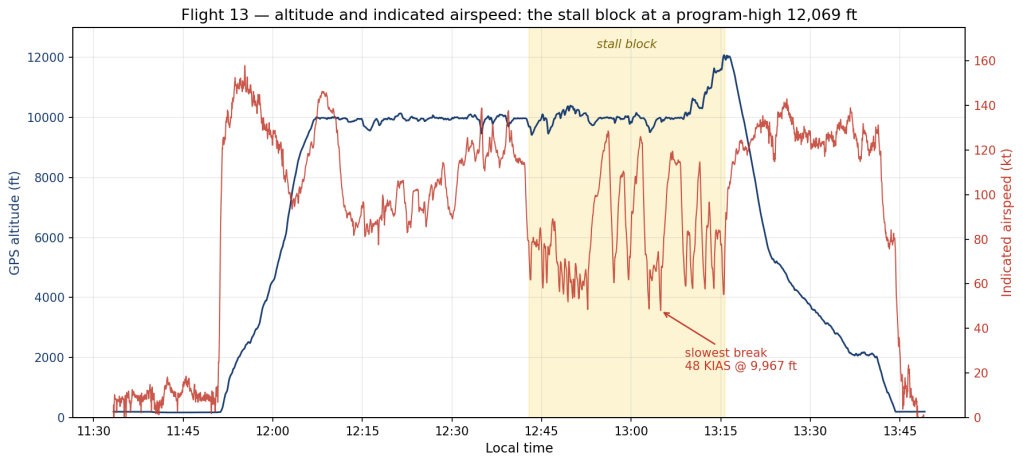
Altitude and indicated airspeed vs time — the shaded block is 33 minutes of stall work, ending with the climb to the program-high 11,520 ft MSL (12,069 ft GPS).
The profile chart shows the structure: climb out of Manassas, stability work around 10,000 feet, then a sustained 33-minute stall block — that dense comb of deceleration spikes in the red trace, each one a deliberate walk down to the break and a recovery. Toward the end of the block the airplane steps up and up, topping out at 11,520 ft MSL (12,069 ft GPS) for the power-on series, then a long descent home.
The headline numbers, all flown solo at light weight:
Series (engine-verified)
Break
Notes
Power-off, early series
52–58 KIAS
idle/low power, ~10,000 ft — likely the clean (flaps-up) cards, per fly order
Power-off, later series
~48 KIAS
three events, 48.0–48.7, idle/low power — likely the full-flap cards, per fly order
Power-on (departure)
55–59 KIAS
16–18″ MAP / ~2,500 RPM, +14 to +18° pitch — verified from engine data
A word on how those rows are labeled, because honesty matters more than tidiness. The flap-position sensor is one of the program’s open squawks — this flight’s log records raw counts from −521 to +9, which is to say, nothing usable — so no row above can claim a data-verified flap setting. What the data does verify is power: the engine channels cleanly separate five power-on breaks (16–18 inches of manifold pressure, 2,500 RPM, nose up +14° or more) from seven power-off breaks at or near idle. The flap attribution rests on the card fly order — the clean stalls were scheduled before the full-flap ones — plus a physics cross-check: flaps lower the stall speed, and sure enough the later power-off series broke a good seven knots slower than the earlier one. Likely, not proven, until the new flap sensor goes in.
The numbers also pass the placard test once you account for weight. The placarded stall speeds at gross are about 61 knots clean and 52 with full flaps; stall speed scales with the square root of weight, and this was one pilot and partial fuel, far below gross. Scale the placard numbers down and you land almost exactly where the airplane did: high-50s breaks for the (likely) clean series, 48 for the (likely) full-flap series. The G-trace adds one more correction — the breaks happened partially unloaded, 0.74–0.88 G, which reads lower still. And through all of it the airplane behaved: buffet warning, a straight-ahead break, conventional recovery, every time.
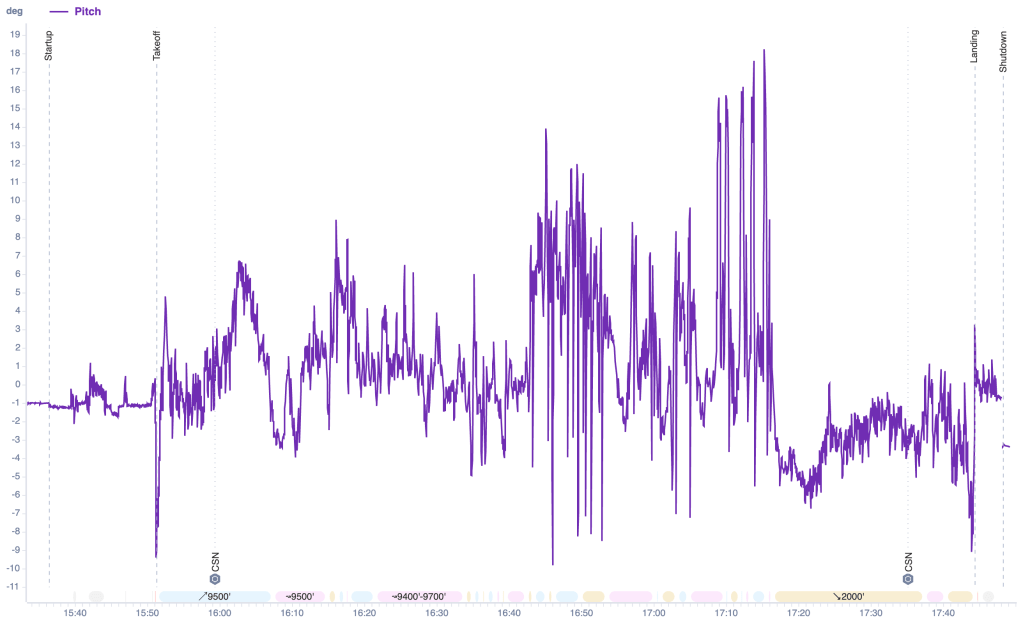
FlySto’s pitch trace makes the hour of stall work visible at a glance — every tooth in that comb is a nose-up walk toward the break and the nose-drop after it, and the tall +14 to +18° peaks late in the block are the power-on series, right on the card’s target attitudes:
FlySto’s pitch chart for Flight 13 — every tooth in the comb is one stall cycle; the +14–18° peaks are the power-on series.
One more layer from Flight 11’s calibration work: at these speeds the airspeed indicator reads about a knot and a half low, so calibrated break speed is closer to 49–50. Every knot of that bookkeeping matters when these numbers eventually set the approach speeds.
Can You See the Buffet in the Data?
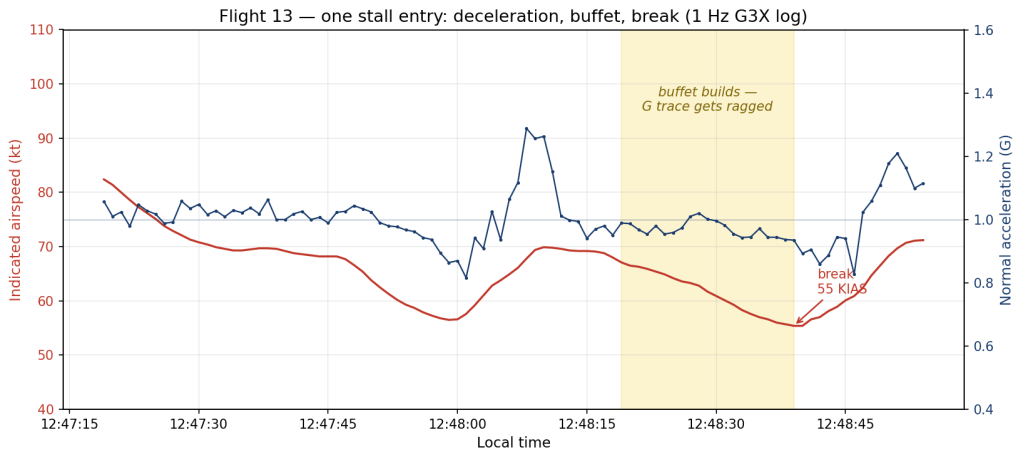
The pre-stall buffet is unmistakable in the seat — the airframe starts talking to you well before the break. A fair question is whether the data logger hears it too. The answer: yes, faintly. The G3X logs at 1 Hz, and real airframe buffet shakes at several cycles per second or more, so the log catches only an aliased, heavily muted echo of what the pilot feels. But it’s there: in eleven of the twelve stall events, the roughness of the normal-acceleration trace climbs to two to five times its smooth-air baseline in the final seconds before the break.
One stall entry from the block — airspeed bleeding down, the G trace fraying in the buffet window, the break, and the recovery.
The chart above is one entry from the block: airspeed bleeding down, the G trace starting to fray in the shaded buffet window, the drop at the break, and the firm recovery pull after. The amplitudes look small — a few hundredths of a G — but remember the sampling: the cockpit experience is a much louder version of what survives into a once-per-second log.
Engine: Leanest Cruise Yet, and a Plot Twist in the CHTs
The mixture story keeps marching: median cruise fuel flow was ~11.5 gph, the leanest of the program — a long way from the 18–23 gph full-rich break-in flights.
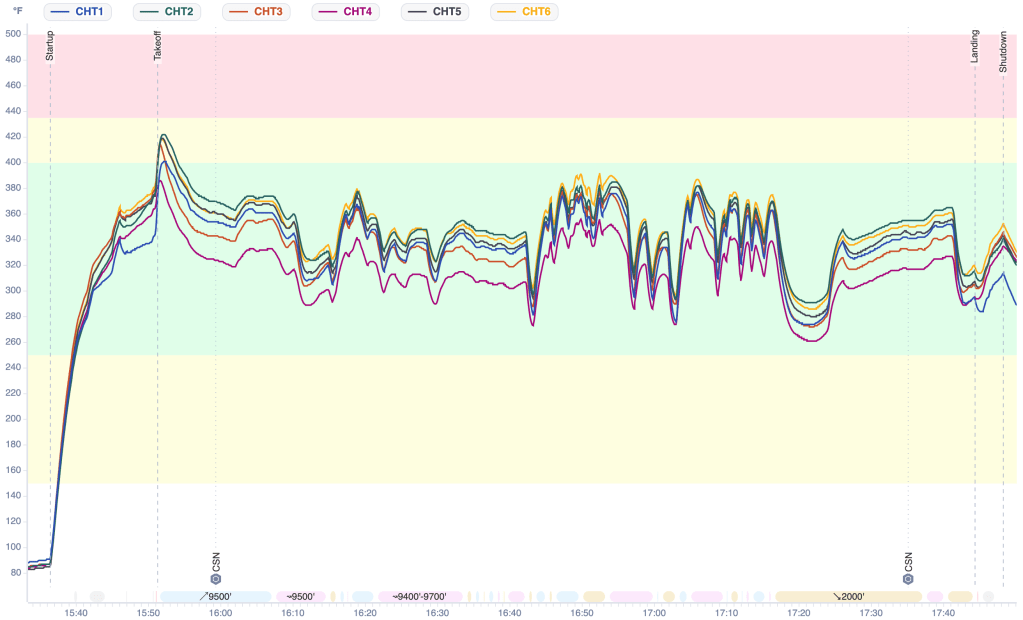
FlySto’s CHT chart for Flight 13 — one climb-out peak brushing the caution band, then a busy green-band sawtooth through the stall work.
The FlySto chart shows the whole flight: one hot moment on the climb-out where the pack peaks just over 420 °F, brushing the caution band, then a busy, healthy green-band sawtooth as the stall work cycles power up and down for an hour. The plot twist is which cylinder topped the chart: cylinder 2 at 422 °F — not cylinder 5, the climb-cooling canary from the last three flights (it logged 419). One warm-day flight isn’t a trend, but the ranking shuffle is noted and goes in the watch file.
The CO Detector Read Zero — Which Is Suspicious
Cabin CO logged 0 ppm for the entire flight. Taken at face value that would be the best result of the program — but every slow-flight-heavy flight from 6 through 12 showed at least a few ppm, and this was the most aggressive high-AoA profile yet. A sensor that suddenly reports perfect silence on exactly the profile that always made it talk is more likely asleep than victorious. Verifying the detector is on the squawk list; until then, this flight’s CO data gets an asterisk, not a trophy.
Also On This Flight
A freshly overhauled attitude unit went into the panel the day before this flight — and through an hour of stalls and high-AoA work, the attitude display never so much as twitched. By my count that makes this the first flight in the airplane’s life with no attitude-horizon tumble — the cross-source roll disagreement that hit ~136° the day before stayed under 10° through all of it, and it has stayed that way since. (The story has a sequel brewing: the #2 attitude source has started miscomparing against the newly healthy #1.) The full saga, and the data behind it, is getting its own post.
Manual flying practice: about an hour of the flight was hand-flown — stall work is hand-flying by definition, and the autopilot got the cruise legs.
Squawks
Accelerated/turning stall card not flown — carried forward to a future sortie.
CO detector read zero all flight — verify it’s actually alive before trusting the result.
Flap position indication still broken — and it stings more on a flight like this one, because it leaves the stall-speed-versus-configuration record resting on the card sequence and pilot recollection instead of data. Replacement sensor is on the parts list.
Bottom Line
Flight 13 closed out the bread-and-butter stall series: power-off breaks walking down from the high 50s to 48 knots indicated as the flaps (most likely) came out, power-on breaks in the high 50s — all of it right where the placard predicts once you do the weight math — honest manners throughout, and a new program-high 11,520 ft MSL (12,069 ft GPS). The engine ran its leanest cruise yet, cylinder 2 stole the hot-cylinder crown for a day, and the CO detector’s perfect silence earned suspicion instead of celebration. One card carries forward, and the stability data is in the can awaiting analysis. The envelope is opening up.
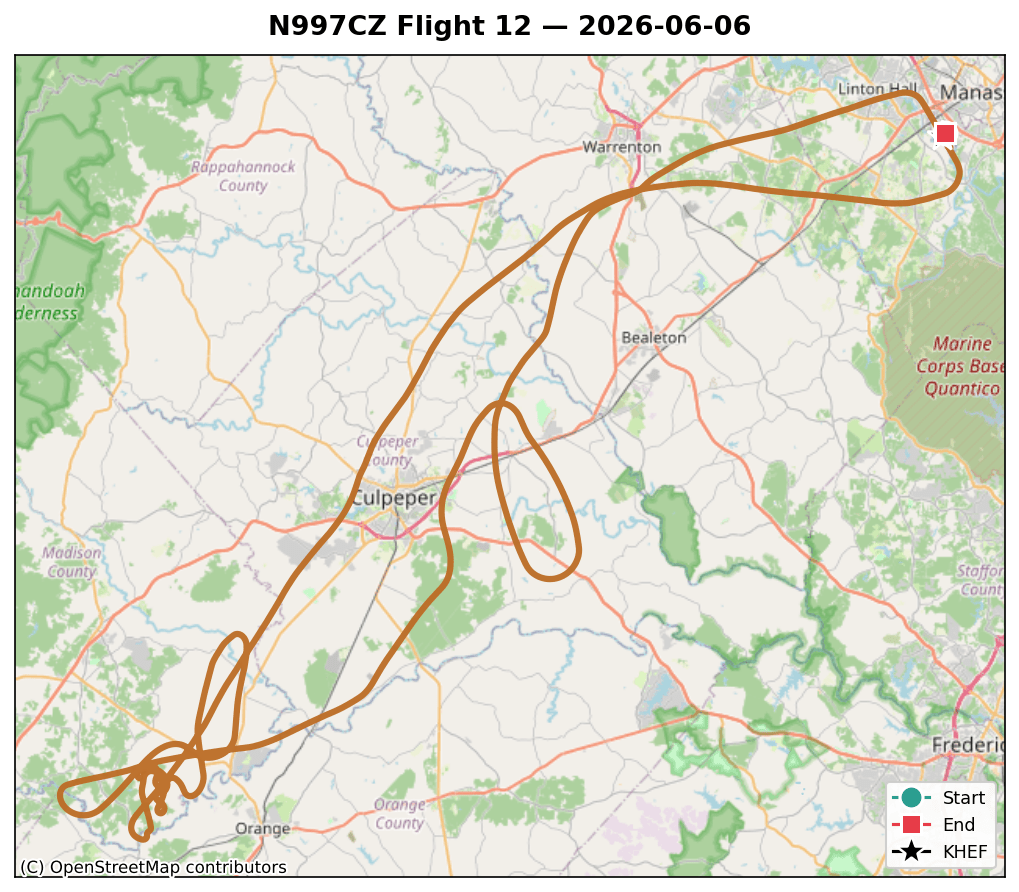
Ground track for Flight 12 over the Phase 1 test area.
Flight 11 was a marathon — two and a half hours of precision circles for the airspeed calibration. Flight 12, six days later, was the opposite kind of flight: shorter, higher, and slower. The plan was to start working through the stability test cards, and the headline act was a slow-flight series flown higher than this airplane had ever been.
The Numbers
Date
2026-06-06
Engine time
~1.5 hr
Distance
156.5 nm (GPS path)
Fuel used
18.5 gal (totalizer)
Engine hours
14.8 → 16.2
Max altitude
~9,090 ft MSL (9,535 ft GPS) — highest of the program (so far)
Cruise OAT
+58 °F (mild morning, ~13 °F warmer than F11)
Autopilot
~94% of airborne time (more on that below)
Config
7 qt oil; burn well under one tank, no tank switch
Climb High, Fly Slow
The idea behind doing slow flight way up high is simple: altitude is recovery margin. If the airplane is going to do something rude at high angle of attack, I’d rather it do it with 9,000 feet underneath me than 3,000.
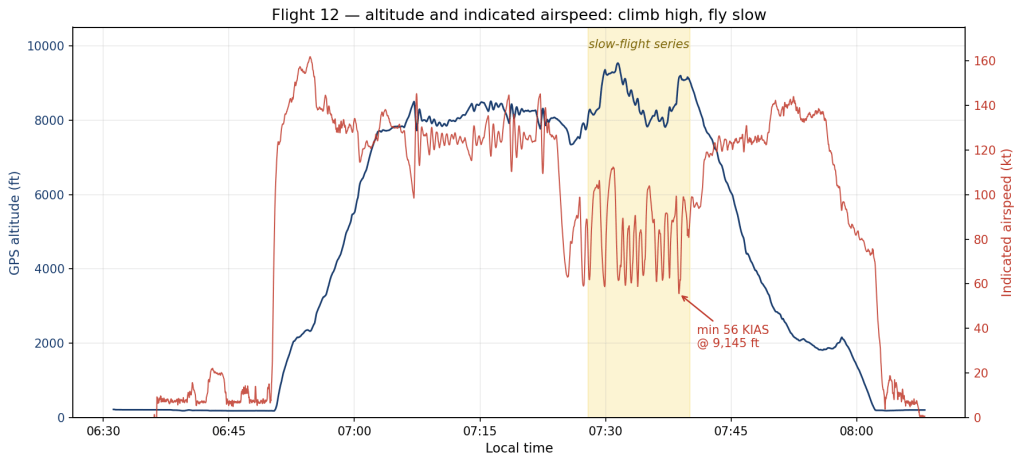
Altitude and indicated airspeed vs time — the shaded block is the slow-flight series at 9,100–9,500 ft.
The profile chart shows the shape of the flight: climb out of Manassas, work in the mid-8,000s, then push up to the program-high 9,090 ft MSL (9,535 ft GPS) and settle into about thirteen minutes of slow-flight work between 9,100 and 9,500 feet. The red trace tells the story — a string of deliberate decelerations, each one walked down slowly, held, and recovered, over and over. The slowest stabilized point was about 56 KIAS at 9,145 feet.
That block wasn’t all straight-ahead slow flight, either. Working down the stability card deck — the FT-12/FT-13 card set is here (PDF) — the points included longitudinal static-stability checks at 55% power (trim the airplane, displace 10 and then 20 knots either side of trim, and watch how it comes back), flaps-up power-off stalls banked both ways at 10°, 20°, and 30° of bank, and a set of power-on stalls at 55% power. The power-on stalls turned out to be the interesting ones — more on that next.
Remember from Flight 11 that the airspeed indicator reads a knot and a half or so low down at these speeds — so true calibrated speed at that 56-knot point was around 58, and true airspeed at that altitude meaningfully higher still. The margins were real, which is the whole point of doing this work upstairs.
The Autopilot Kept Tapping Out
One genuinely interesting system behavior surfaced during the slow-flight series: the G3X autopilot repeatedly dropped offline with a “Fail / Inertial miscompare” annunciation, then re-engaged — about four minutes of dropouts across seventy airborne minutes, and the trigger was specific: the power-on stalls. It wasn’t just the autopilot being cautious, either — the attitude horizon itself tumbled several times during those stalls. In the data, the disagreement between attitude sources reached roughly 136° of roll — the worst cross-source split of the entire program. Outside the high-AoA block the autopilot was rock solid; it flew about 94% of the airborne time.
“Inertial miscompare” doesn’t mean the system knows which attitude source is lying. Per the G3X installation manual, data from the two ADAHRS units is continuously cross-compared and a disagreement is simply annunciated — the system flags the mismatch and lets the pilot sort it out. (Interestingly, the G5 standby only joins the comparison if the system has degraded to a single ADAHRS, so there’s no three-way vote while both primary units are alive.) Figuring out which unit is actually bad happens one level down: each ADAHRS runs its own internal integrity monitoring, and a unit that loses confidence in its own solution drops it and re-aligns — at which point the system switches over to the survivor. Long-time readers will recognize this as the ADAHRS-deviation theme that’s been running since the first five flights — it gets provoked by exactly this kind of high-AoA, low-airspeed maneuvering. The decision coming out of this flight’s debrief: change out AHRS #1 and see what the data says. The replacement unit went into the panel that same day. That story deserves its own post.
Carbon Monoxide: Best Slow-Flight Result Yet
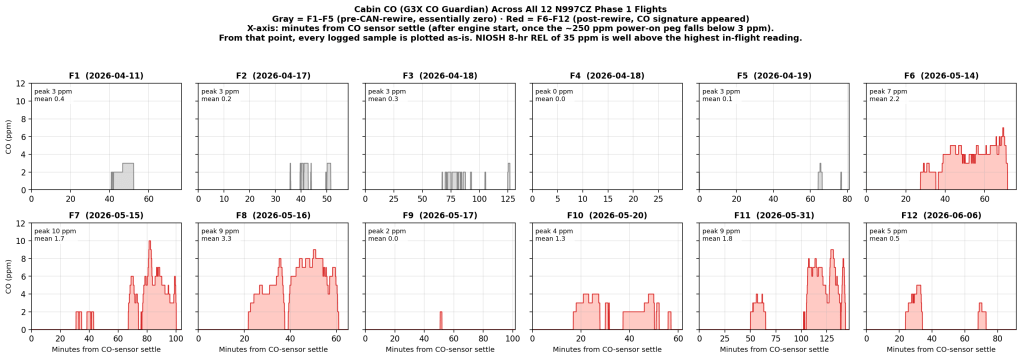
This one is encouraging. Every slow-flight-heavy flight since the CO detector went in has shown cabin CO in the 5–10 ppm range, consistent with the firewall heat-door leak theory. Flight 12 was the most slow-flight-intensive profile yet — and CO stayed benign: peak 5 ppm, mean 0.5.
Cabin CO across all twelve flights — Flight 12 is the cleanest slow-flight result since the detector went in.
Two honest caveats. First, the log shows a scary-looking 250 ppm spike — that’s the CO detector’s power-up warmup transient, recorded in the first ~50 seconds on the ground with the engine off, decaying steadily as the sensor warms. It’s a self-test artifact, not cabin air. (The trend script now auto-discards it.) Second, since I still haven’t flown the deliberate tape-the-heat-doors test, a quiet flight doesn’t tell me the leak is fixed — just that this profile, on this cool morning, didn’t pull much exhaust in. The isolation test stays on the list.
The Cylinder 5 Canary: Holding, Not Climbing
The air-dam saga continues, with a hopeful data point. Recap: before Flight 10 I removed the cooling air dam in front of cylinder 1, which fixed #1’s chronic heat but started costing cylinder 5 in the climb — its temperature-adjusted peak climb CHT marched 401 → 410 → 427 °F across Flights 9–11.
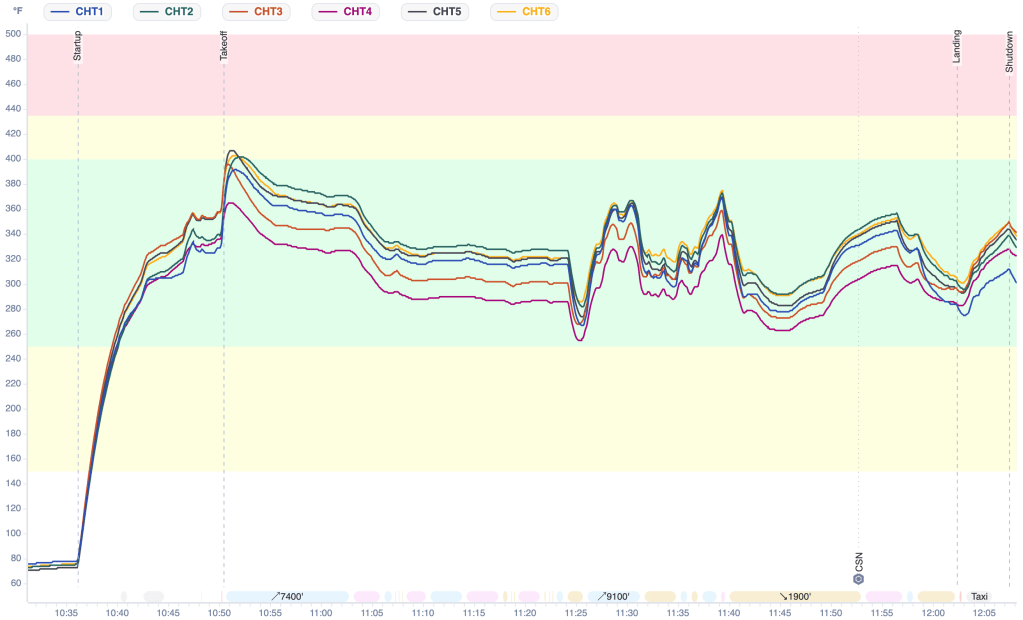
FlySto’s CHT chart for Flight 12 — all six cylinders (raw temps) with the comfort bands painted behind them.
Here’s the whole flight at a glance, as FlySto renders it from the G3X log — all six cylinders, raw temperatures, with the comfort bands painted behind them. The climb-out spike just after takeoff is the hot moment of the flight, topping out around 407 °F, and everything spends the rest of the sortie comfortably in the green. You can even see the slow-flight series as that choppy stretch in the middle, and the brief dip to ~260 °F right before it — the power-off deceleration entries.
Flight 12: 408 °F. Still the hottest cylinder in the climb, but it fell back to roughly the Flight-10 level instead of continuing to rise — helped, no doubt, by climbing into cooler air up high. Meanwhile cylinder 1 keeps enjoying its freedom: coolest jug on the engine, with cruise temperatures (OAT-adjusted) down around 327 °F. Cruise CHTs across the board were the lowest of the program — the reward for flying high in cool air. Verdict: the canary is alive but still in the mine. Watching.
Fuel: The Totalizer Earns Its Keep Again
A small satisfying footnote. The totalizer said the flight burned 18.5 gallons; the fuel truck that topped the airplane off twenty minutes after shutdown delivered 18.30 gallons. That’s agreement to 0.2 gal, and it keeps the program-long truck-versus-totalizer reconciliation within a fraction of a gallon. The fuel-flow system has earned trust the fuel-quantity gauges haven’t (the right float is still stuck — see squawks).
Cruise mixture ran richer than Flight 11 — about 15.5 gph against 14.5 — mostly because I spent the flight flying maneuvers instead of babysitting the red lever.
Squawks
Flap position sensor broke again — the May 31 workaround (remounting the worn pot to ride the healthy end of its range) didn’t hold, and this time the failure ran the other way: it wouldn’t let the flaps come up. On Flight 11 the same sensor had refused to put them down, forcing a no-flap landing. Two flights, two opposite refusals — enough. The fix chosen: reconfigure the VP-X so the flap switch works as momentary — hold the switch and the flaps drive up or down, no listening to the position sensor at all. (Since completed, with Dan’s laptop hooked to the VP-X.) The replacement for the 20-year-old Ray Allen pot stays on the parts list.
VP-X pitch and roll trim speeds need to come down — trim runs too fast.
AHRS attitude tumble / inertial miscompare under the power-on stalls — see above; next step chosen: swap AHRS #1.
Right fuel-quantity float still stuck (known item; totalizer is the authority).
Heat-door CO isolation test still not flown — benign CO this flight is encouraging but inconclusive.
And two items came off the list before this flight, in a Friday repair session: the upside-down left magneto switch from the Flight 11 squawks, and the remaining flap close-out work.
Bottom Line
Flight 12 took the airplane higher than it had ever been and slower than it usually flies, in the same thirteen minutes. The slow-flight handling was honest, the CO behaved, the cylinder 5 canary stopped climbing, and the totalizer matched the fuel truck to a couple tenths. The one system that complained — the autopilot’s inertial miscompare under high AoA — is the same attitude-source thread this airplane has been tugging since flight one, and it was about to get a lot more attention.
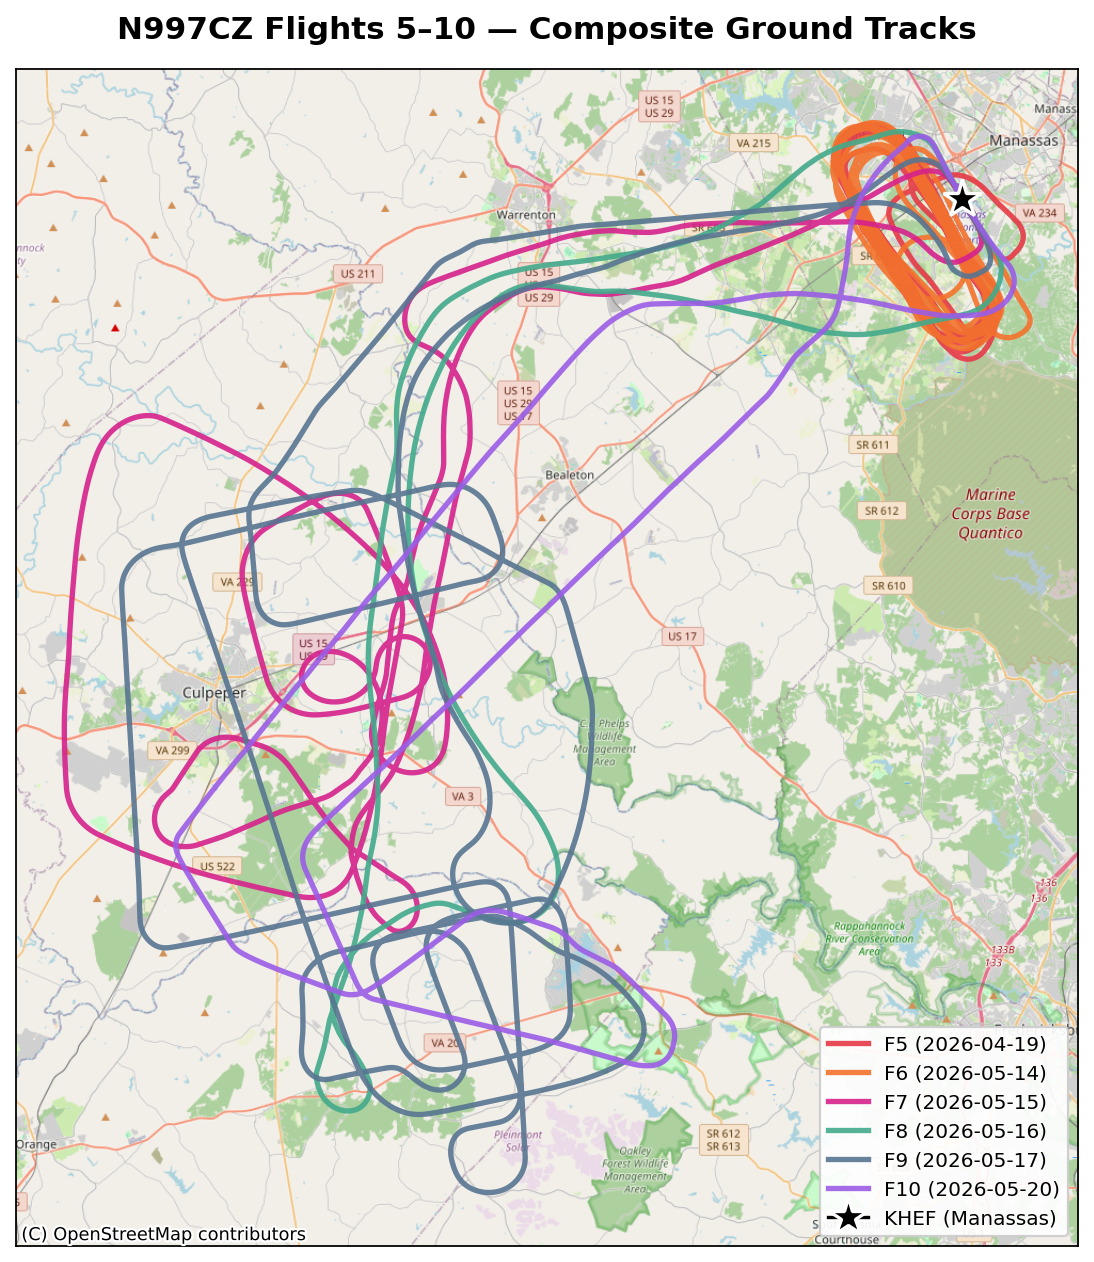
Composite ground tracks for N997CZ Flights 5 through 10 — KHEF marked with a star, each flight color-coded.
I owe the blog about six flights. Some of that is because I’ve been heads-down on the actual flying, some because every flight in this stretch turned up at least one new thing worth investigating, and some because the bigger investigations — the CAN bus rewire, the AHRS situation, the CHT data — kept demanding their own dedicated posts.
So rather than try to retroactively write six separate Flight N posts, here’s a single catch-up running from Flight 5 through Flight 10, hitting the headline from each. The dedicated deep-dive posts cover the analysis side; this is the chronology.
The Numbers
Flt
Date
Flt hrs
Cycles
Fuel (gal)
Dist (nm)
Total hrs
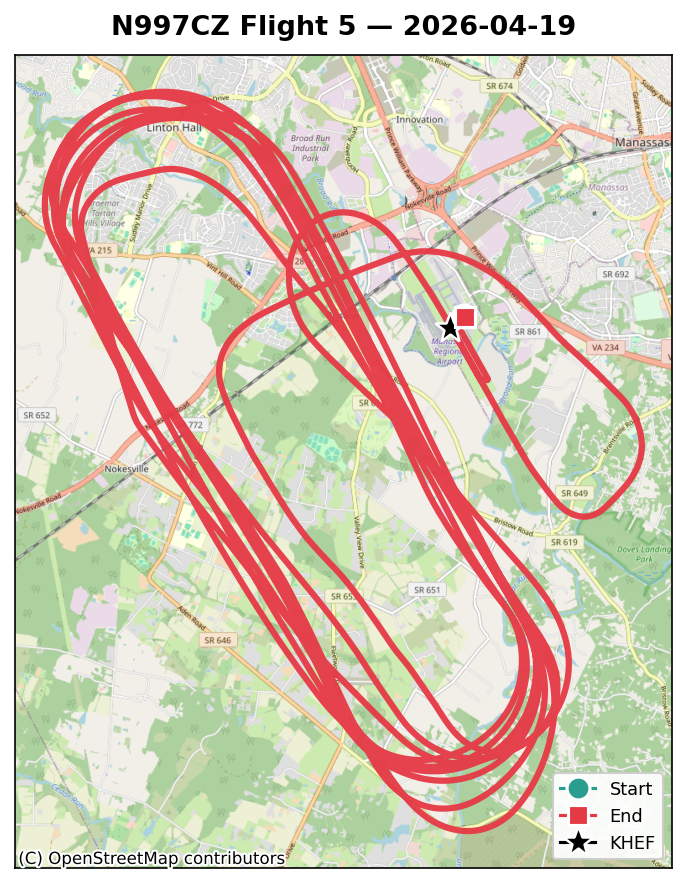
5
2026-04-19
1.4
4
21.3
155.3
6.0
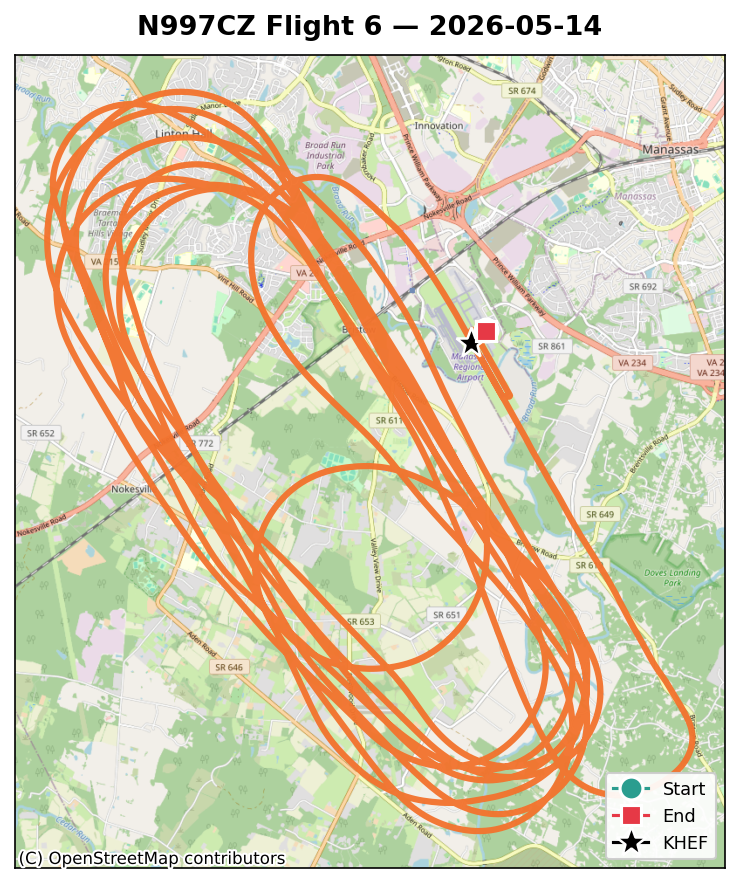
6
2026-05-14
1.3
5
19.1
149.1
7.4
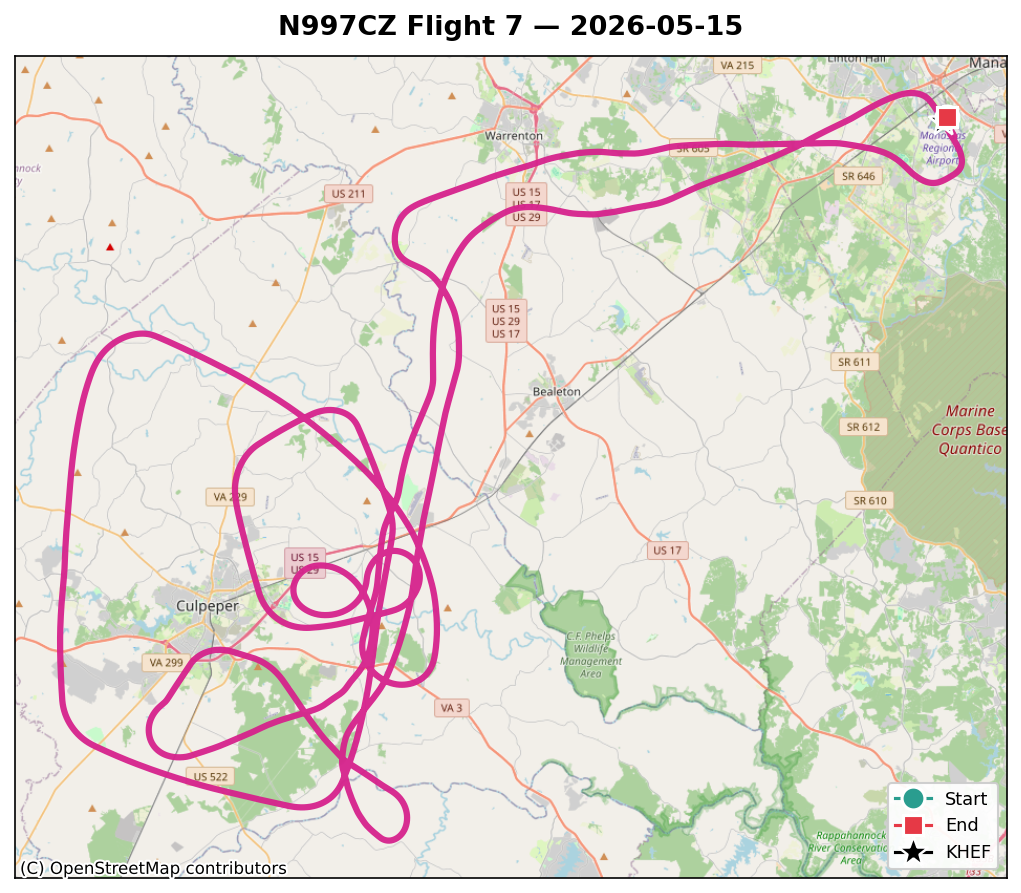
7
2026-05-15
1.7
6
19.4
169.3
8.9
8
2026-05-16
1.1
7
12.0
96.6
9.8
9
2026-05-17
1.7
8
23.3
230.1
11.4
10
2026-05-20
1.0
8
11.7
104.2
12.4
Eight engine hours of additional flight time across six flights. About 900 nautical miles flown. ~107 gallons burned. From ~6 engine hours coming into this batch to ~12.4 out of it. Phase 1 on this airplane is a flight-test-card program, not a fixed-hours one — we work through the required test cards rather than counting down to a hard hours limit — but the experimental Lycoming IO-540 with the SDS electronic ignition would put a 40-hour floor on Phase 1 even if we were counting hours. So 12.4 engine hours is early in the program, not midway.
Flight 5 — April 19. The Last Flight of “Phase 1A.”
1.4 engine hours · 21.3 gal · 155 nm.
Flight 5 — local pattern work near KHEF.
Flight 5 was a per-cylinder CHT survey at altitude — methodical, mostly uneventful, and the last flight in what I now think of as Phase 1A: the batch of early flights that locked in the questions we’d spend the next month answering. I used roughly 13 gallons out of the left tank and landed needing a top-up — a fine reminder that I needed to start trusting the totalizer more and the gauges less.
The other thing F5 made clear was that the ADAHRS deviation problem was real and reproducible, not a Flight 1 fluke. PFD #1 tumbled on the takeoff roll, percentage-deviation values were spiking high, and the pattern matched the four flights before it. Time to stop flying and start fixing.
The Maintenance Gap — April 19 to May 14
Twenty-five days on the ground for what turned out to be three separate jobs:
CAN bus rewire — completed May 13. The Garmin G3X harness was both over-length (~96.5 ft total vs Garmin’s 66 ft max) and built with the wrong wire (standard aircraft shielded twisted pair instead of 120 Ω spec cable). New harness: 57.7 ft of Carlisle IT CAN24TST120(CIT). Full writeup is here.
Dynamic prop balance — went from 0.57 IPS down to 0.01 IPS. That’s a ~57× reduction. The engine cowl is now noticeably calmer in the air.
Left fuel-gauge float reoriented — the left tank gauge had been reading frozen high since first fueling. Root cause turned out to be the float-arm wire positioning the float too close to the tank’s interior ribs / baffle, where it would get physically stuck. The 2025 Van’s plans update shows a different way to bend the float-arm wire that orients the float more laterally and gives it more clearance to move up and down. Implementing that new bend pattern appears to have fixed it — the left gauge now tracks correctly through the readable band. (Full write-up to follow in a future post.) The right-side gauge is still stuck up (same root cause suspected, same fix likely needed), still on the to-do list.
Three problems addressed, one bench-flight worth of confidence restored, and we were back at the runway.
Flight 6 — May 14. First Flight Back, and a Surprise.
1.3 engine hours · 19.1 gal · 149 nm.
Flight 6 — low, slow shakedown after the CAN-bus rewire.
F6 was deliberately a low, slow shakedown — peak ~2,070 ft, just enough to verify everything still worked after a month of wrenching. The CAN bus data was immediately, dramatically clean (zero protocol errors across the whole flight; pre-rewire flights had several hundred Bus-Off events apiece). That part was a win.
The surprise was carbon monoxide. The G3X CO Guardian had read essentially zero on every one of Flights 1 through 5. On Flight 6, with nothing changed about the engine, exhaust, or cabin sealing other than the avionics rewire, cabin CO peaked at about 7 ppm. Not alarming in absolute terms — the working alarm threshold is around 35 ppm — but a new signature that hadn’t been there before. The leading suspect, which I’ll come back to in a future post, is the firewall heat doors not seating fully closed.
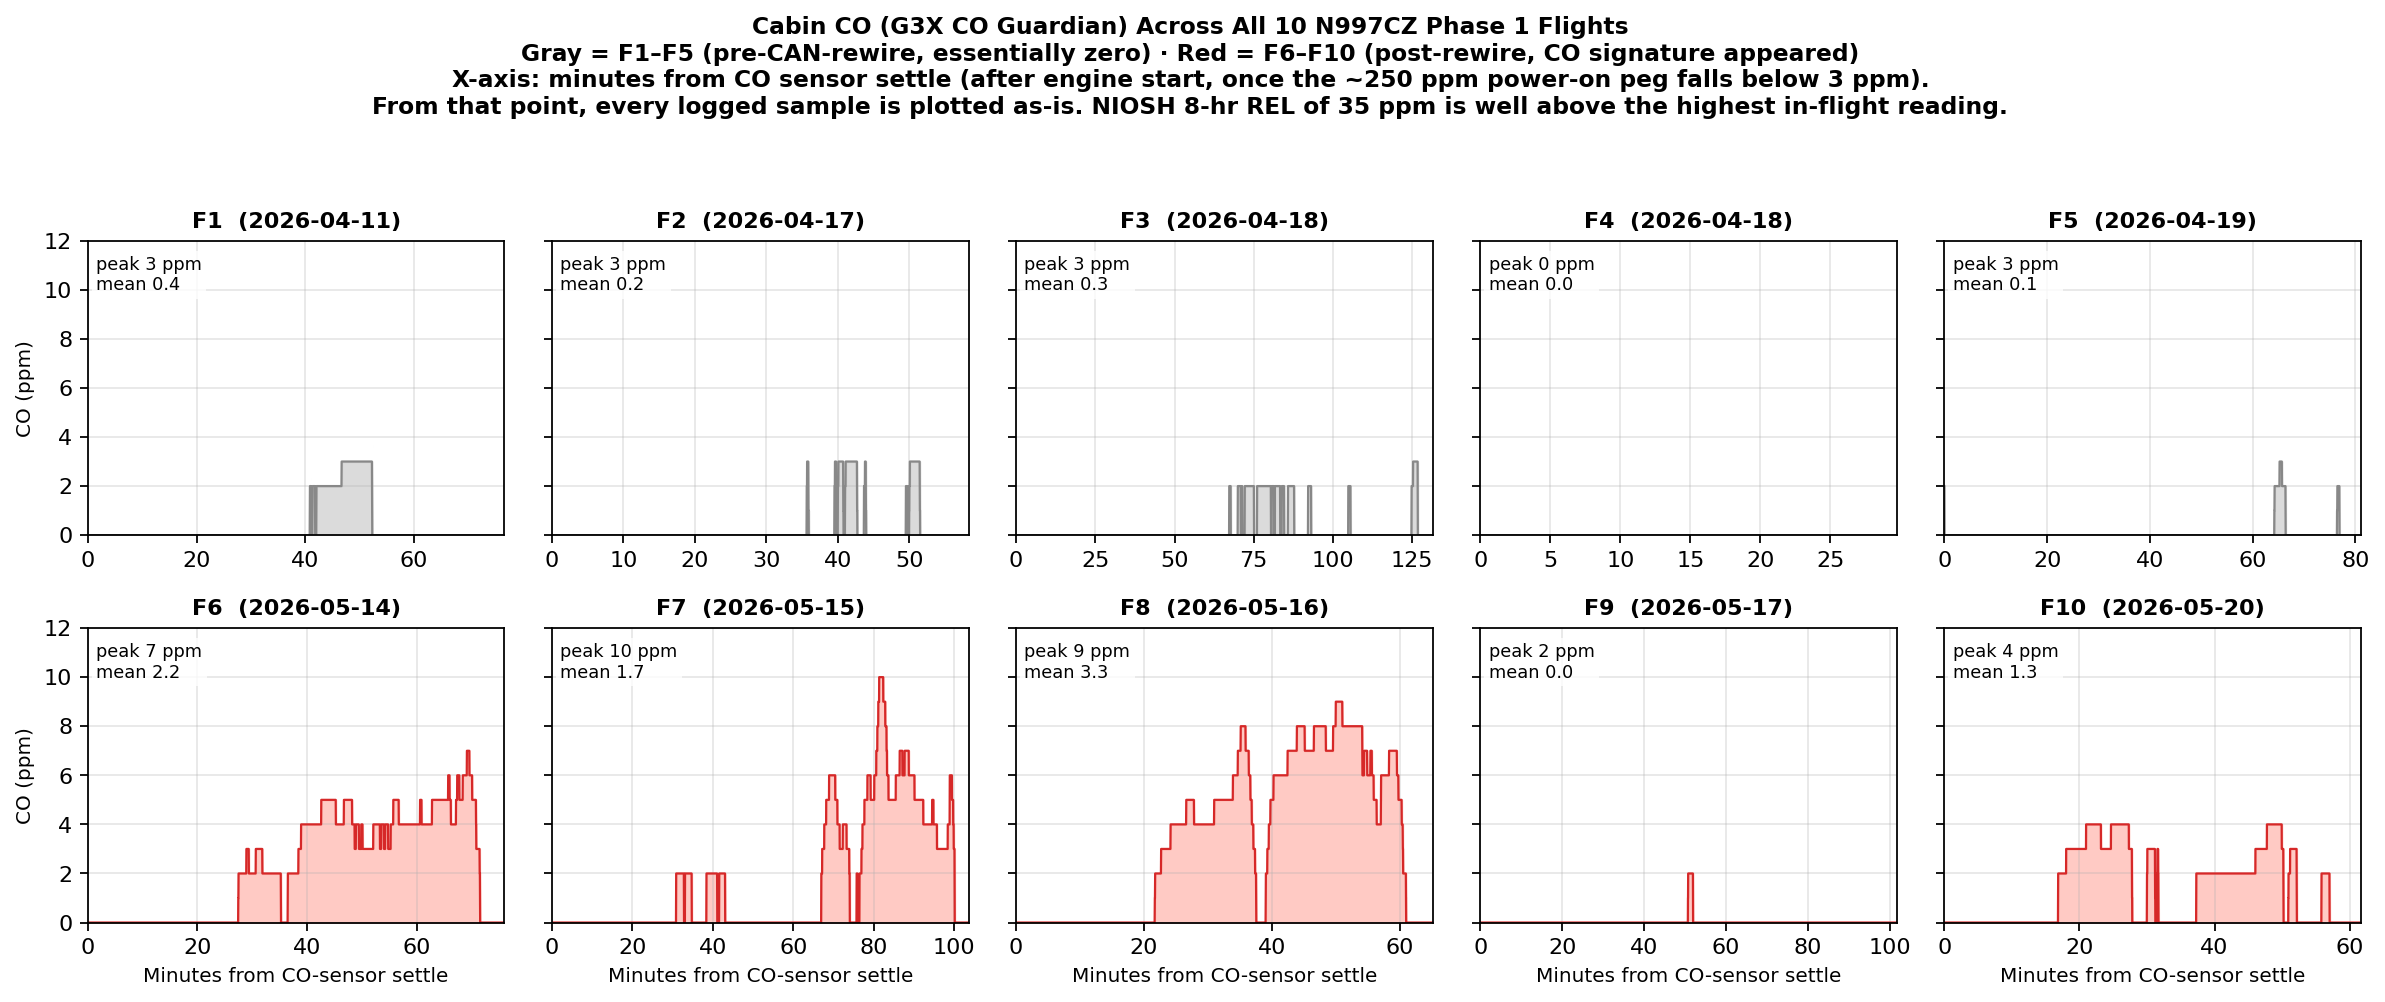
For context on what those PPM numbers mean as the values climb on later flights, here’s the standard CO exposure scale:
CO symptoms by PPM level (image courtesy TFT Pneumatic).
And here’s what the G3X CO Guardian actually measured in the cabin across all ten flights:
Cabin CO across all 10 N997CZ flights. Gray = F1–F5 (pre-CAN-rewire, essentially zero). Red = F6–F10 (post-rewire, CO signature appeared). NIOSH 35 ppm REL is well above any reading shown.
The story the chart tells: nothing on F1 through F5 (a few 1–3 ppm blips, mean below 0.5), then a clear new pattern starting at F6, peaking at 10 ppm on F7 during the slow-flight stalls and at 9 ppm on F8 with the wing roots taped. F9 looks essentially clean — but it was a benign autopilot-tuning profile. F10 is back to small numbers under a short, more aggressive profile.
Flight 7 — May 15. Out of the Pattern. First Stalls. First Airspeed Cal.
1.7 engine hours · 19.4 gal · 169 nm.
Flight 7 — first push west toward the Casanova / Culpeper practice area.
Flight 7 was the first time I really left the immediate KHEF area. Climbed to about 8,800 ft west of the field and ran a clean-configuration stall series at light forward CG: about 1 kt per second deceleration, minimum airspeed ~58 KIAS before heavy buffet, no clean nose break yet. Wing roots were still bare (the wing-root grommet seal had been a contender for the CO source at this point) and cabin CO peaked at 10 ppm during the slow-flight portion of the flight — confirming that whatever was leaking was somehow correlated with high angle of attack or low airspeed, not just temperature.
Flight 7 also gave me a clean airspeed-calibration dataset I hadn’t planned on. Over about 22 minutes at ~7,000 ft and ~148 KIAS, I’d flown a mix of straightish legs and curving legs while working other test cards — not a single deliberate 360° turn, just a happy combination of headings that, taken together, ended up giving the GPS ground-speed vector enough azimuth coverage to support the GPS circle method. With 1,336 samples spread across the full compass and a circle-fit RMS of 2.4 kt, the result said the pitot-static system is essentially clean in cruise — position error +0.9 kt at ~148 KIAS. One cal point in the books; more to come at other airspeeds.
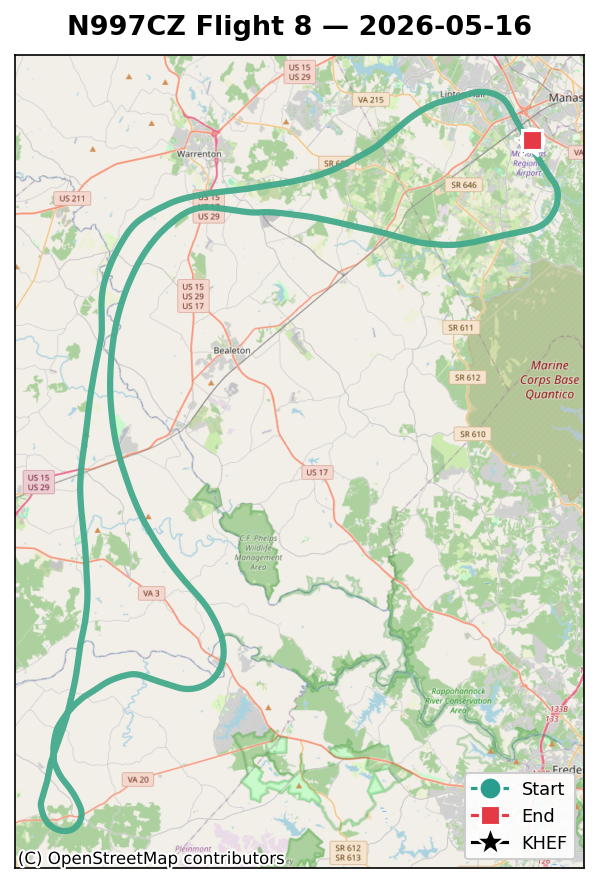
Flight 8 — May 16. Aggressive Stalls, and the Autopilot Wants to Dive.
1.1 engine hours · 12.0 gal · 97 nm.
Flight 8 — back to the practice area for deeper stalls and the first autopilot engagement.
I went back up to ~8,500 ft on F8 with more aggressive intentions: deeper stalls, more flap deployment, slower minimum airspeeds. Minimum logged IAS was 45.9 kt at about 7,900 ft, which is well into the “we’re not in the certified envelope anymore” territory and exactly what Phase 1 is for. Wing roots were taped on this flight to test the wing-root-as-CO-source theory.
Cabin CO peaked at 9 ppm anyway — actually with the highest mean CO reading of any flight to date. Wing roots, ruled out. The leading edge of the diagnosis shifted to the firewall heat doors. (More to come in a dedicated CO post; the investigation is still active.)
And then there was the autopilot. First time I engaged the AP in this airplane, it commanded a nose dive. Pitch channel sense was reversed — the AP was simply trying to hold pitch level, but with the servo direction wired backwards every correction it made was the wrong one, so it just kept pushing the nose over into a dive. We disengaged immediately, hand-flew the rest of the flight, and changed the G3X pitch servo direction from “normal” to “reversed” on the ground after landing. Configuration error, not a hardware failure, but a useful reminder of why we test these things at altitude before relying on them.
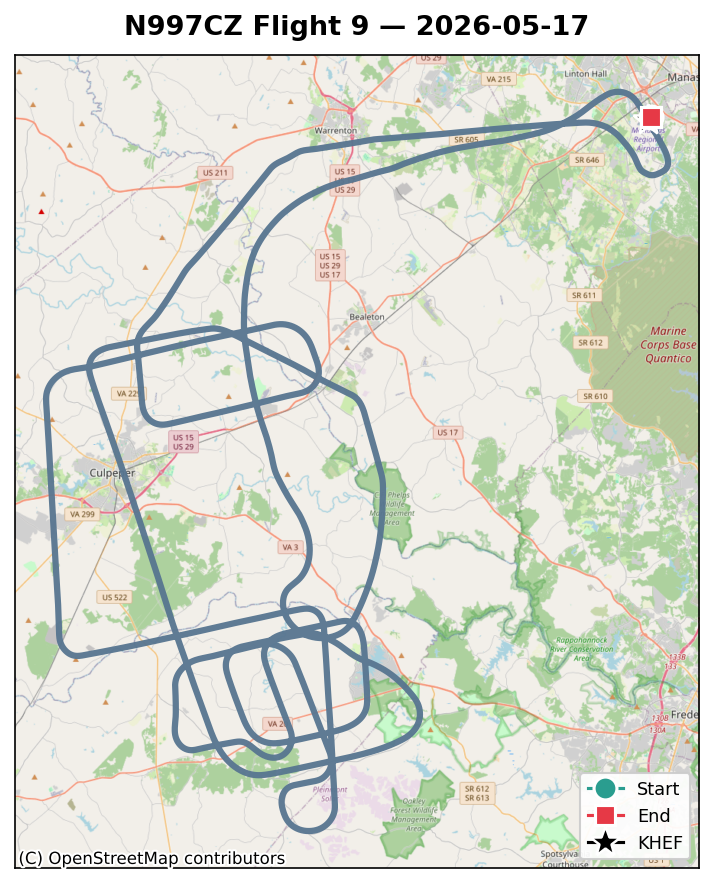
Flight 9 — May 17. Autopilot Tuning. And a Visit From an Old Friend.
1.7 engine hours · 23.3 gal · 230 nm.
Flight 9 — autopilot tuning west of Casanova / Culpeper. Includes the air-to-air rendezvous.
F9 was an autopilot tuning flight: 1.7 hours, max GPS altitude ~9,100 ft, mostly hand-flown to get up to altitude and then about 60% of the cruise samples on the autopilot. Confirmed the pitch-reversal fix from F8 — the AP now correctly climbs when it wants to climb. Worked the roll gain from 0.5 up to 0.7 and back to a settled 0.6, with the roll servo max torque bumped from 15% to about 40%. Roll axis is now tracking well; pitch tuning is up next.
The fun part of F9 was the air-to-air. Harry T and Bob H (Bob’s Cessna N8EM, “8 Echo Mike”) took off about 15 minutes behind me and joined up in the practice area west of Casanova / Culpeper. I worked at about 8,500 ft, they worked at about 3,000 ft, and we relayed live updates on the AP tuning progress on the air-to-air “fingers” frequency, 123.45 MHz. Visual contact. First time flying N997CZ alongside Bob’s airplane. The kind of flight where the data takes a backseat to the smile.
Two data-related notes from F9: cabin CO was essentially zero for the whole flight (the profile was too benign for the AoA-correlated leak signature to express itself, but worth logging). And the 11 autopilot-stabilized wings-level legs at ~8,500 ft / ~145 KIAS that came out of the tuning work happened to produce a perfect second airspeed-calibration data point: position error +0.5 kt, matching the F7 GPS-circle result almost exactly. Two cal points, two methods, two days apart — the pitot-static system is clean in cruise.
Full airspeed-calibration writeup — methodology (constant-IAS GPS circle, multi-leg wind triangle), per-leg data tables, and the F7/F9 cross-validation — is available as a PDF download below.
F9 was also the first confirmed mid-flight tank switch. Post-flight refueling receipt was 22.1 gal vs totalizer 23.3 gal (1.2 gal / 5% — within fuel-flow calibration tolerance), with the right tank taking about 8–9 gallons. Working tank split for this flight: ~13.5 L / ~8.5 R.
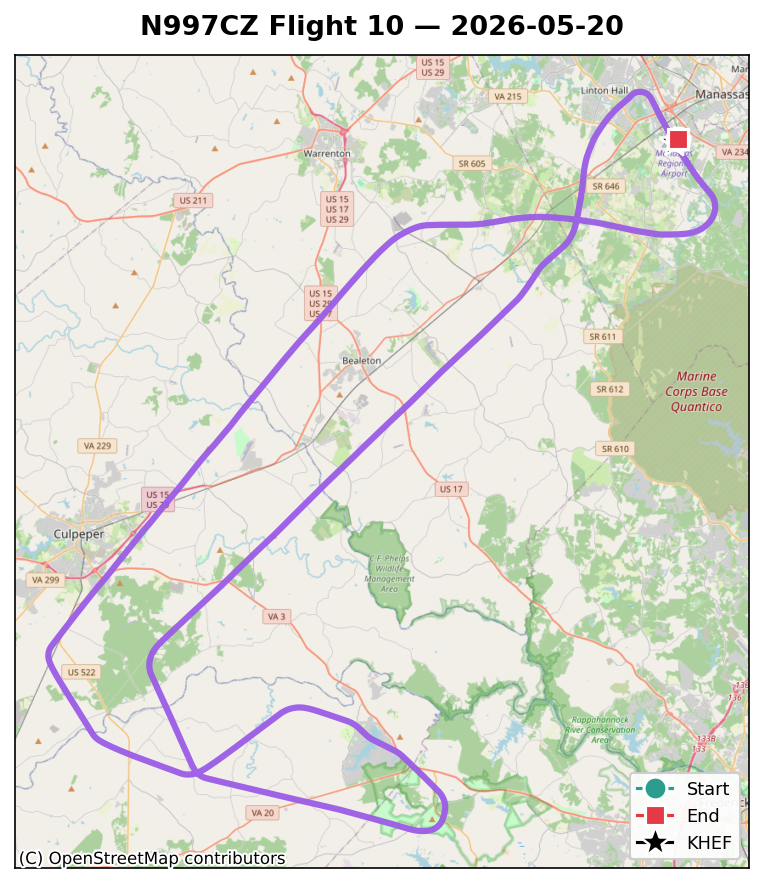
Flight 10 — May 20. The First Configuration Change.
1.0 engine hours · 11.7 gal · 104 nm.
Flight 10 — air-dam-removal test. Max GPS altitude ~11,080 ft, a new high for N997CZ.
F10 was the first deliberate configuration change to the airframe since the maintenance gap. The Cyl 1 front air dam was removed before the flight to see whether more cooling air would lower Cyl 1’s persistently-hottest CHTs (and at what cost to the cylinders downstream of it). About an hour of engine time, max GPS altitude ~11,080 ft (a new high for this airplane), warm day with cruise OAT around 71 °F.
I’ll be honest: I didn’t check the weather before this one. It was a beautiful blue-sky day with a few white puffballs of fair-weather cumulus, and I was preoccupied with the air-dam mod. Departing Manassas to the west I could see some thunderstorm activity well to the north — at the time it looked like it was on the far side of Dulles, possibly out near Leesburg, and based on that I felt comfortable climbing west and away from it to do the test profile.
Up at 10,000–11,000 ft and turned around looking back east, the situation had changed. The storm had organized and was starting to encroach on Dulles and the corridor between Dulles and Manassas. Decision time was easy: hightail it home. I came back to Manassas and they had me land from the north to the south with the thunderstorm just behind my tail. Wheels down, taxi clear, into the chocks, shut down, debrief in the cockpit — all of that with the sky behind me turning increasingly serious.
Maybe one or two minutes after engine shutdown I opened the cabin door. The gust front hit exactly then. It took everything Harry and I had between us to keep the cabin door from being ripped off the hinges by the wind, and then it took everything we had to push the airplane back into the hangar against the gusts. The RV-7’s tow bar lives in the other hangar; we made it work, but N997CZ needs its own tow bar. Added to the parts list.
Headline result of the actual test, OAT-adjusted, F9 → F10: Cyl 1 max CHT dropped 33 °F. About 23 °F of that drop is attributable to the air-dam change beyond the cooling the other cylinders got on the same flight. Strong, clean signal. The downside, also predicted: Cyl 5 max went UP +9 °F — that’s the rear cylinder on the right bank, downstream of the redirected airflow. It’s a “canary” reading on whether the air dam was protecting Cyl 5’s climb cooling. F11 will tell us whether F10 was noise on a small sample, or whether we need a partial air dam to keep Cyl 5 happy.
Full CHT trend analysis across all 10 flights is its own dedicated post (the short version: the cylinder ranking has held invariant across all 10 flights, real break-in is visible in the climb maxes but essentially absent in cruise, and I was leaning too early per Lycoming’s SI 1427C).
Where We Are Now
12.4 engine hours in, with plenty of Phase 1 test cards still to fly. The headline open items going into F11 and beyond:
AHRS still tumbling on the takeoff roll every flight. CAN bus is clean, vibration is essentially eliminated (0.01 IPS), so the GSU 25C hardware itself is the leading suspect. I’ve just sent Garmin a fresh writeup closing the loop on the CAN bus rewire result and the prop balance result, alongside a 10-flight analysis showing the AHRS tumble pattern is identical before and after both fixes — and asked them once again about Service Bulletin SB 2144 and the potential need to swap or recall the two GSU 25C units on N997CZ. Waiting to hear back.
Cabin CO investigation continues. Firewall heat doors are the leading hypothesis; tape-test still to fly.
Cyl 5 climb cooling — F11 will tell us whether the air-dam removal was a free win or whether we owe Cyl 5 a partial fix.
Airspeed calibration at slow-flight speeds (~80, 100, 120 KIAS) — only the cruise point has been mapped so far.
Right fuel-tank float still stuck up. To-do.
Pitch autopilot tuning — roll is settled; pitch gains are next.
Flight 5 dedicated post — never going to happen at this point; consider this paragraph the substitute.
Next post will probably be the CO investigation, depending on which one closes out first. As always, thanks for following along.