Every flight test program has a day where you stop sneaking up on the stall and just go fly it. For N997CZ, that was Flight 13. The slow flight and first banked stalls on Flight 12 had shown the airplane was honest at high angle of attack; this flight was about systematically documenting where the wing quits — clean, with flaps, and with power on — and doing all of it with a lot of sky underneath.
It was also the flight that finally set the airplane free of round numbers: a new program-high altitude of 11,520 ft MSL (12,069 ft GPS).
The Numbers
| Date | 2026-06-07 |
| Engine time | ~2.2 hr |
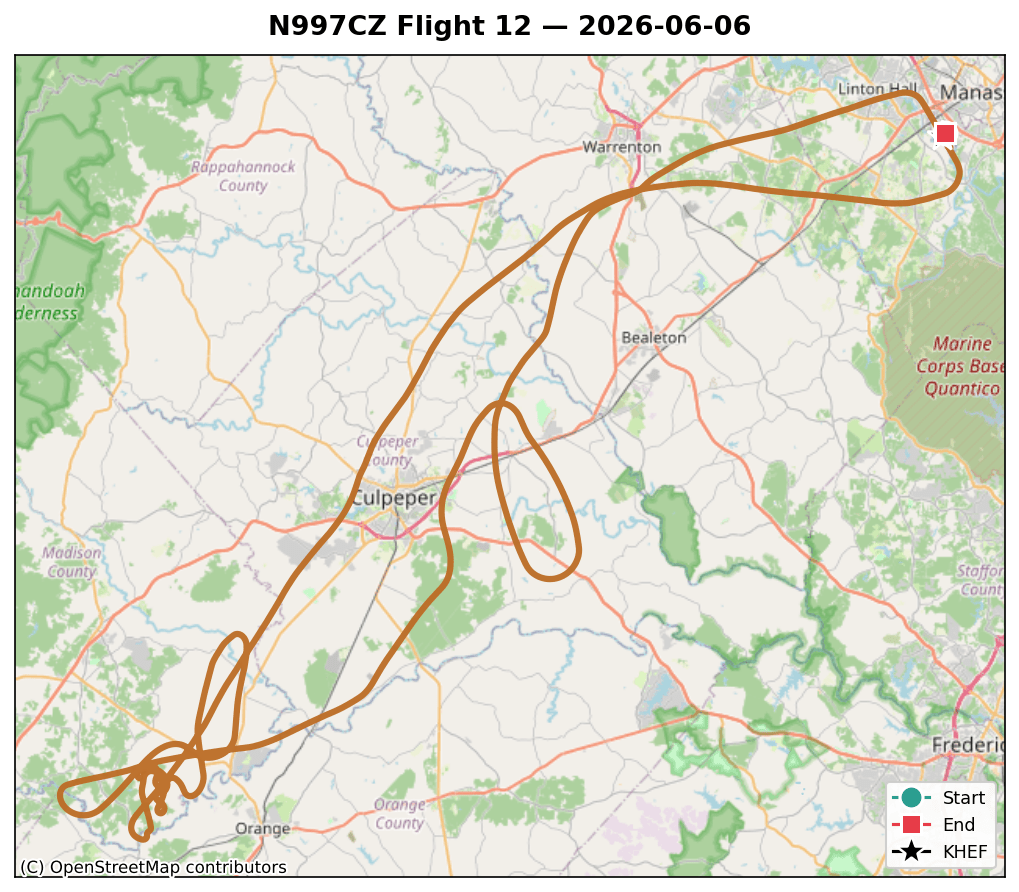
| Distance | 233.3 nm (GPS path) |
| Fuel used | 24.1 gal (totalizer) |
| Engine hours | 16.2 → 18.3 |
| Max altitude | ~11,520 ft MSL (12,069 ft GPS) — new program high |
| Cruise OAT | +67 °F (warm day) |
| Loading | solo, light weight |
| Cruise mixture | leanest yet — ~11.5 gph |
The Card Deck
Flight 12 only got partway through the stability cards before the slow-flight work used up the morning, so this flight’s deck rolled the leftovers in with the stall series — eight cards in fly order: area set-up, steady-heading sideslips, spiral stability checks, then the pre-stall set-up and recovery drill, and finally the stalls themselves — 1-g clean, full-flap, and power-on. (The last card, accelerated/turning stalls, didn’t get flown before fuel and the warm afternoon said go home — it carries forward.)
The sideslips and spiral stability points were flown and are sitting in the log waiting for their own data reduction — a future post once the numbers are out.
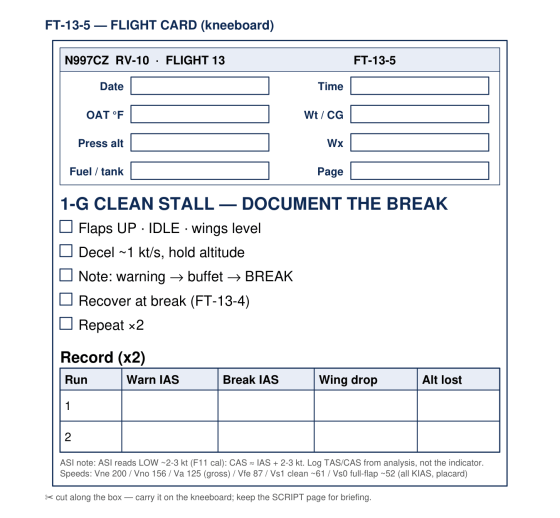
The full 16-page deck — a briefing script page for each card plus a boxed, cut-out kneeboard card for the cockpit — is here: Flight 13 test cards (PDF). Here’s one from the deck, the 1-g clean stall:
The Stall Block
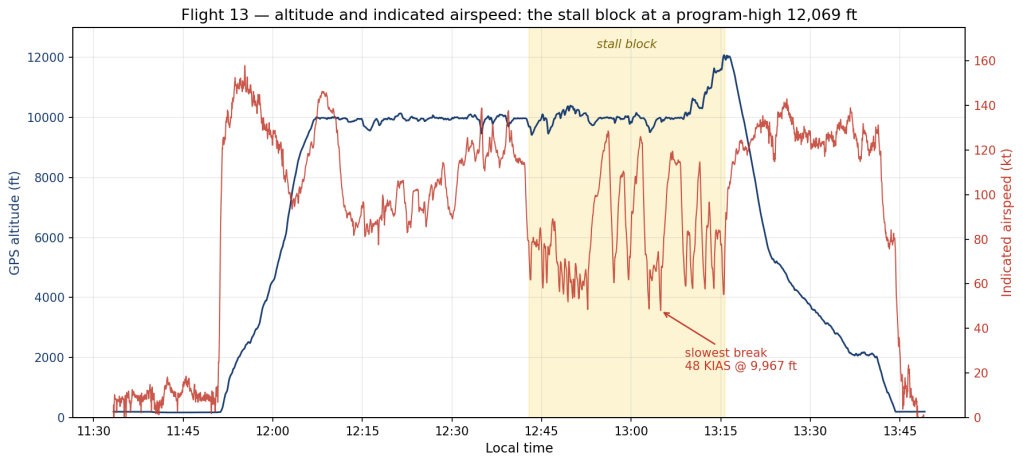
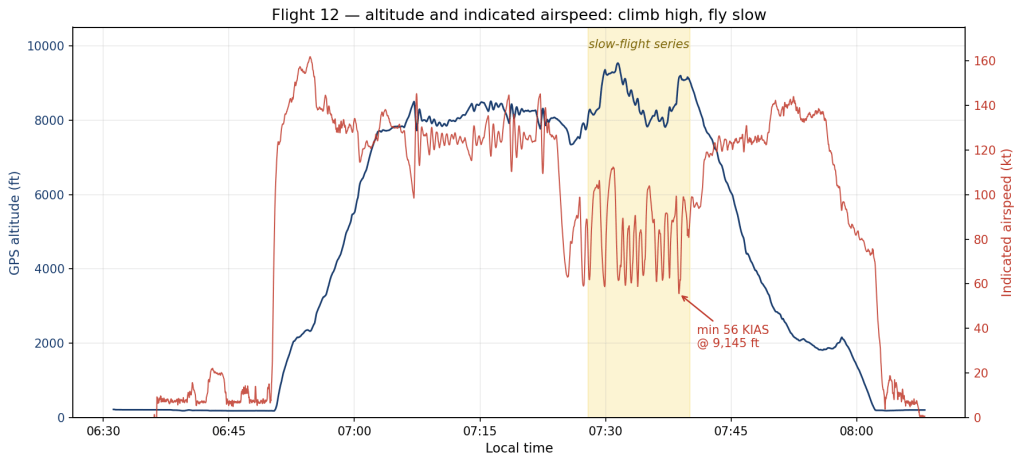
The profile chart shows the structure: climb out of Manassas, stability work around 10,000 feet, then a sustained 33-minute stall block — that dense comb of deceleration spikes in the red trace, each one a deliberate walk down to the break and a recovery. Toward the end of the block the airplane steps up and up, topping out at 11,520 ft MSL (12,069 ft GPS) for the power-on series, then a long descent home.
The headline numbers, all flown solo at light weight:
| Series (engine-verified) | Break | Notes |
|---|---|---|
| Power-off, early series | 52–58 KIAS | idle/low power, ~10,000 ft — likely the clean (flaps-up) cards, per fly order |
| Power-off, later series | ~48 KIAS | three events, 48.0–48.7, idle/low power — likely the full-flap cards, per fly order |
| Power-on (departure) | 55–59 KIAS | 16–18″ MAP / ~2,500 RPM, +14 to +18° pitch — verified from engine data |
A word on how those rows are labeled, because honesty matters more than tidiness. The flap-position sensor is one of the program’s open squawks — this flight’s log records raw counts from −521 to +9, which is to say, nothing usable — so no row above can claim a data-verified flap setting. What the data does verify is power: the engine channels cleanly separate five power-on breaks (16–18 inches of manifold pressure, 2,500 RPM, nose up +14° or more) from seven power-off breaks at or near idle. The flap attribution rests on the card fly order — the clean stalls were scheduled before the full-flap ones — plus a physics cross-check: flaps lower the stall speed, and sure enough the later power-off series broke a good seven knots slower than the earlier one. Likely, not proven, until the new flap sensor goes in.
The numbers also pass the placard test once you account for weight. The placarded stall speeds at gross are about 61 knots clean and 52 with full flaps; stall speed scales with the square root of weight, and this was one pilot and partial fuel, far below gross. Scale the placard numbers down and you land almost exactly where the airplane did: high-50s breaks for the (likely) clean series, 48 for the (likely) full-flap series. The G-trace adds one more correction — the breaks happened partially unloaded, 0.74–0.88 G, which reads lower still. And through all of it the airplane behaved: buffet warning, a straight-ahead break, conventional recovery, every time.
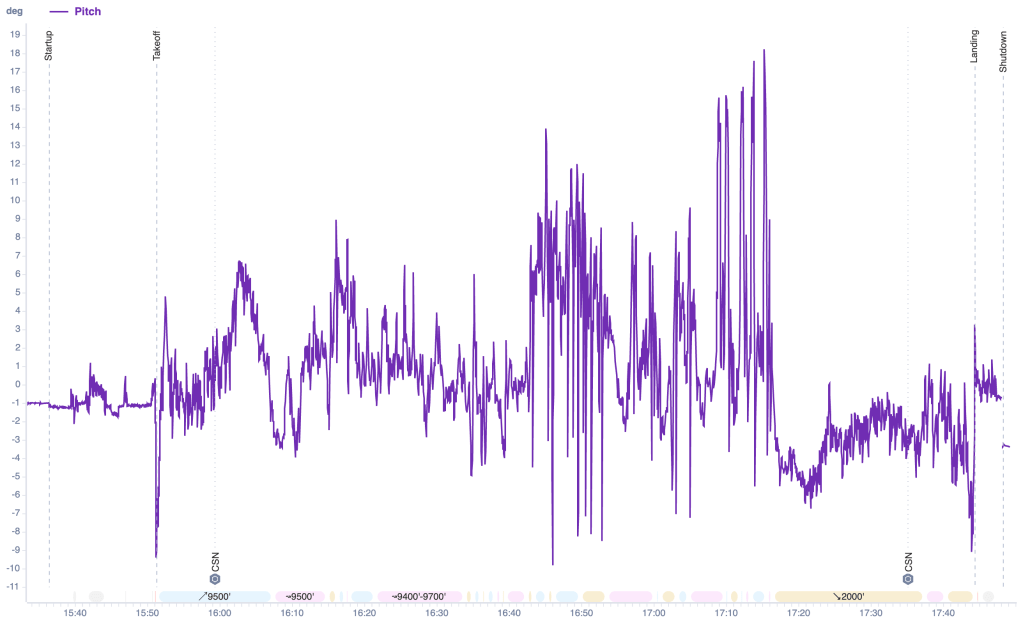
FlySto’s pitch trace makes the hour of stall work visible at a glance — every tooth in that comb is a nose-up walk toward the break and the nose-drop after it, and the tall +14 to +18° peaks late in the block are the power-on series, right on the card’s target attitudes:
One more layer from Flight 11’s calibration work: at these speeds the airspeed indicator reads about a knot and a half low, so calibrated break speed is closer to 49–50. Every knot of that bookkeeping matters when these numbers eventually set the approach speeds.
Can You See the Buffet in the Data?
The pre-stall buffet is unmistakable in the seat — the airframe starts talking to you well before the break. A fair question is whether the data logger hears it too. The answer: yes, faintly. The G3X logs at 1 Hz, and real airframe buffet shakes at several cycles per second or more, so the log catches only an aliased, heavily muted echo of what the pilot feels. But it’s there: in eleven of the twelve stall events, the roughness of the normal-acceleration trace climbs to two to five times its smooth-air baseline in the final seconds before the break.
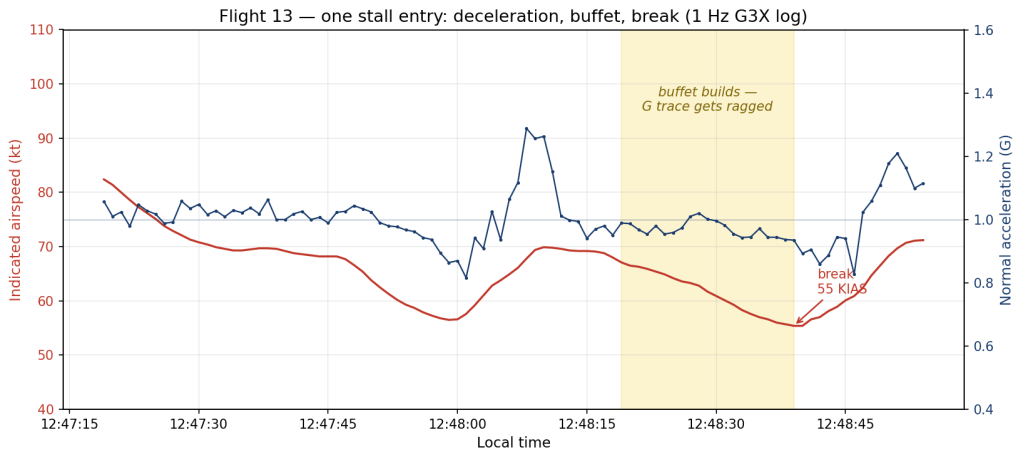
The chart above is one entry from the block: airspeed bleeding down, the G trace starting to fray in the shaded buffet window, the drop at the break, and the firm recovery pull after. The amplitudes look small — a few hundredths of a G — but remember the sampling: the cockpit experience is a much louder version of what survives into a once-per-second log.
Engine: Leanest Cruise Yet, and a Plot Twist in the CHTs
The mixture story keeps marching: median cruise fuel flow was ~11.5 gph, the leanest of the program — a long way from the 18–23 gph full-rich break-in flights.
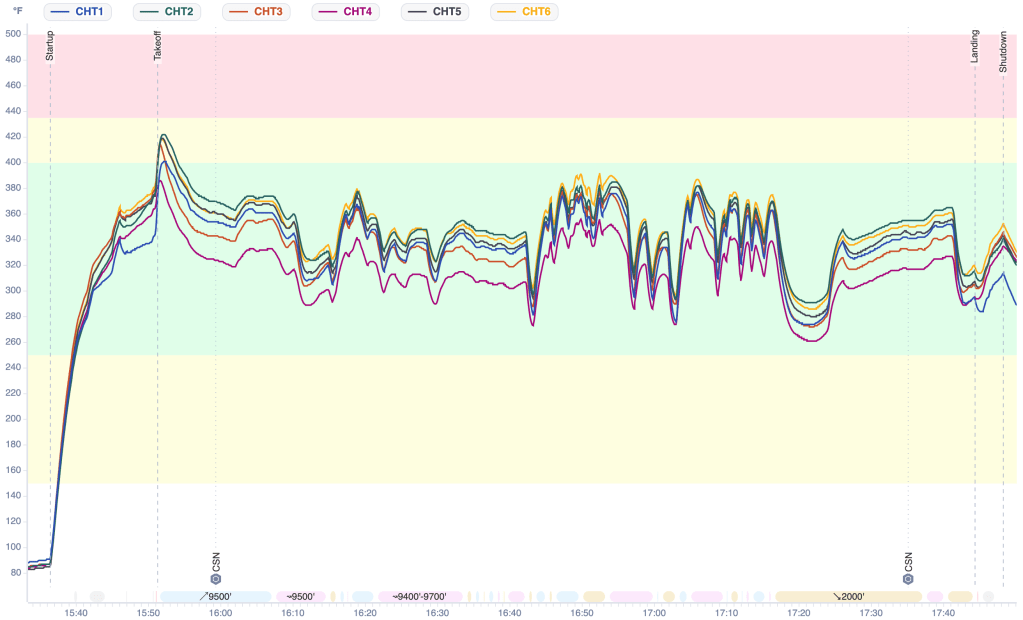
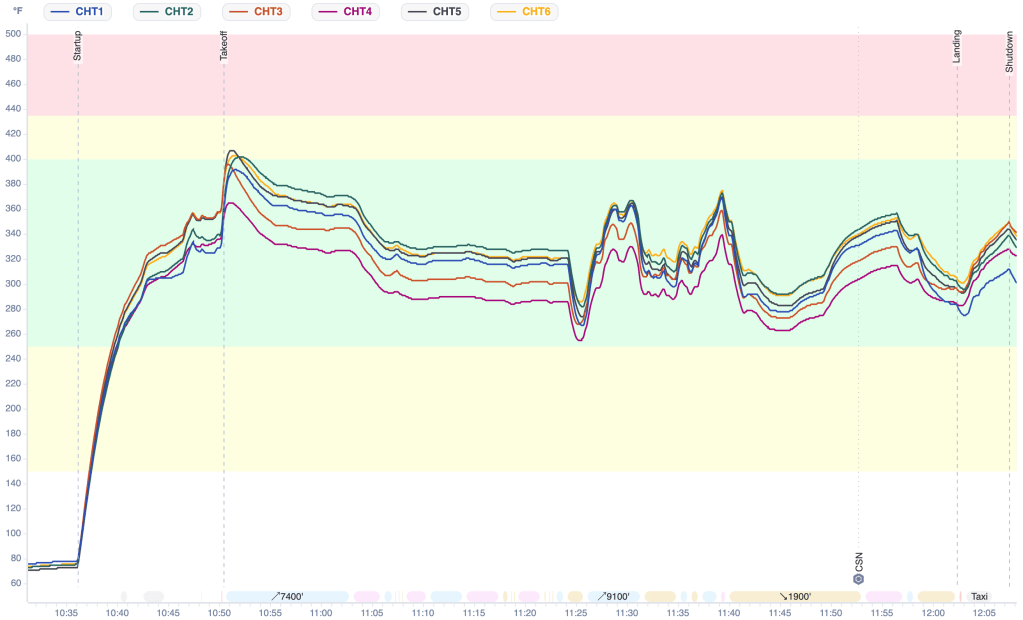
The FlySto chart shows the whole flight: one hot moment on the climb-out where the pack peaks just over 420 °F, brushing the caution band, then a busy, healthy green-band sawtooth as the stall work cycles power up and down for an hour. The plot twist is which cylinder topped the chart: cylinder 2 at 422 °F — not cylinder 5, the climb-cooling canary from the last three flights (it logged 419). One warm-day flight isn’t a trend, but the ranking shuffle is noted and goes in the watch file.
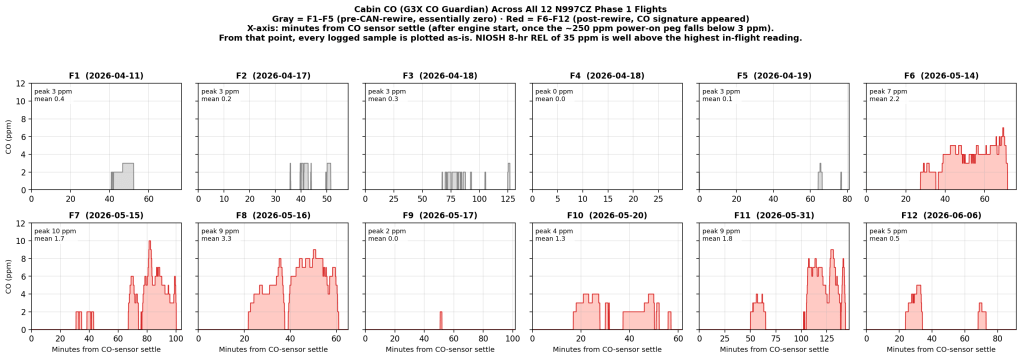
The CO Detector Read Zero — Which Is Suspicious
Cabin CO logged 0 ppm for the entire flight. Taken at face value that would be the best result of the program — but every slow-flight-heavy flight from 6 through 12 showed at least a few ppm, and this was the most aggressive high-AoA profile yet. A sensor that suddenly reports perfect silence on exactly the profile that always made it talk is more likely asleep than victorious. Verifying the detector is on the squawk list; until then, this flight’s CO data gets an asterisk, not a trophy.
Also On This Flight
- A freshly overhauled attitude unit went into the panel the day before this flight — and through an hour of stalls and high-AoA work, the attitude display never so much as twitched. By my count that makes this the first flight in the airplane’s life with no attitude-horizon tumble — the cross-source roll disagreement that hit ~136° the day before stayed under 10° through all of it, and it has stayed that way since. (The story has a sequel brewing: the #2 attitude source has started miscomparing against the newly healthy #1.) The full saga, and the data behind it, is getting its own post.
- Manual flying practice: about an hour of the flight was hand-flown — stall work is hand-flying by definition, and the autopilot got the cruise legs.
Squawks
- Accelerated/turning stall card not flown — carried forward to a future sortie.
- CO detector read zero all flight — verify it’s actually alive before trusting the result.
- Flap position indication still broken — and it stings more on a flight like this one, because it leaves the stall-speed-versus-configuration record resting on the card sequence and pilot recollection instead of data. Replacement sensor is on the parts list.
Bottom Line
Flight 13 closed out the bread-and-butter stall series: power-off breaks walking down from the high 50s to 48 knots indicated as the flaps (most likely) came out, power-on breaks in the high 50s — all of it right where the placard predicts once you do the weight math — honest manners throughout, and a new program-high 11,520 ft MSL (12,069 ft GPS). The engine ran its leanest cruise yet, cylinder 2 stole the hot-cylinder crown for a day, and the CO detector’s perfect silence earned suspicion instead of celebration. One card carries forward, and the stability data is in the can awaiting analysis. The envelope is opening up.
Engine time after Flight 13: 18.3 hours.