Flight 19 put Harry Tsepelias back in the left seat for another go in N997CZ. It wasn’t a formal test card — more of a shakedown and stick time — but it gave the autopilot a long, honest workout, and that finally pinned down a roll-autopilot squawk we’ve been chasing: it just wasn’t aggressive enough rolling into turns. The good news is everything else on the airplane behaved beautifully.
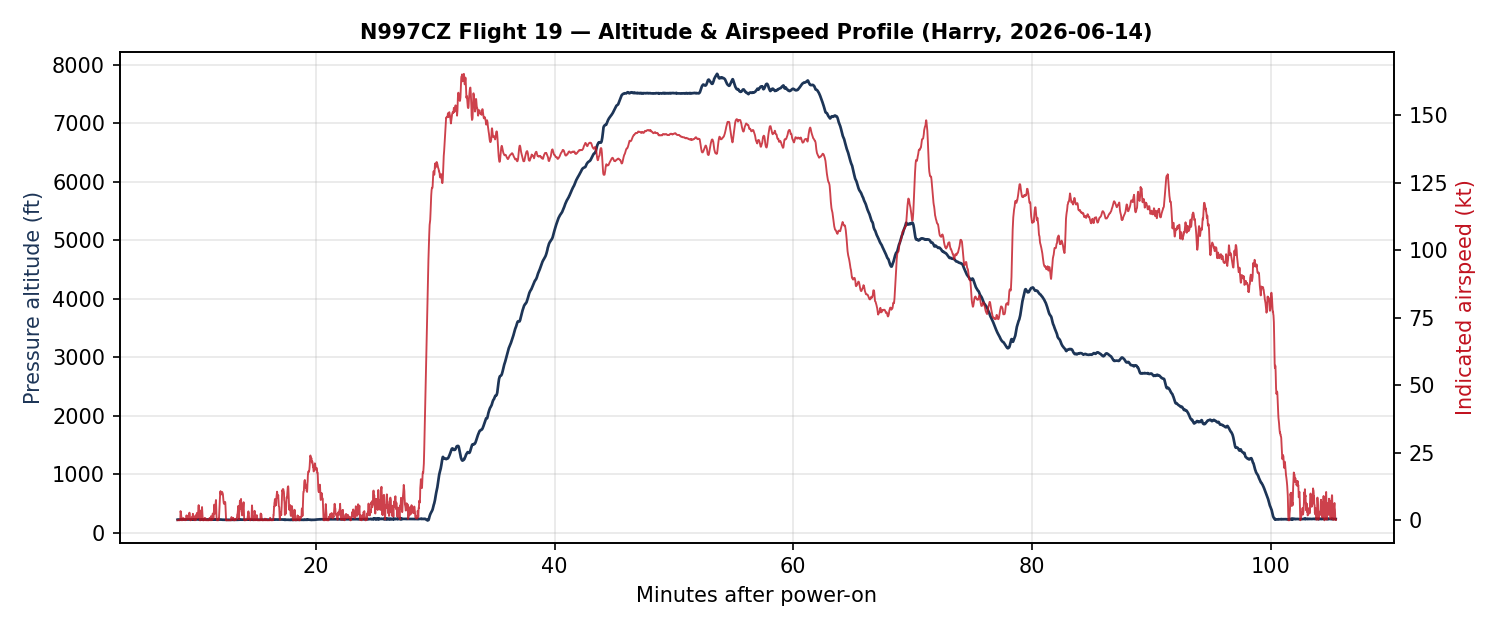
A quick snapshot of the flight: engine start 09:42, shutdown 11:19 — about 1.6 hours — out of KHEF, up to 7,830 ft MSL (8,238 ft GPS), 165 KIAS / 172 kt true at the fast end, 18.6 gallons burned (all from the right tank, no switch).
The autopilot is slow to roll into a turn
The squawk is easy to feel from the seat: dial in a big heading change with the heading bug, and the flight director snaps to a commanded bank — but the airplane is slow to roll into it, as if the servo can’t push the ailerons over. I’d been chasing it for a few flights mostly by adding muscle, walking the roll-servo maximum torque up 15% → ~40% → 90%. It helped, but never quite cured it. So I went digging in the logs to settle the real question: is the autopilot short on muscle, or just using it badly?
One other autopilot note worth logging: during a slower segment the system briefly went to its “minimum airspeed” protection (it annunciated for about 38 seconds, along with nose-up trim commands). That’s the autopilot refusing to fly slower than its configured floor — and it’s exactly why lowering that minimum-airspeed setting is on the to-do list, so the AP can fly the slower approaches we want for upcoming testing.
Following the thread: muscle or gain?
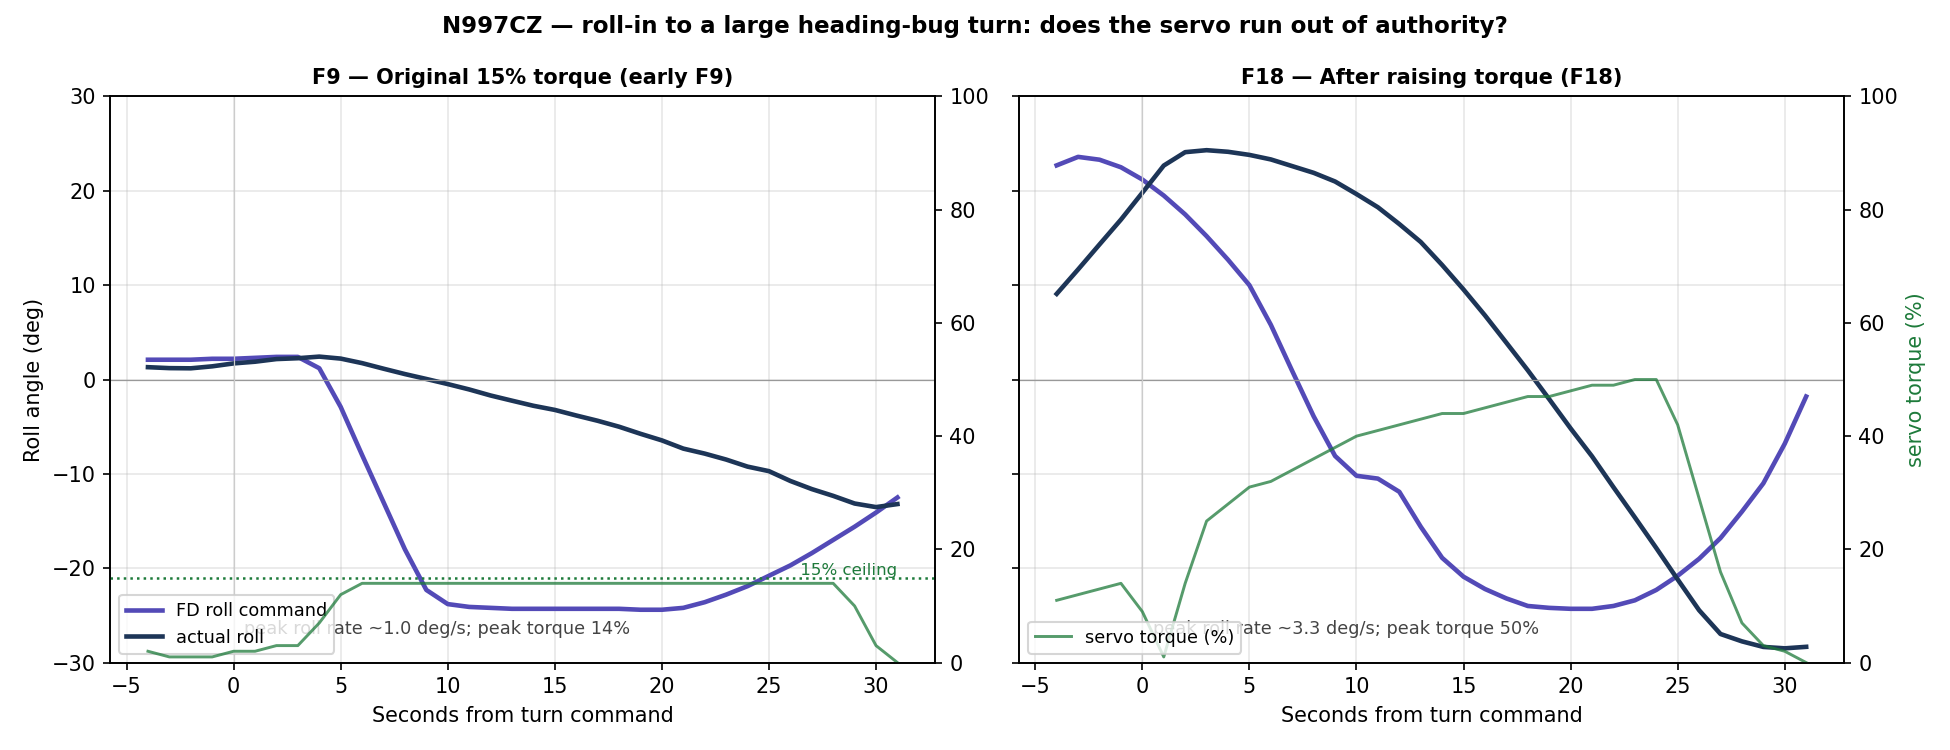
Early on, the sluggishness was real torque starvation. Back on Flight 9 the roll servo’s max torque was set to just 15%, and on a big heading-bug turn the servo pegged that 15% ceiling and the airplane rolled in at about 1° per second — never even reaching the commanded bank. That’s the “no strength to move the ailerons” feeling, and it’s exactly why I kept raising the torque.
Roll-in to a 24° heading-bug turn: at 15% torque (left) the servo pegs its ceiling and the airplane barely rolls; after raising it (right) the airplane follows the command.
Raising the torque fixed the authority problem. But here’s the catch: at the current 90% setting the roll-in is still gentle — and when I pull the numbers, the servo is only using about 20–45% of its torque during those turns. It never gets near 90%. It’s no longer out of muscle; it has plenty in reserve and simply isn’t using it.
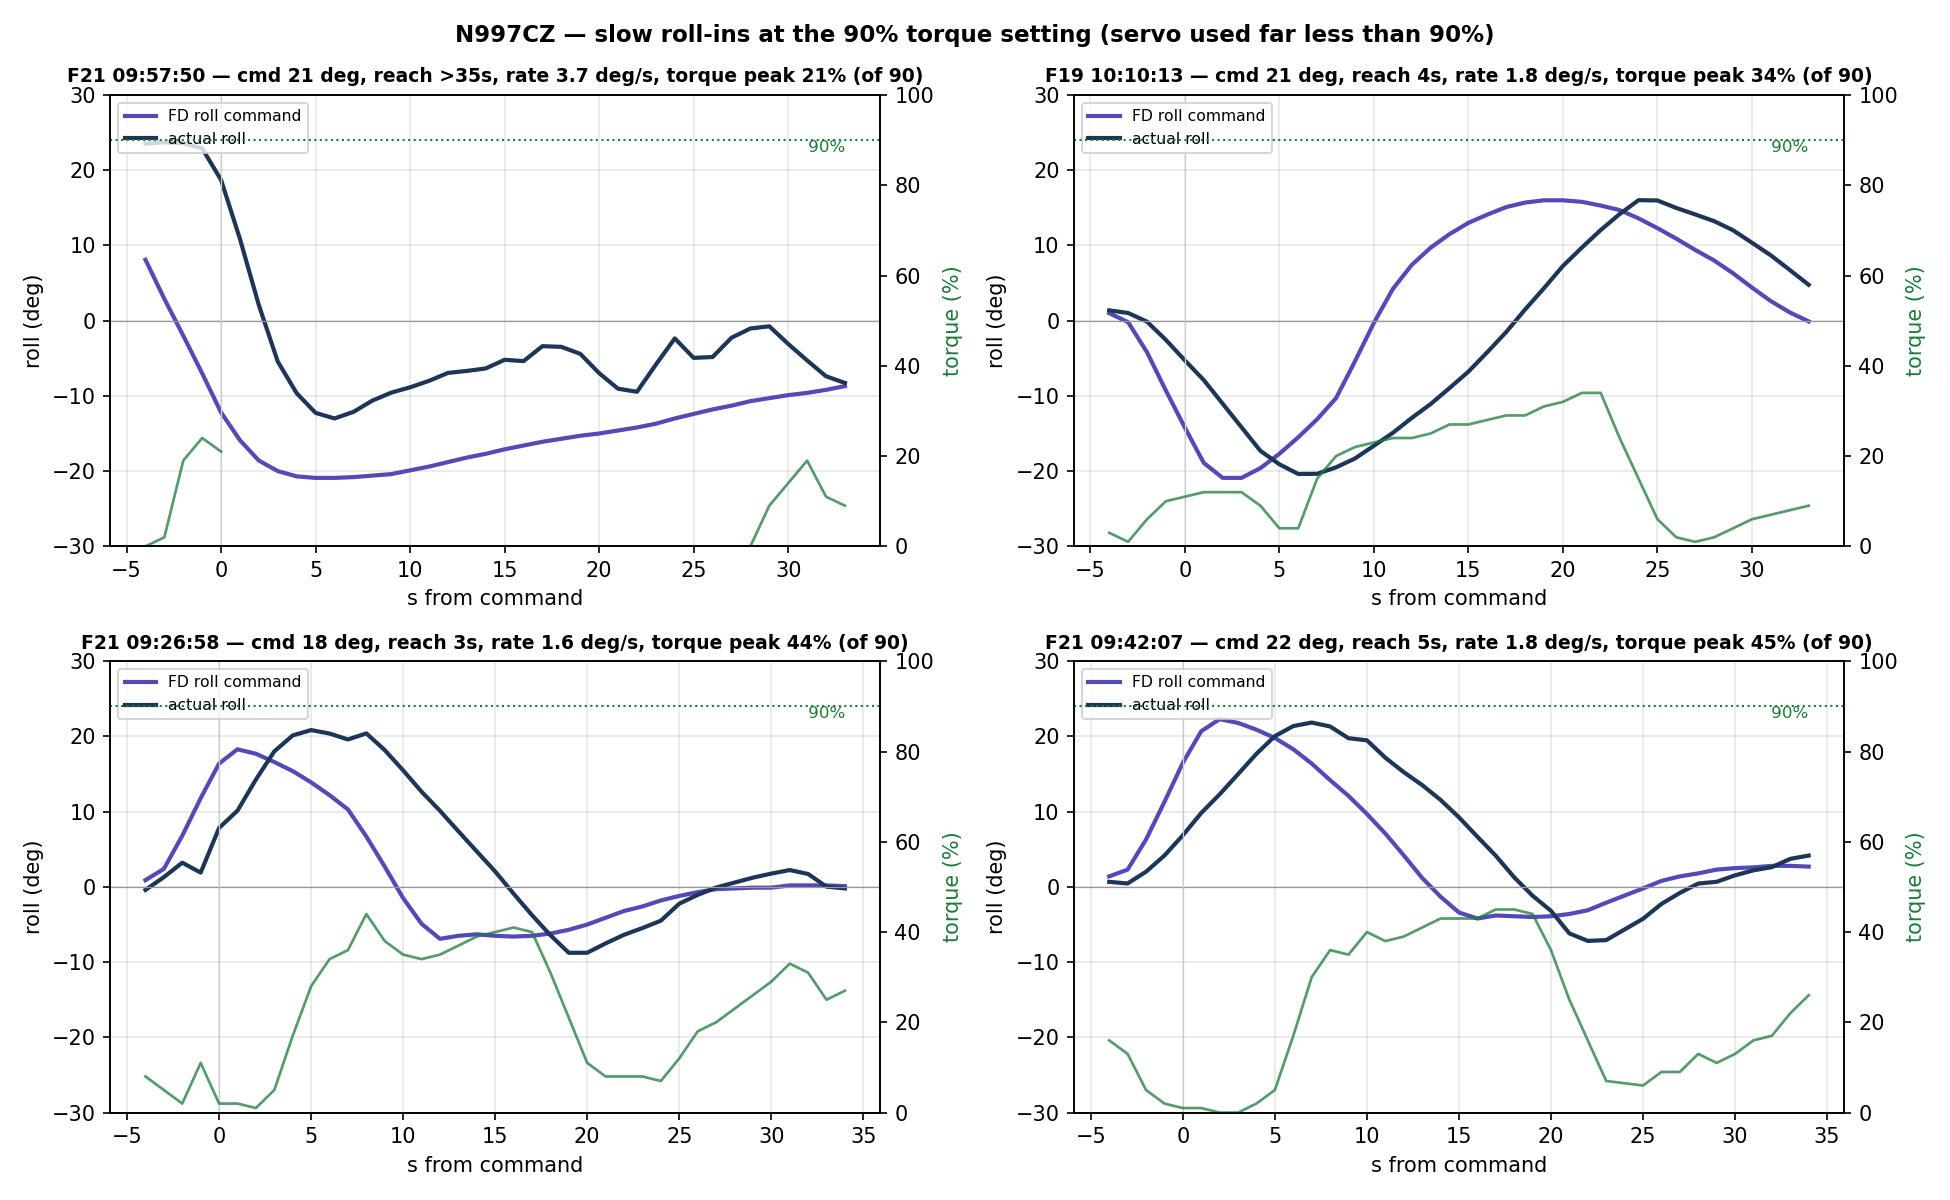
Four heading-bug turns at the 90% torque setting — the airplane (navy) lags the flight director command (purple) into the bank while servo torque (green) stays well below the 90% line.
In each of these four heading-bug turns, the actual roll trails the flight director’s commanded bank by several seconds, rolling in at only ~1–3° per second — and the servo torque sits far below the 90% line the whole time. The autopilot has authority to spare and just isn’t asking for it.
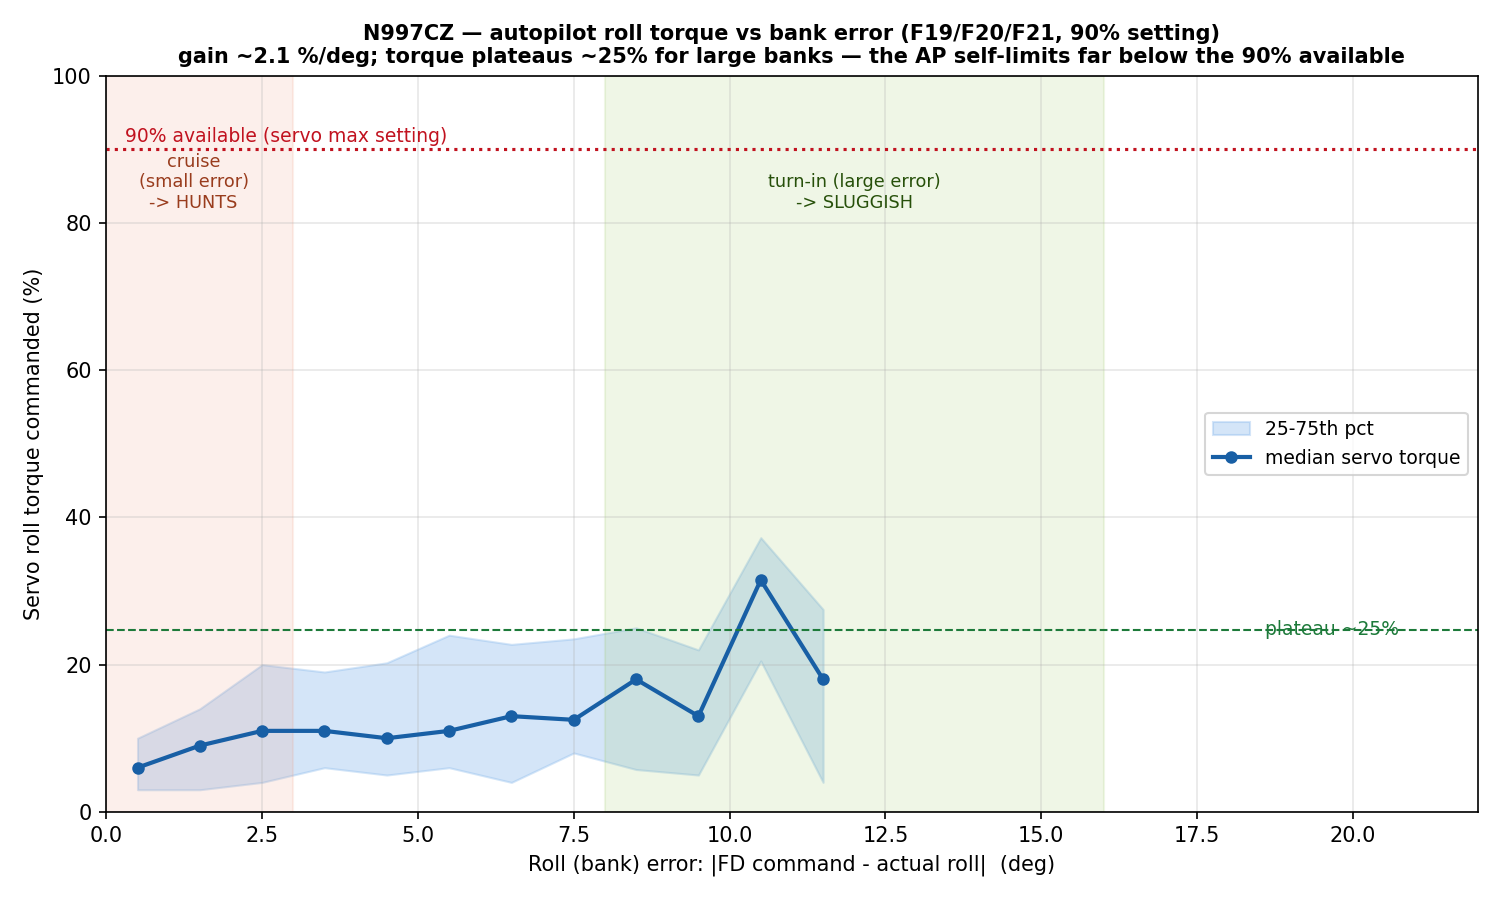
The clincher is the autopilot’s torque-versus-bank-error curve. Pooling every autopilot-flown turn on the recent flights, the servo commands only about 2% torque for every degree the airplane is off the commanded bank, and it plateaus around 25% even when the wing is more than 10° from where it should be:
Servo torque vs bank error — the gain is only ~2%/deg and torque plateaus near 25% of the 90% available.
That’s the signature of a roll gain set too low — the autopilot is under-driving a servo that has torque to spare. And Garmin’s roll servo has exactly two knobs: Max Torque (the muscle, which I’d been raising) and Roll Servo Gain — literally “how aggressively the servo moves the ailerons,” adjustable from 0.05 to 10.00. Mine is sitting around 0.6, down near the bottom of the range.
So I’d been turning the wrong knob. The fix for the sluggish turns isn’t more torque, it’s more gain — telling the servo to use the authority it already has. If raising the gain doesn’t crisp up the roll-in, the next suspect is mechanical friction in the aileron circuit, which the Garmin servo can test for with a clutch-slip check.
Everything else: healthy
While I chase the autopilot tuning, the rest of the airplane turned in one of its cleaner data sets:
Engine temps: the hottest cylinder head was Cylinder 5 at 416°F — still the air-dam “canary” that runs warmest in the climb — with Cylinder 4 coolest at 379°F. Everything comfortably under the 450°F redline.
Carbon monoxide: cabin CO peaked at 6 ppm (mean under 1) — benign, and the normal non-zero trace confirms the detector is reading correctly.
Attitude (AHRS): rock-solid. Another flight since Garmin replaced the second AHRS — cross-unit deviations stayed under 400%, with zero of the big >500% spikes from the bad-unit era and roll disagreement never over 2.3°. The roll squawk is an autopilot-tuning issue, not an attitude-sensing one — the AHRS knew exactly where the wing was.
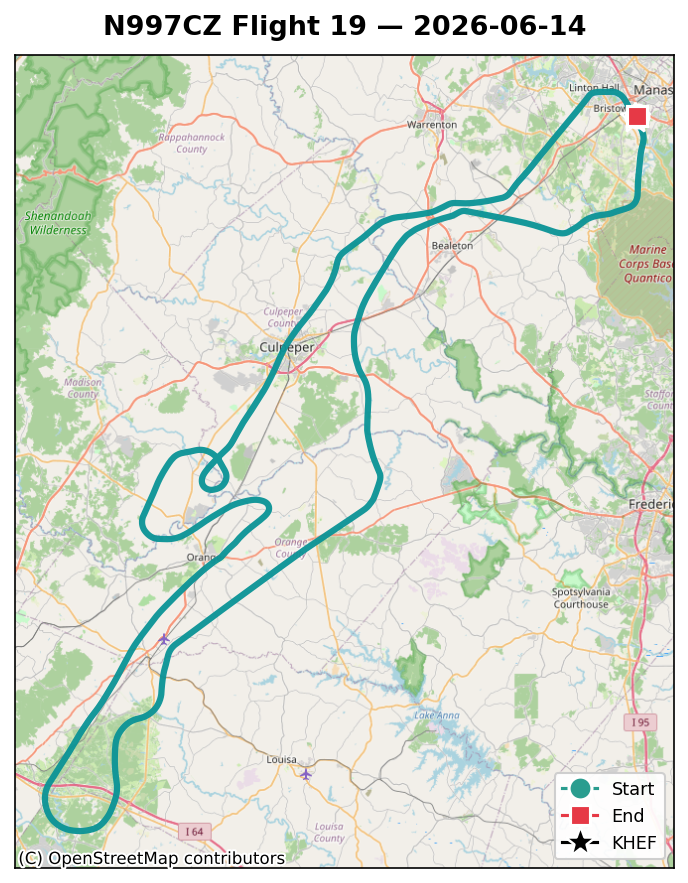
Flight 19 altitude and airspeed profile.Flight 19 ground track (KHEF test area).
Bottom line
Flight 19’s headline is a course correction, not a triumph: I’d been adding torque to a roll autopilot that was actually short on gain. The servo has muscle to spare — it uses only a quarter of what’s available — and just needs to be told to use it. So the next session is about raising the Roll Servo Gain a few steps at a time (Garmin’s in-air method: overpower the autopilot off the commanded bank, release, and watch how crisply it drives back), leaving the torque where it is. Engine, fuel, CO, and the overhauled attitude system all came home clean. Thanks to Harry for the stick time and the careful notes that made this one easy to pin down.
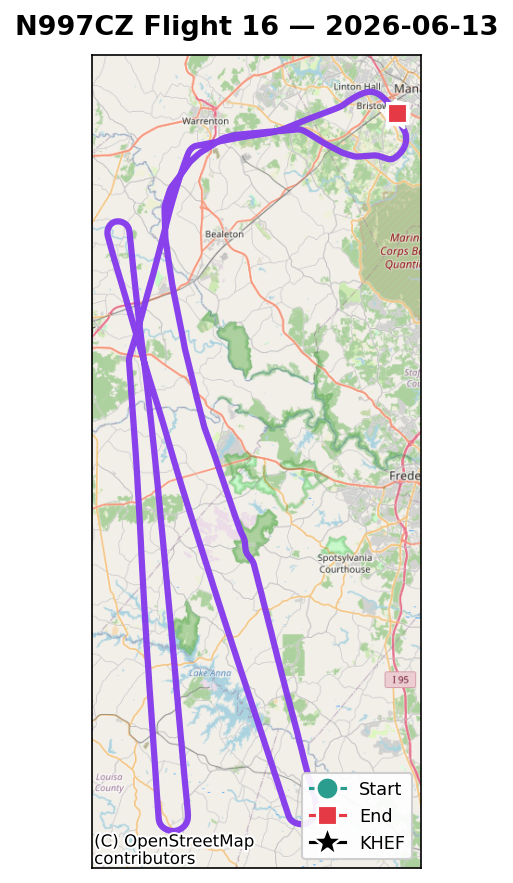
N997CZ’s Flight 16 ground track — long, straight test legs for stabilized cruise points
After the climb sortie, Flight 16 turned to the next block in the Phase 1 deck: cruise performance and leaning. Pick one altitude, hold it dead steady, and step through power and mixture settings, logging speed and fuel flow at each stabilized point. The ground track tells you what that looks like from above — long, patient straight legs instead of the racetracks and sawtooths of the maneuvering flights.
It was also quietly historic for a different reason: this was the first flight with both attitude units overhauled (more on that below).
The Numbers
Date
2026-06-13 (morning)
Engine time
~1.7 hr
Engine hours
22.2 → 23.9
Test altitude
7,500 ft MSL, 2500 RPM (density alt ~8,900 ft)
Max altitude
~7,550 ft MSL (7,905 ft GPS)
Fuel used
22.7 gal (totalizer) — matched the truck receipt (21.70 gal) to ~1 gal
The heart of the flight: hold 7,500 ft and 2500 RPM, then step the throttle down through a range of manifold pressure, letting the airplane stabilize at each setting. The stabilized points (power is the G3X’s own computed engine percentage):
MAP
Power
Fuel flow
TAS
Economy
22.5″
70%
18.7 gph
168 kt
9.0 nm/gal
21.5″
67%
17.6 gph
164 kt
9.3 nm/gal
20.5″
64%
16.8 gph
162 kt
9.6 nm/gal
19.3″
60%
15.9 gph
156 kt
9.8 nm/gal
17.9″
55%
14.5 gph
149 kt
10.3 nm/gal
16.9″
52%
13.7 gph
141 kt
10.3 nm/gal
14.8″
46%
12.3 gph
133 kt
10.8 nm/gal
It’s the classic trade, made concrete: near wide-open (~22.5″, 70% power, 18.7 gph) the airplane trues a brisk 168 knots but returns only 9.0 nm/gal; pull the throttle back toward 15″ (about 46% power) and you give up roughly 35 knots of true airspeed to gain about 20% in fuel economy — up past 10.8 nm/gal. At a fixed mixture, every extra knot of speed costs efficiency: the balance every cross-country pilot strikes.
Two caveats before anyone quotes these figures. This is not the airplane’s top speed. Every point was flown at a fixed 2,500 RPM — not the 2,700 the engine turns at full power — and at 7,500 ft with the mixture full rich, so even the 168-knot top row is leaving speed on the table compared to full throttle, full RPM, and a more efficient altitude. This is a controlled comparison, not a speed record. And it is not best economy. Full rich is the thirstiest way to make any given power; the real fuel savings come from leaning, which is exactly what the next card went after. Read the table for the shape of the power-speed-fuel trade at one condition, all else held equal — not for the best the airplane can do at either end.
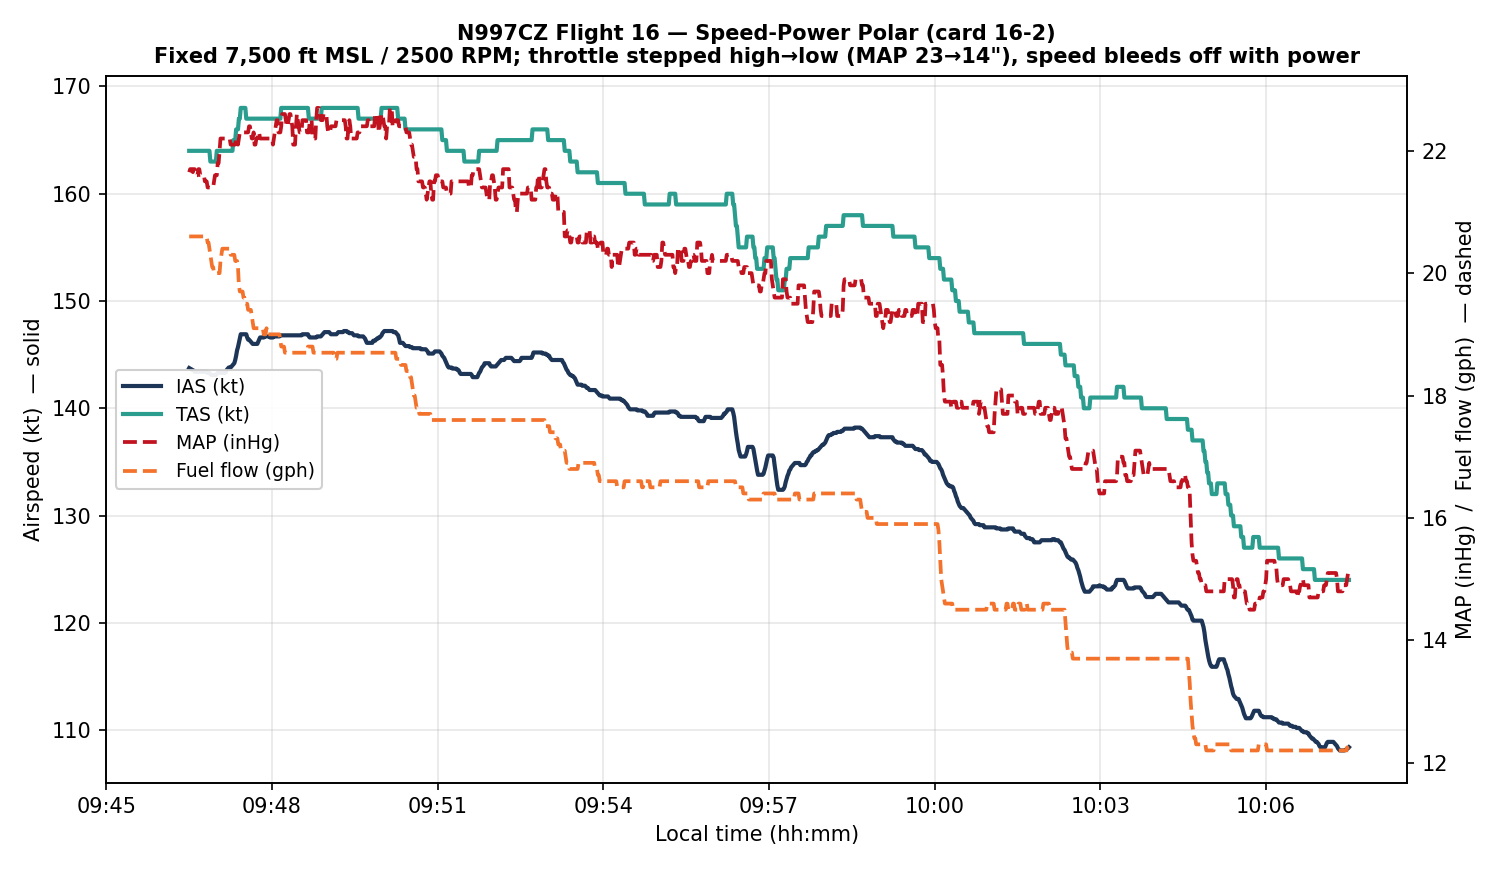
Here’s the whole sequence as flown — throttle stepped down in stages at a fixed altitude, with the airspeed settling out at each new power setting:
Flight 16 speed-power polar — MAP and fuel flow (dashed, right axis) stepped down while IAS and TAS (solid, left axis) bleed off
The Lean Sweep (GAMI Spread)
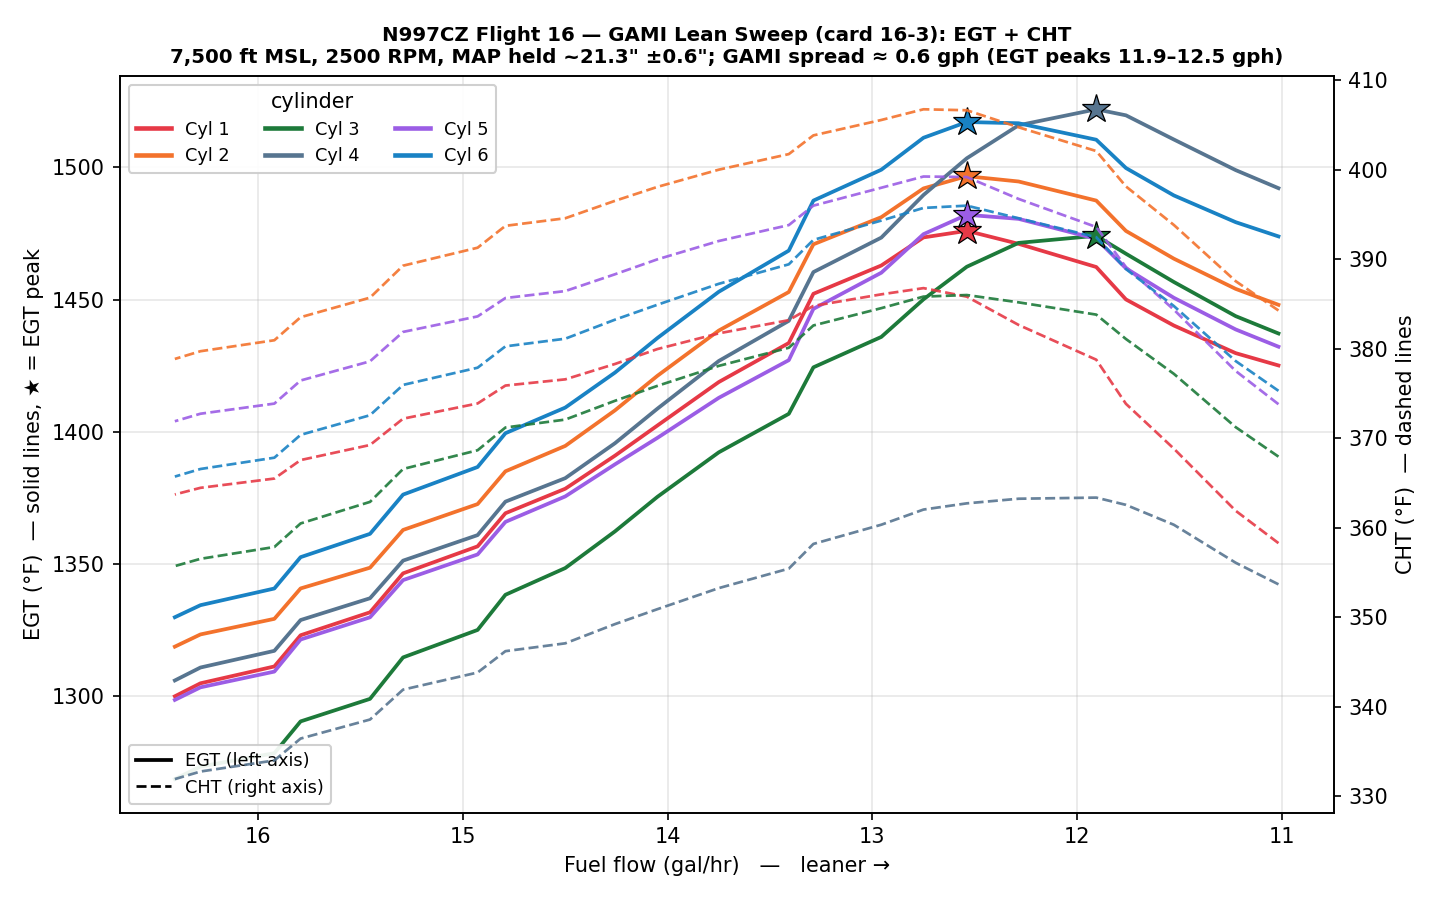
Then the part I’d been looking forward to: card 16-3, the mixture sweep. Hold the airplane at 7,500 ft and 2500 RPM, leave the throttle alone (manifold pressure parked at ~21.3″, wandering maybe ¾ of an inch), and pull the mixture back slowly — about 16 down to 11 gph — while the G3X logs all six cylinders’ exhaust gas temperatures. Each cylinder’s EGT climbs to a peak and then falls; the fuel flow at which it peaks tells you how rich or lean that cylinder runs relative to the others. The spread between the first and last cylinder to peak is the GAMI spread — the headline number for how well your fuel injectors are matched.
Flight 16 GAMI lean sweep — six EGTs (solid, left axis) rise, peak (★), and fall; CHTs (dashed, right axis) overlaid. GAMI spread ~0.6 gph
The result is a good one: a GAMI spread of about 0.6 gph. Cylinders 1, 2, 5, and 6 peak first (around 12.5 gph — they run slightly leaner), and Cylinders 3 and 4 peak last (around 11.9 gph — slightly richer). Anything under ~1 gph is generally considered well-matched and capable of smooth lean-of-peak operation, so this engine’s injectors are in good shape right out of the box.
The dashed lines on the chart are the cylinder head temperatures (right axis), and they tell their own reassuring story. As expected, each CHT peaks just slightly rich of its EGT peak, and the hottest any head got during the entire sweep was about 407 °F (Cylinder 2) — comfortably below limits the whole time, even at the richest, highest-EGT settings. Leaning this engine doesn’t cook it. (One honest note on method: the curves are read straight off the logged data; with a conventional left mag and the SDS electronic ignition on the right, the absolute EGT picture carries that timing asymmetry, but the relative peak ordering — which is what the spread measures — is robust.)
And here’s the bonus the sweep makes vivid: leaning buys efficiency far more cheaply than throttling back does. Hold the same ~21″ of manifold pressure the polar started at, and instead of closing the throttle, just lean the mixture — the airplane still trues about 163 knots on 13.3 gph, a tidy 12.3 nm/gal (and leaner still, up to ~14 nm/gal). Back on the speed-power polar it took ~18.7 gph of throttle to make that same ~163 knots, at just 9.0 nm/gal. Same speed, roughly a third less fuel. That’s the whole point of leaning, made concrete.
Here’s the sweep in the same form as the polar table above — but watch the Power column, because that’s the whole story. On the polar, economy only improved as power (and speed) came down. Here power holds at ~65% the entire time; leaning alone buys the efficiency, and the speed barely moves until the very lean end:
Fuel flow
Power
TAS
Economy
16.0 gph
64%
162 kt
10.2 nm/gal
15.0 gph
66%
163 kt
11.0 nm/gal
14.0 gph
66%
163 kt
11.6 nm/gal
13.3 gph
66%
163 kt
12.3 nm/gal
12.5 gph
65%
161 kt
13.0 nm/gal
11.5 gph
66%
157 kt
13.7 nm/gal
11.0 gph
65%
155 kt
14.0 nm/gal
(All held at ~21″ MAP and 7,500 ft — the same condition as the GAMI sweep above.)
Cooling and CO
Nothing dramatic, which is the goal in cruise. CHTs stayed comfortable — Cylinder 5 the hottest at 421 °F, everyone else lower, all well under limits. Cabin CO read essentially zero the whole flight. That’s roughly what you’d expect from a stabilized cruise with no sustained slow flight — this airplane’s CO ingress shows up in high-angle-of-attack work, which wasn’t on today’s card — but a flat zero earns an eyebrow rather than a victory lap: Flight 13 also read zero, yet the same detector logged a normal small reading on Flight 17 later the same day. Whether F16’s zero is genuinely clean air or a detector that simply wasn’t reading is still on the verify list.
Three Healthy Horizons
Here’s the quiet milestone. The overhauled second attitude unit (AHRS #2) was installed before this flight, so Flight 16 is the first time N997CZ has flown with both ADAHRS units overhauled. The verification was clean: through the whole flight, from takeoff roll to landing, the two units disagreed by less than a degree in roll, there were no re-aligns, and — for the first time in a long time — zero attitude or heading miscompare annunciations. After a long-running saga, the airplane finally has three attitude opinions that all agree. The full story is in the AHRS post.
After Shutdown
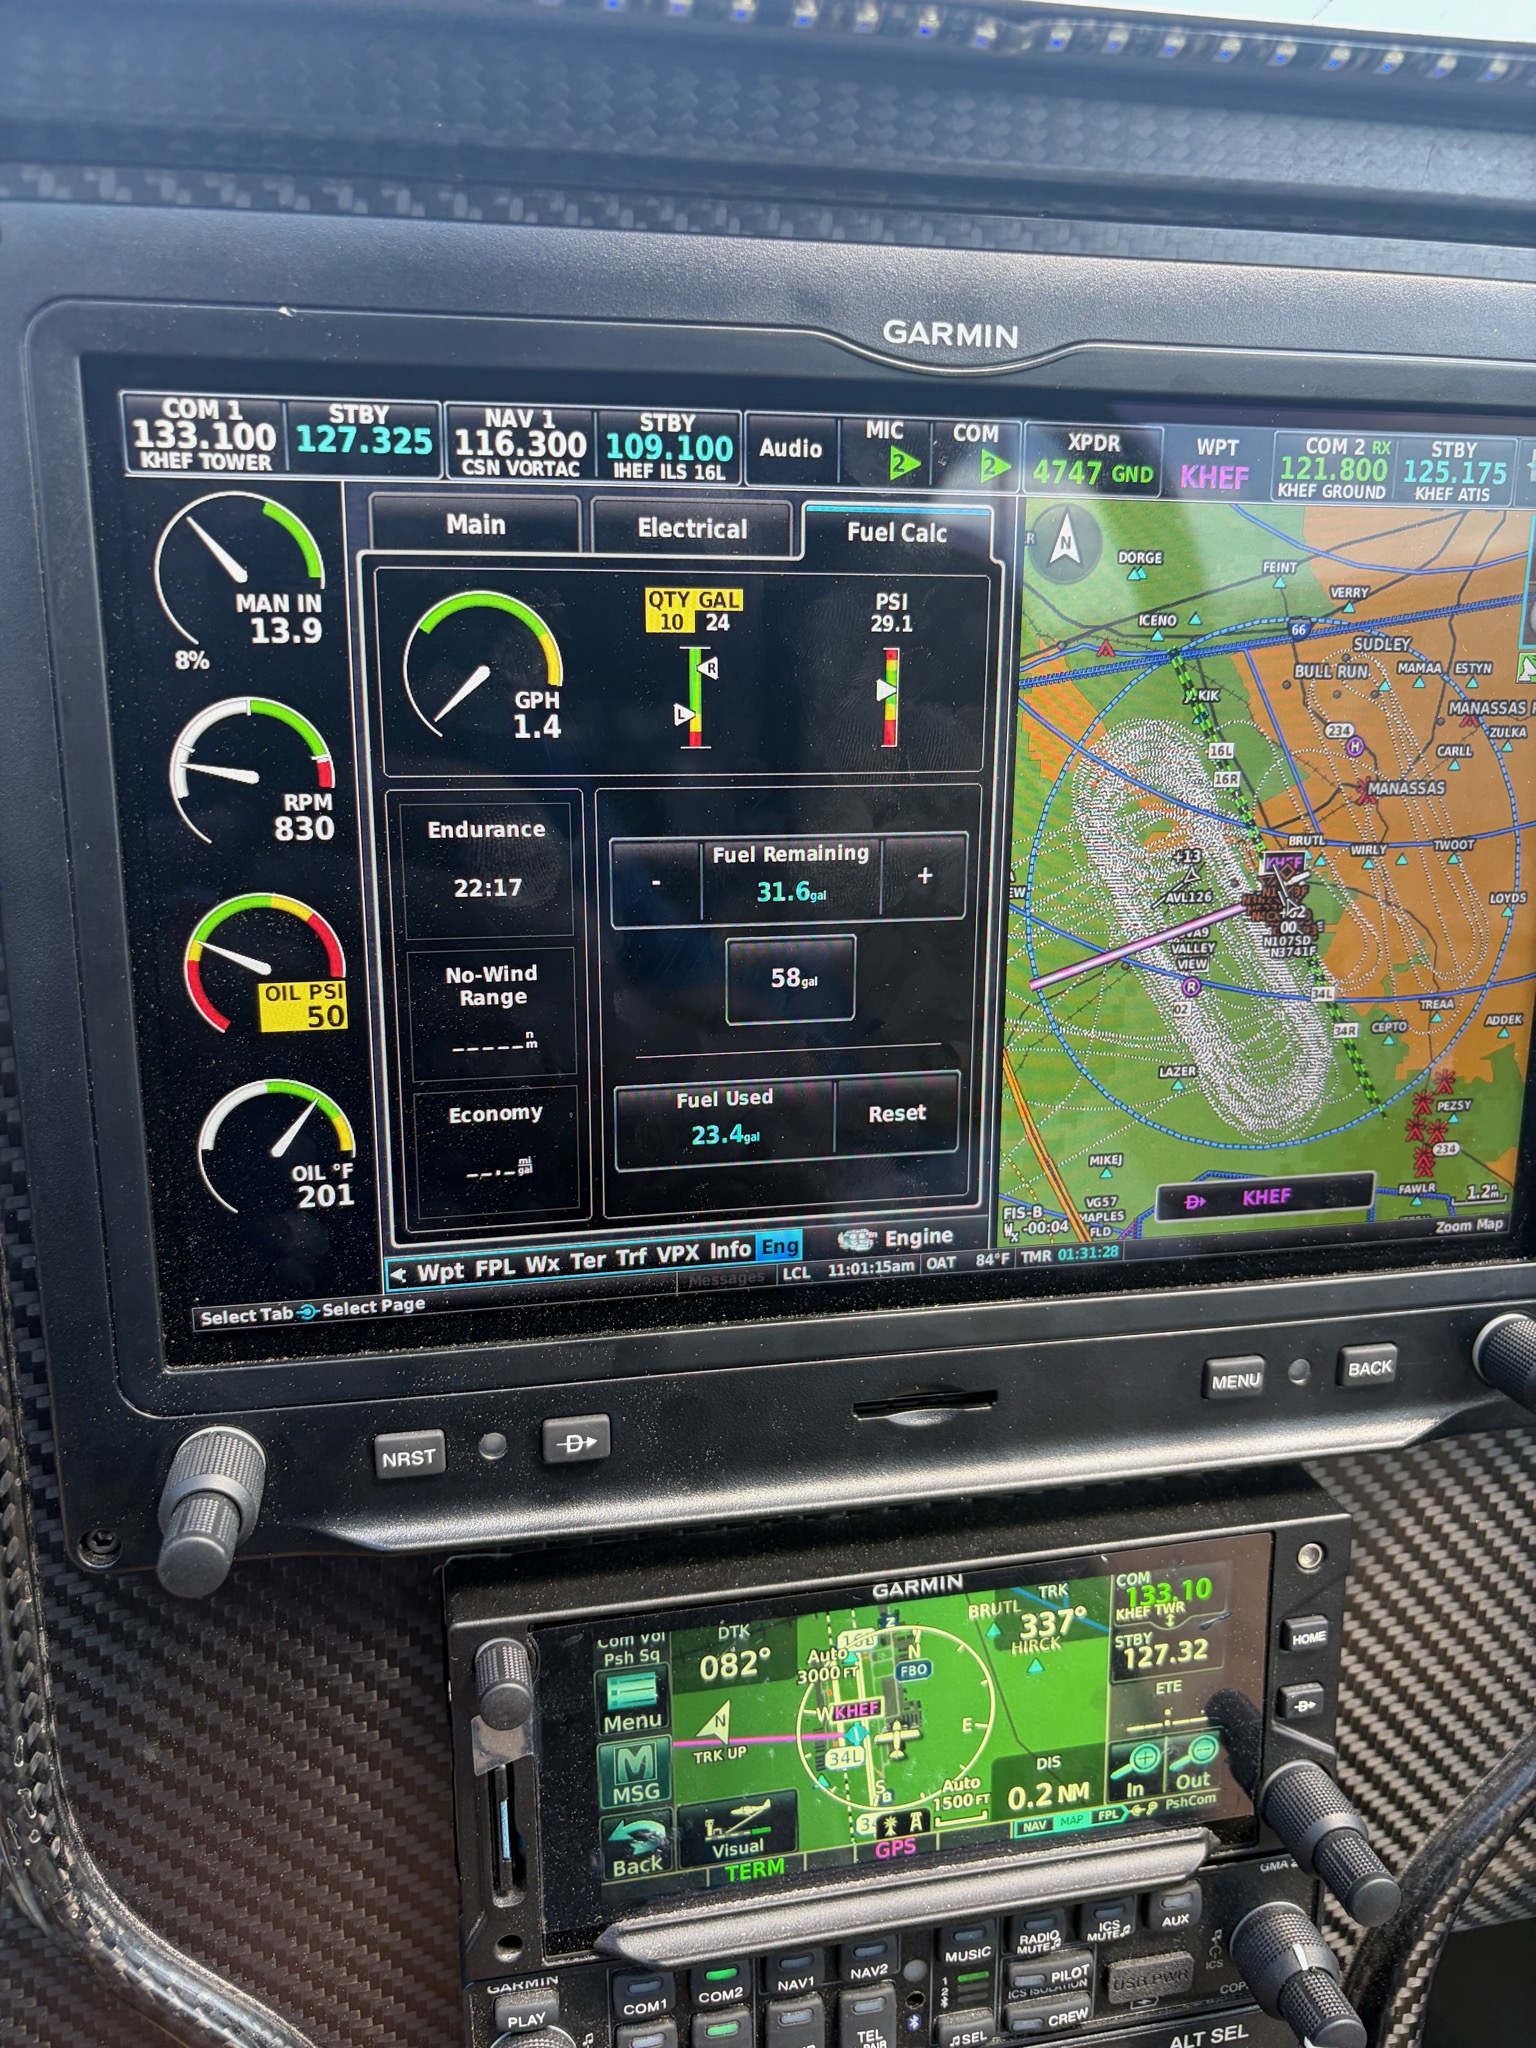
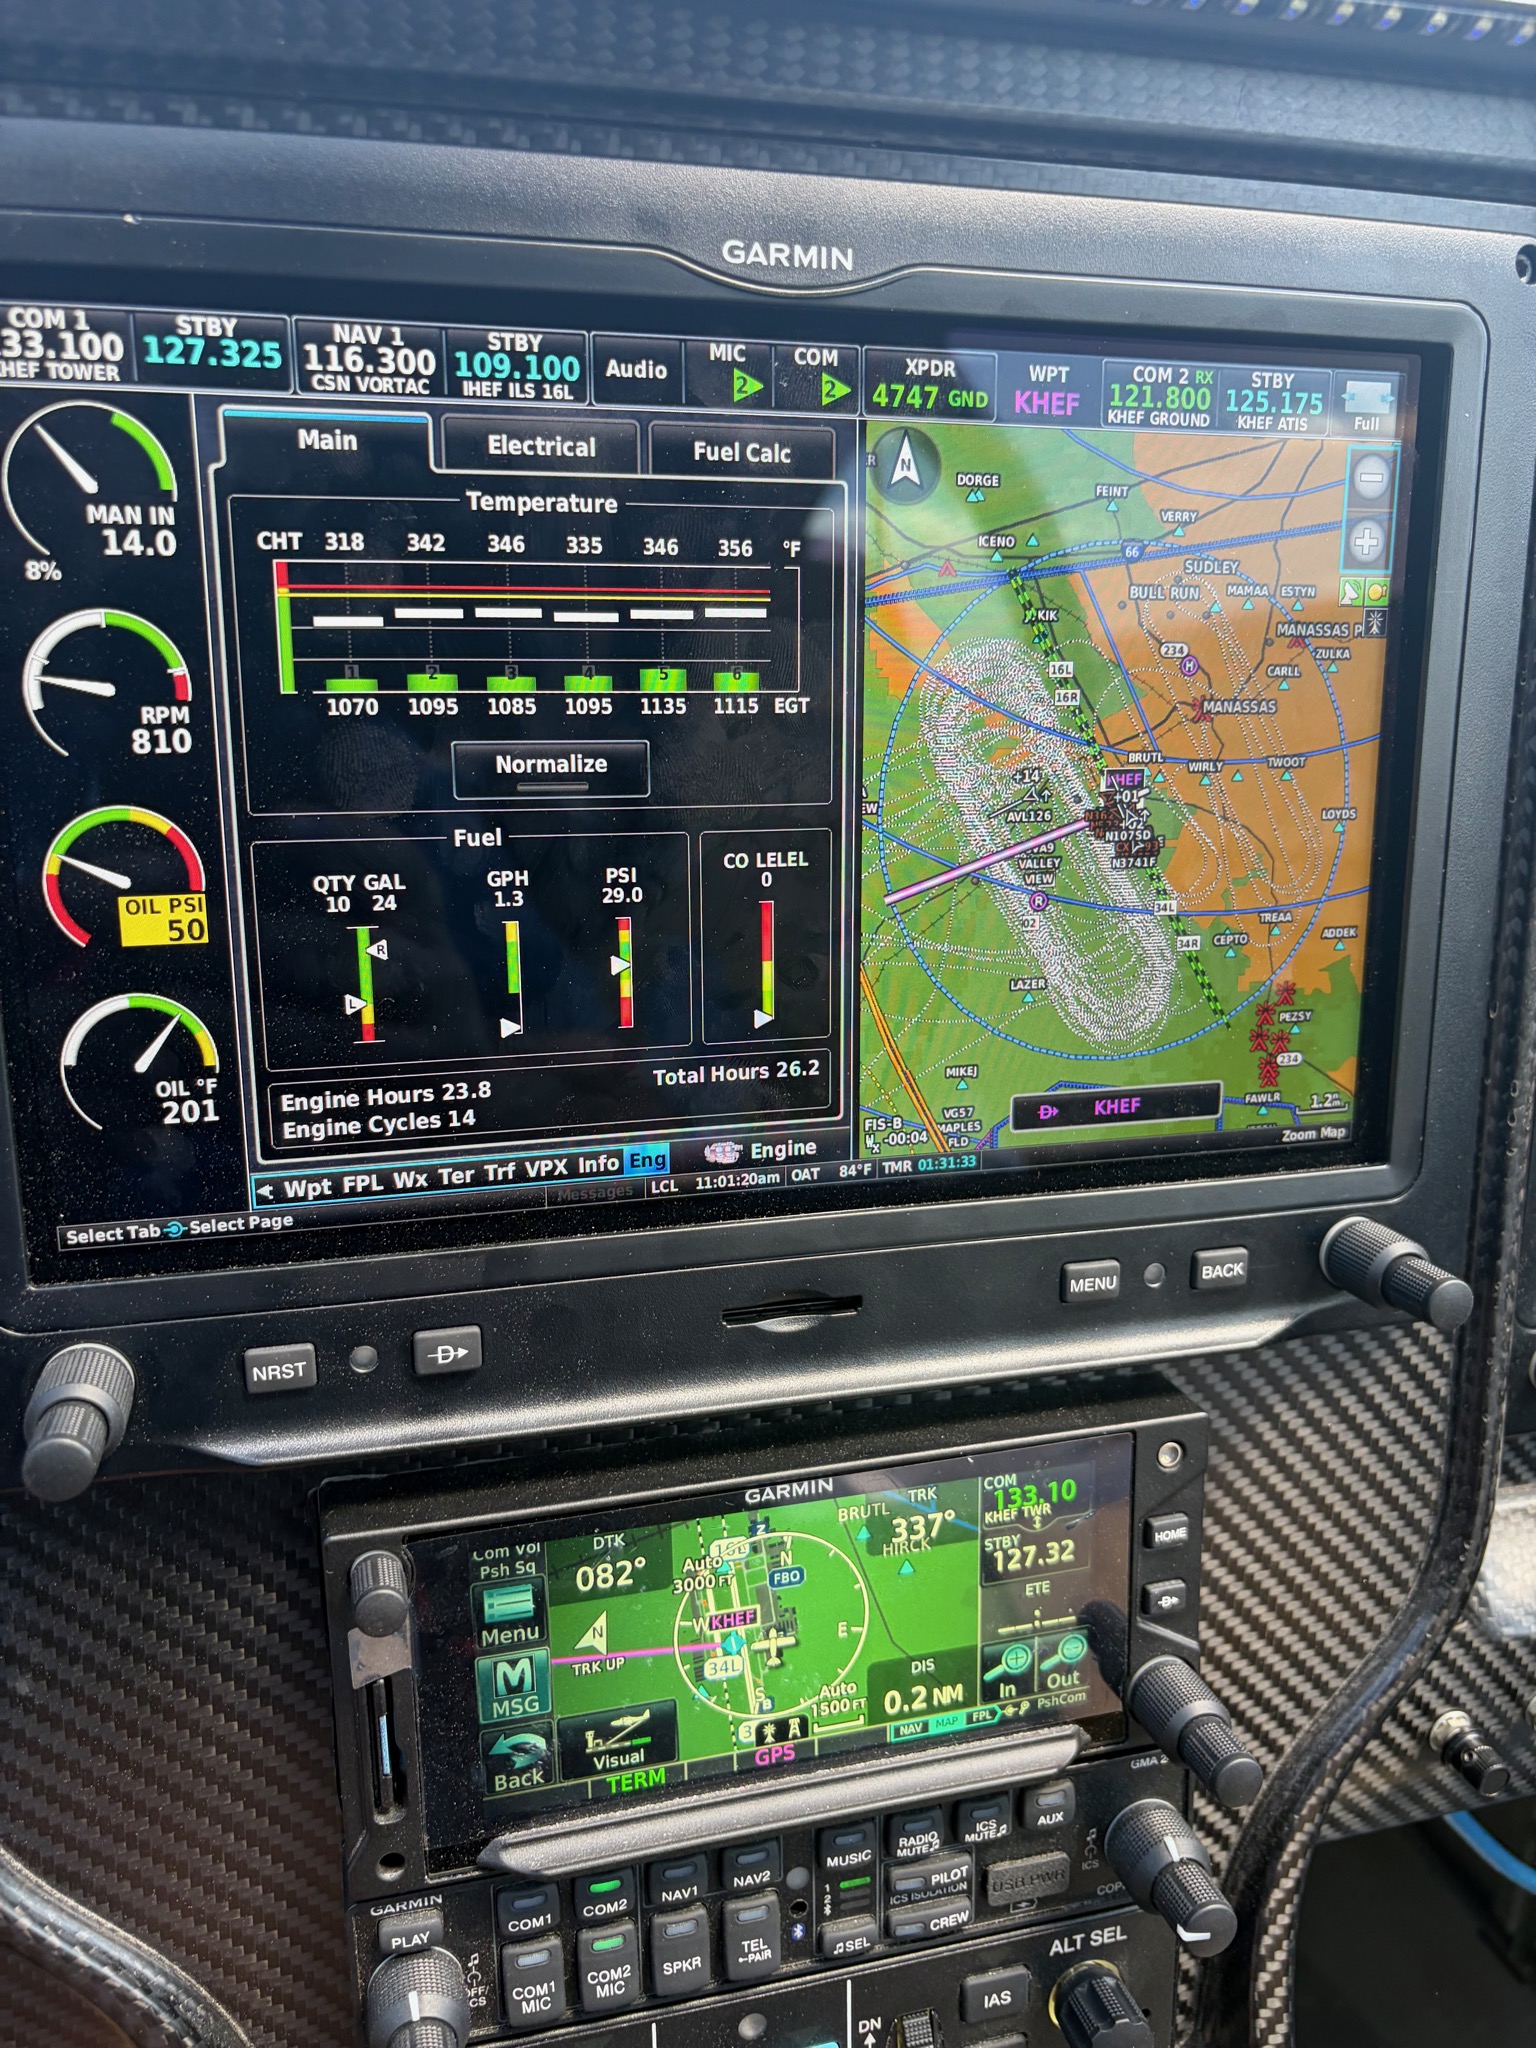
Two panel photos from the ramp after the flight — documentation of the final engine state, not in-flight readings:
G3X engine page after shutdown — the sortie’s fuel used and economy at a glanceG3X engine temperature page after shutdown — all six CHTs and EGTs, cooled down
Bottom Line
A clean set of cruise numbers (12+ nm/gal on the table), a tight ~0.6 gph GAMI spread that says the injectors are well-matched, cooling with margin to spare, and a verified-healthy attitude system. A productive morning’s worth of test cards. Next: the rest of the systems and performance cards.
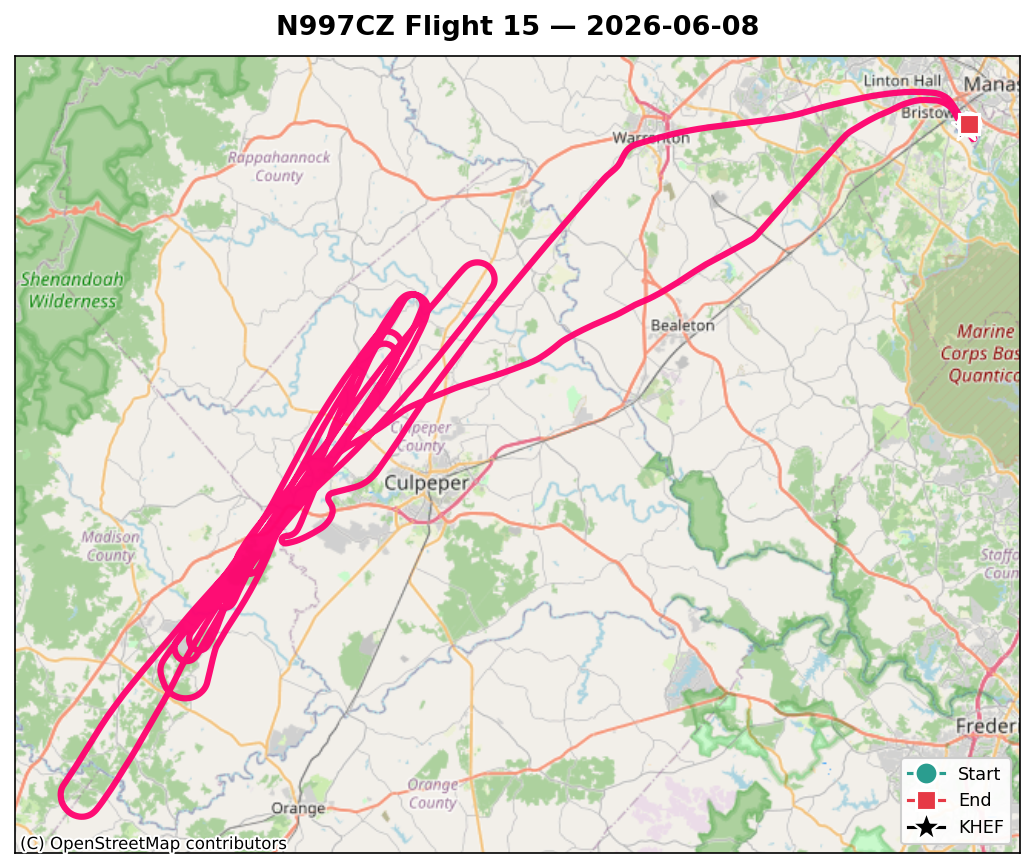
N997CZ Flight 15 ground track — the day’s flight over the Phase 1 test area
Flight 15 was the longest sortie of the program so far — three hours on the Hobbs — and it had one main job: measure how fast this airplane climbs, and at what speed it climbs best. That means a sawtooth: a stack of timed full-power climbs, each flown at a different airspeed, so the rate-of-climb-versus-speed curve falls out of the data.
It also carried over the one stall card Flight 13 didn’t get to — the accelerated/turning stall — so this post has a little of everything.
The Numbers
Date
2026-06-08 (morning)
Engine time
~2.9 hr (longest yet; ~3.0 hr Hobbs)
Engine hours
19.1 → 22.0
Max altitude
~7,700 ft MSL (7,961 ft GPS)
Fuel used
36.1 gal (totalizer) — matched the truck receipt (36.40 gal) to 0.3 gal
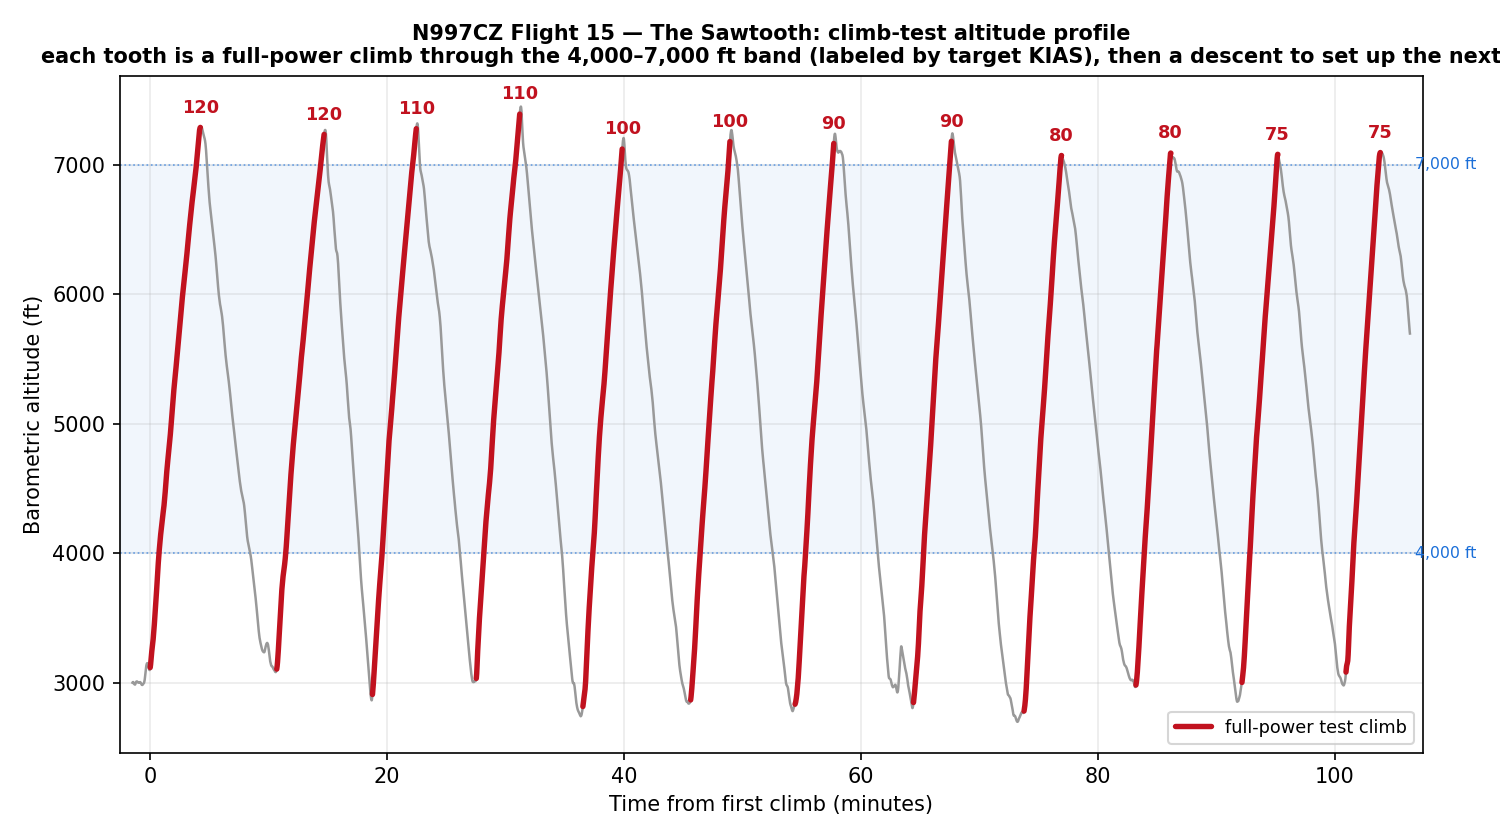
The plan: two full-power climbs at each of 120, 110, 100, 90, 80, and 75 KIAS — twelve timed test climbs in all — each one taken through the same 4,000-to-7,000 ft band so the runs are directly comparable. Flown back to back, the altitude trace draws the maneuver’s namesake: a row of teeth, each a full-power climb up through the band followed by a descent to set up the next.
Flight 15 climb-test altitude profile — the literal sawtooth: each tooth a full-power climb through the 4,000–7,000 ft band, labeled by target KIAS
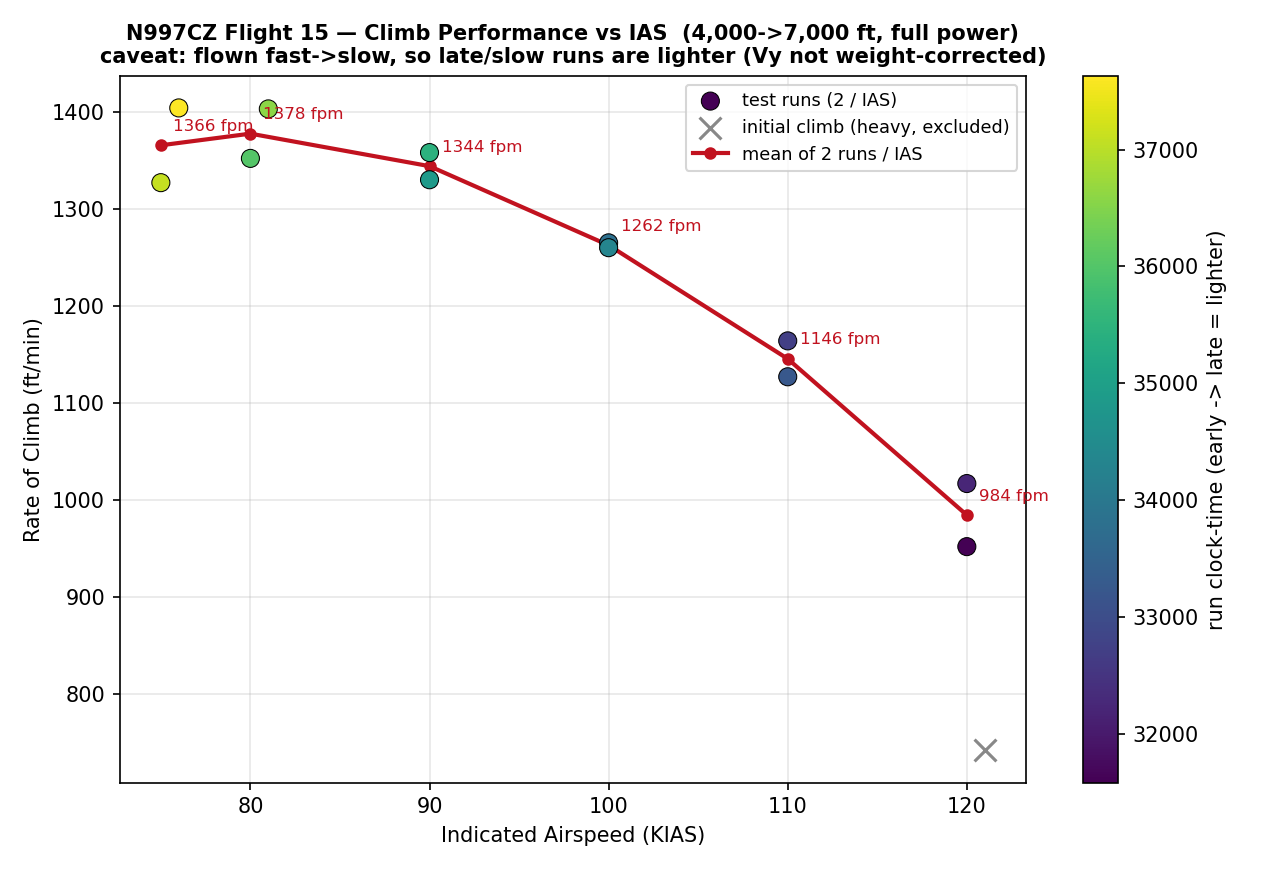
Timing each of those climbs gives the headline result — rate of climb against indicated airspeed:
Rate of climb vs indicated airspeed — raw sawtooth result (weight-biased; see text)
Read the raw numbers and the airplane looks like it climbs best slow: roughly 1,000 fpm at 120 KIAS rising to ~1,470 fpm near 80 KIAS. But there’s a catch, and it’s an important one. The runs were flown fast-to-slow over two hours, so by the time we got to the slow climbs the airplane was lighter — it had burned an hour-plus of fuel. A lighter airplane climbs better, so some of that “80 knots is best” result is really just “the airplane weighed less by then.”
The honest takeaway: the raw best-rate speed sits around 80 KIAS, but after correcting for the weight change, Vy is more likely up around 85–90 KIAS. Pulling the clean, weight-normalized Vx/Vy out of this dataset is a data-reduction job still on the bench — a good subject for its own post.
Cooling Held
Climb testing is where you find out whether your cooling can take sustained full power. The card set hard limits — back off if any CHT hit 420 °F, level off and enrich at 450 °F. We never got close: every climb topped out between 366 and 411 °F, with Cylinder 5 the hottest (411 °F), exactly as the air-dam canary from earlier flights predicted. No aborts, plenty of margin.
The Carried Stall
Before the climbs, we cleaned up unfinished business from Flight 13: the accelerated / turning stall (card 15-1). Three banked breaks in each direction at about 25° of bank, breaking around 60–65 KIAS with the nose up and the G unloaded at the break. Textbook, and the last stall card in the deck is now checked off.
Cabin CO stayed benign all flight (peak 2 ppm), and the new overhauled AHRS #1 behaved — though the other attitude unit had a tell on this flight, which is a story told in full in the AHRS post.
After Shutdown
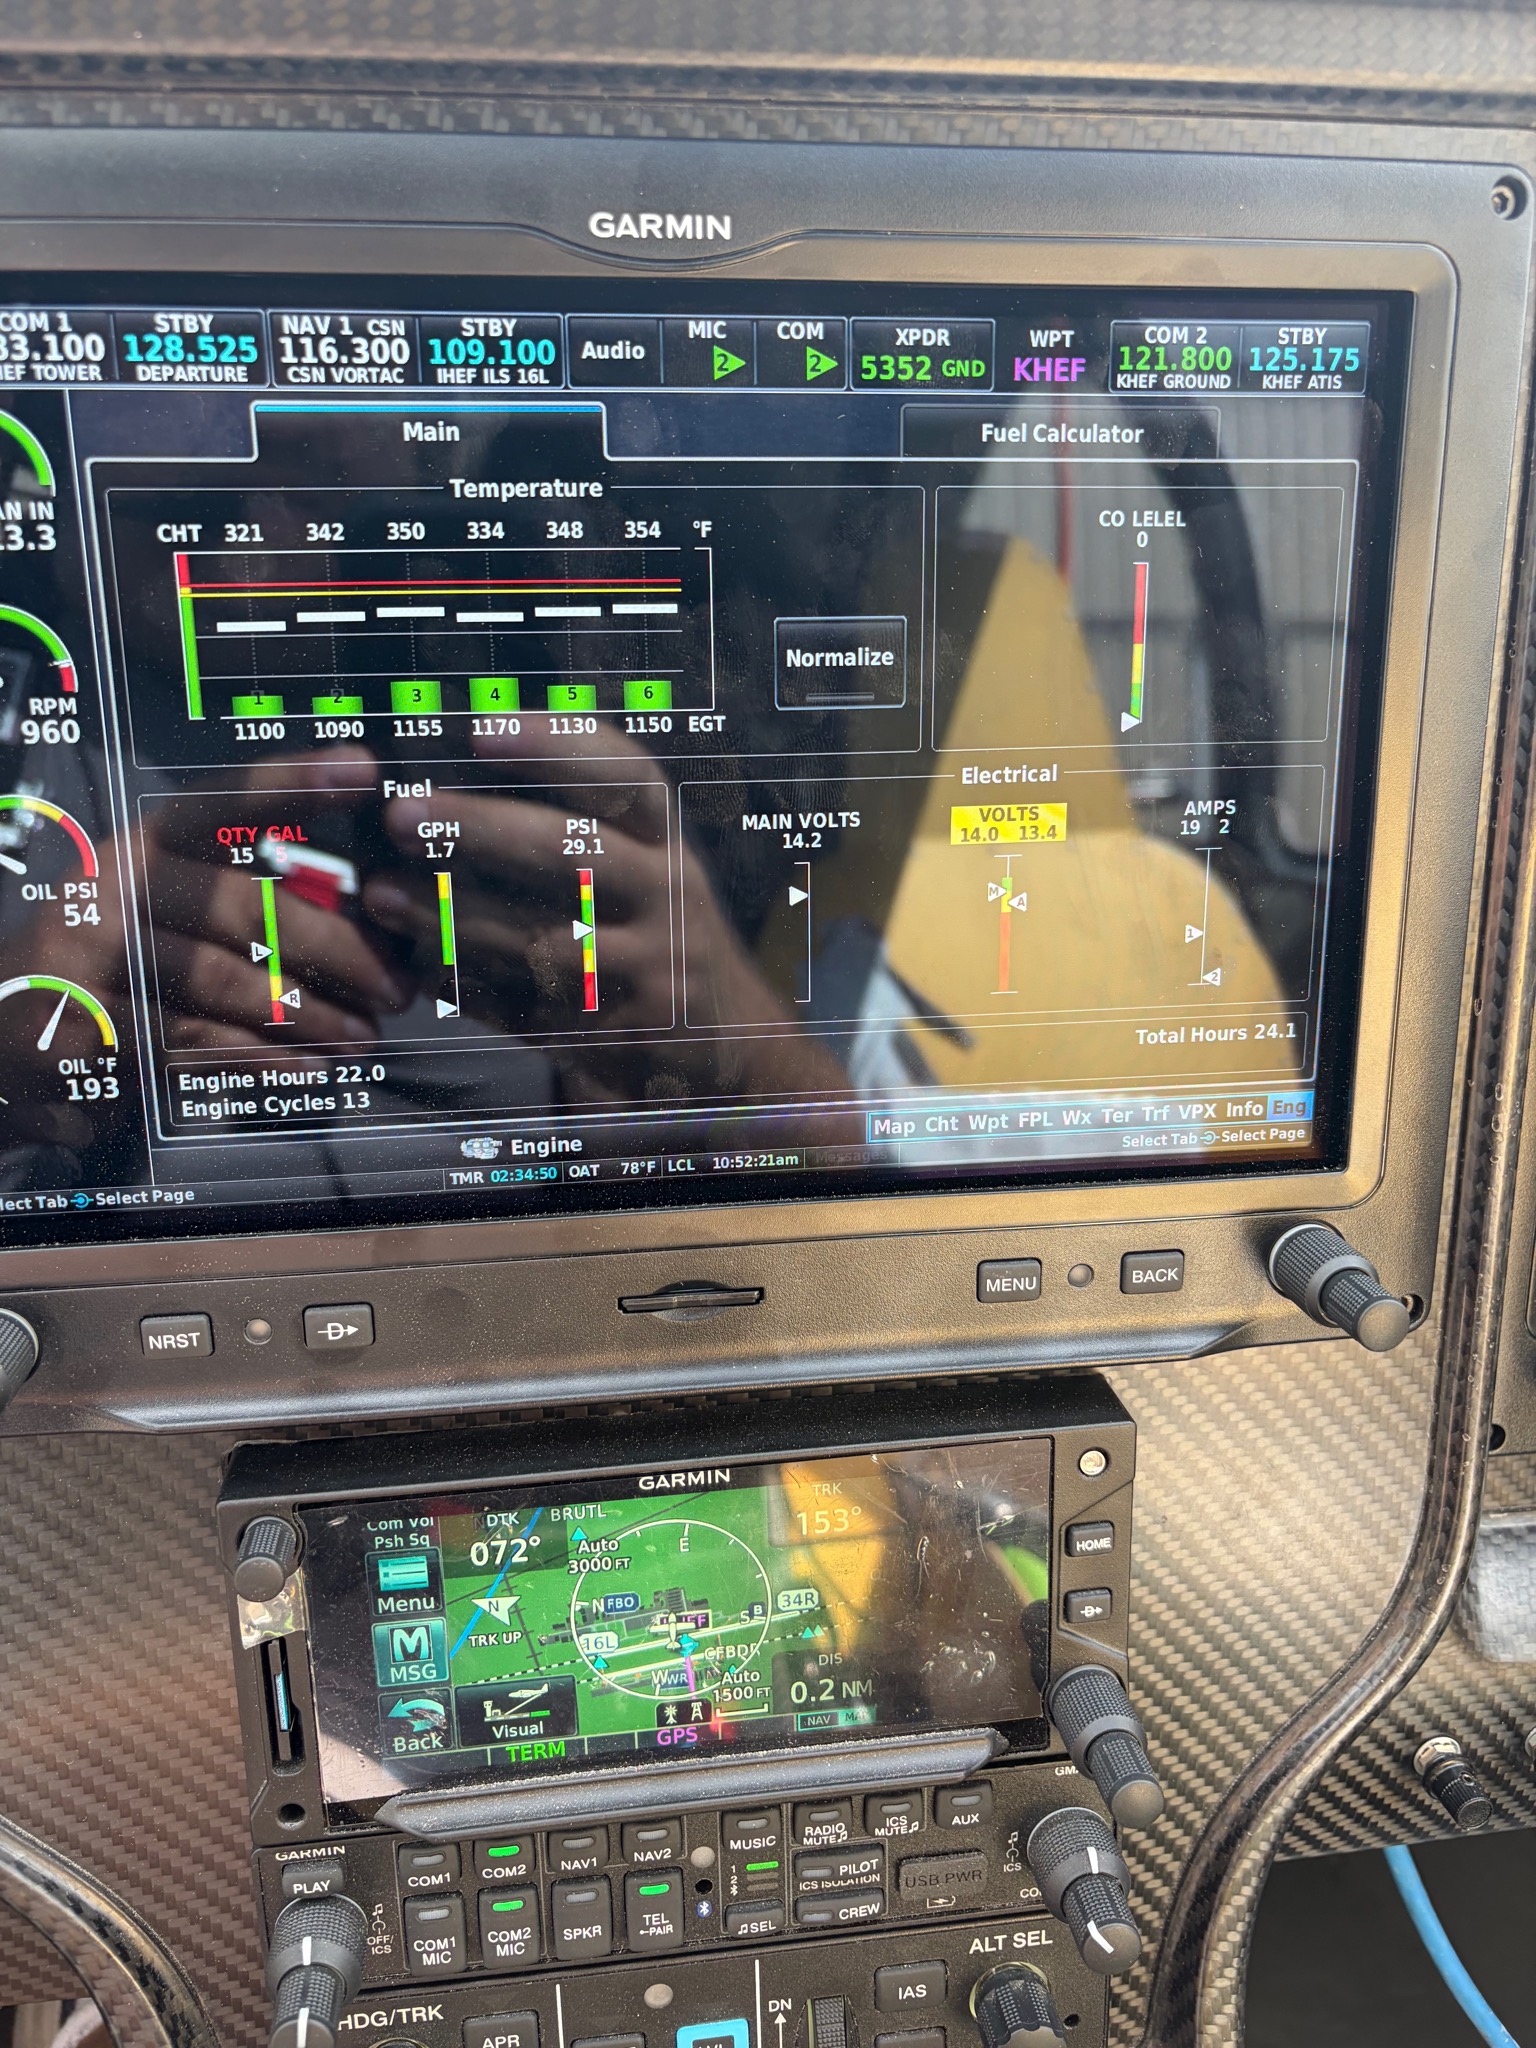
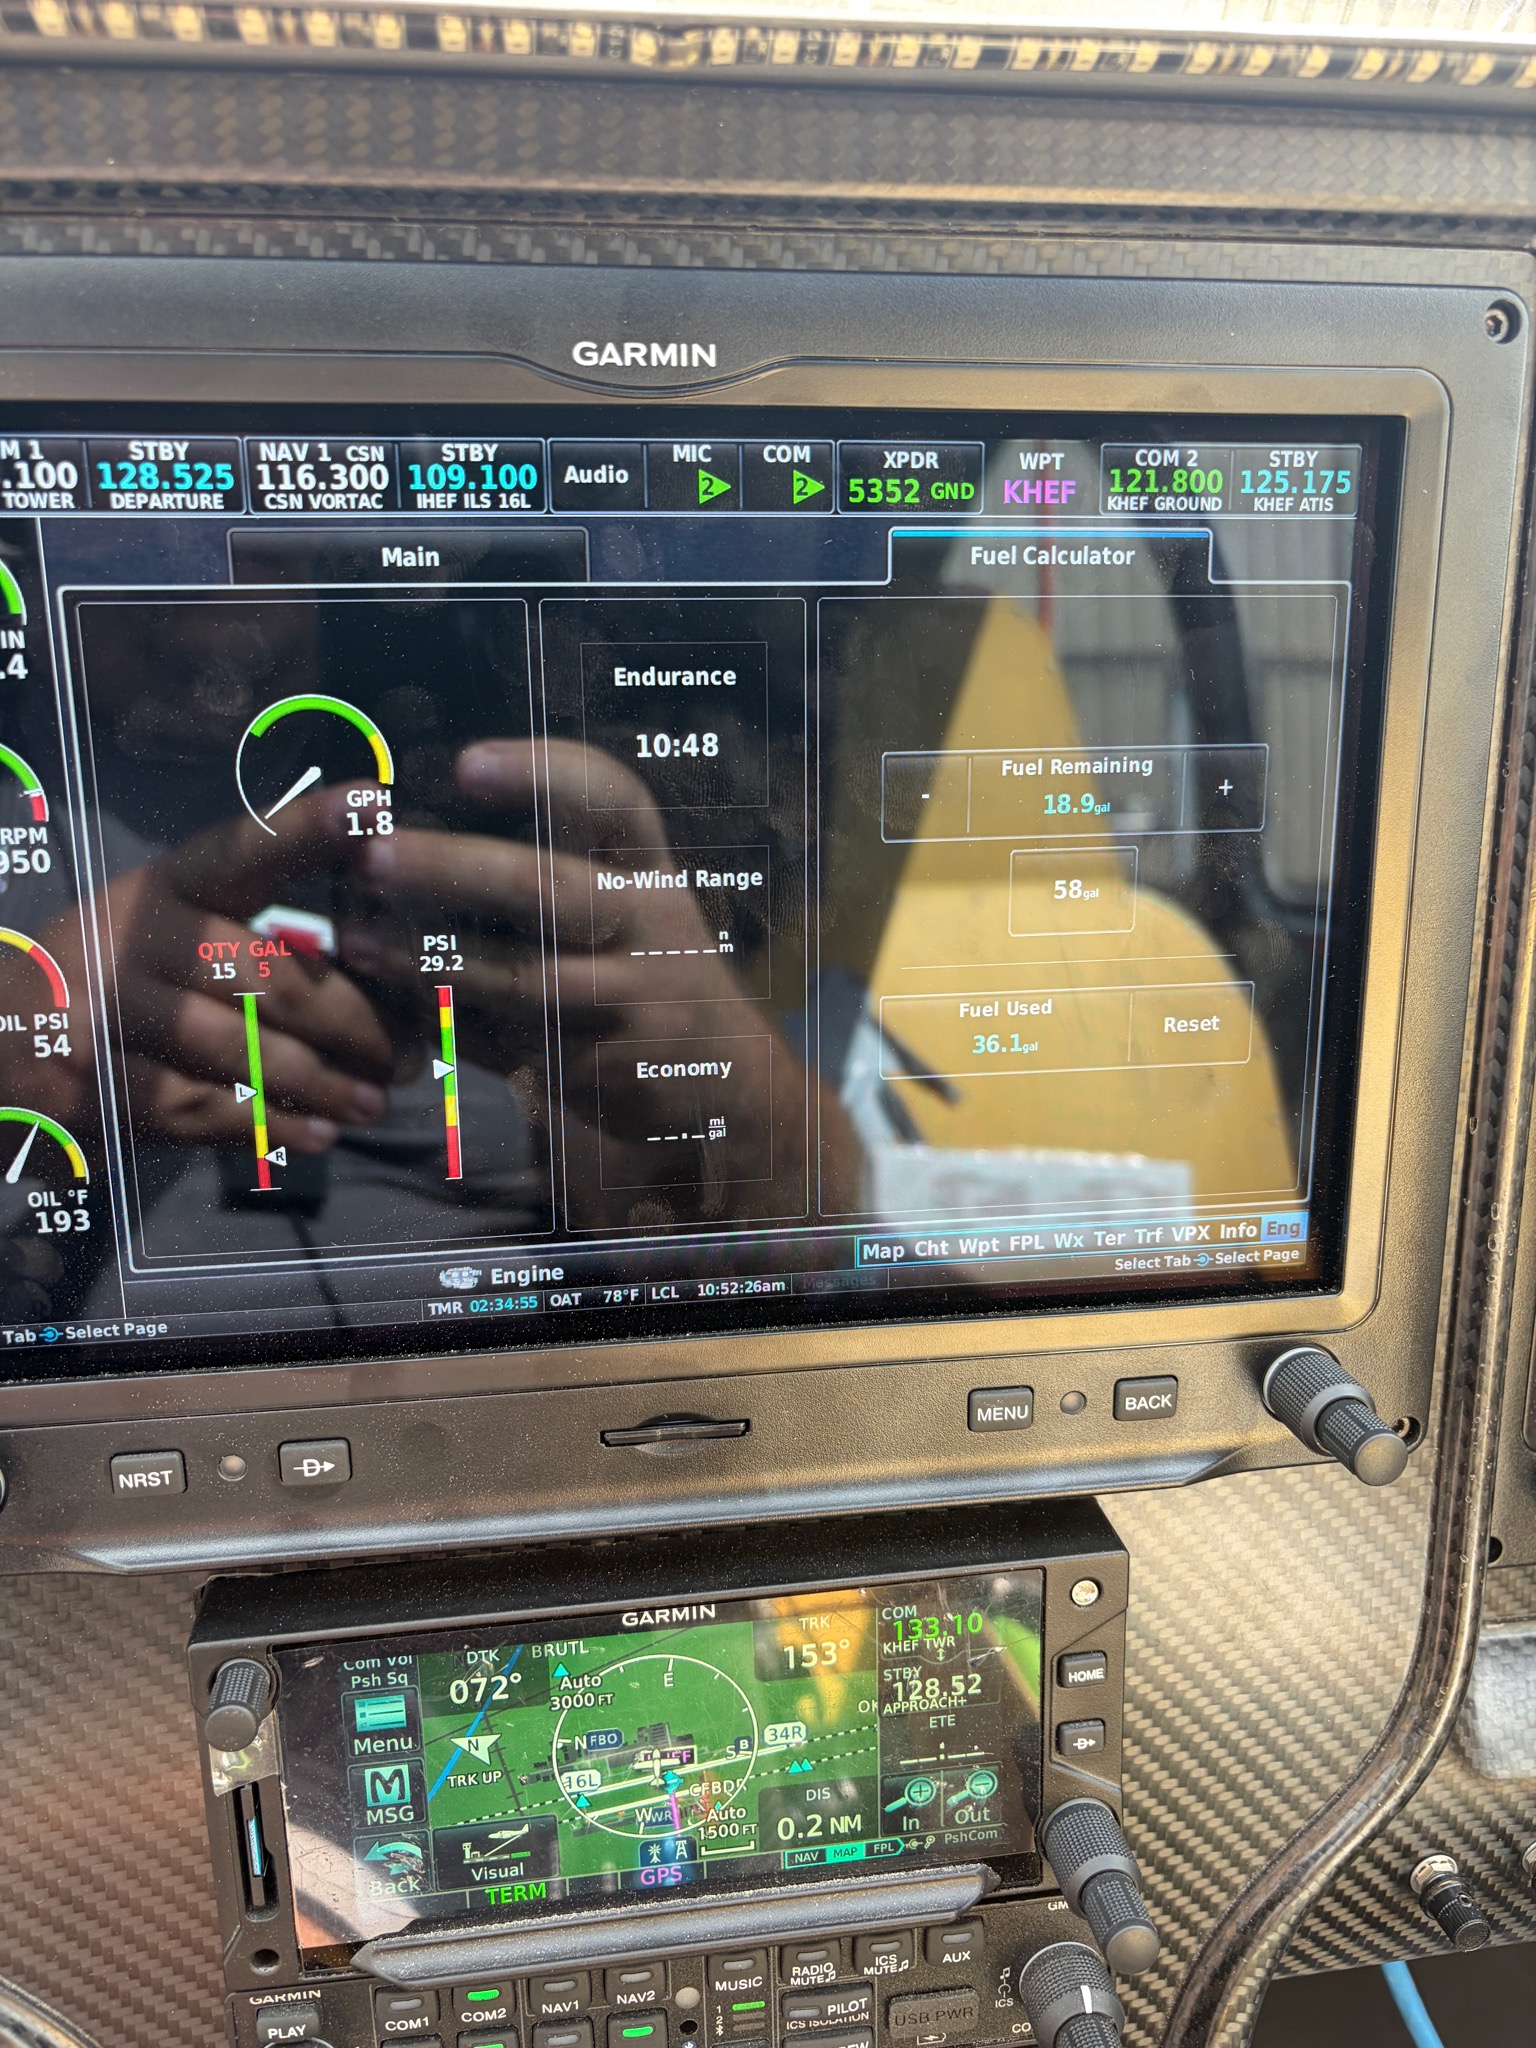
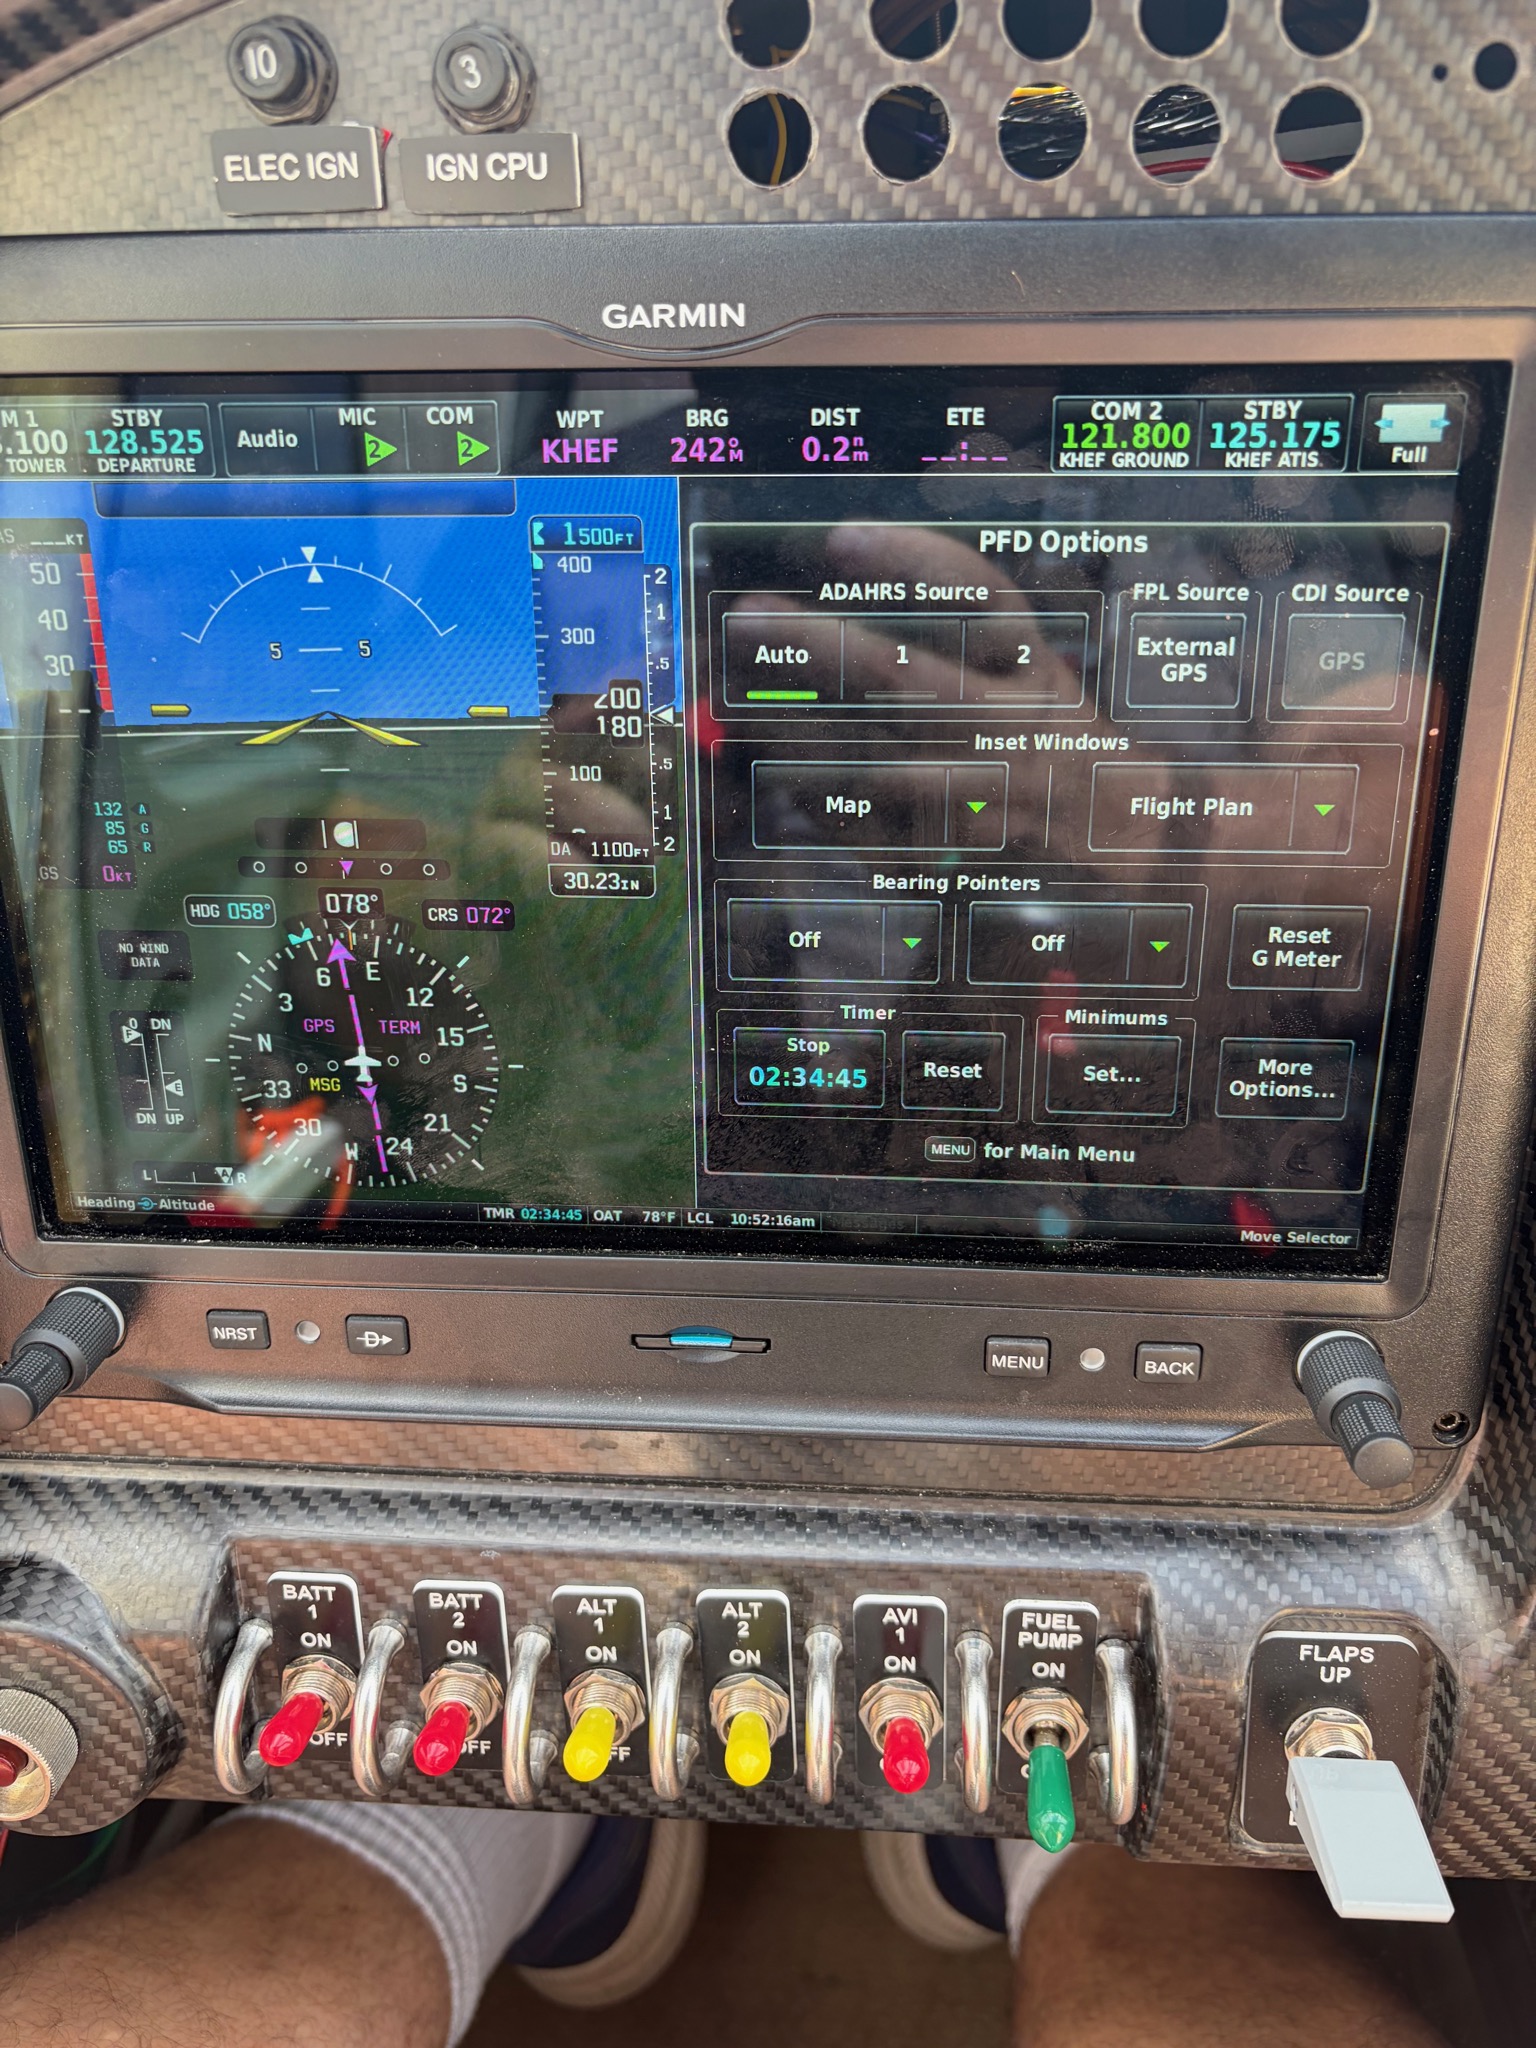
A few panel photos from the ramp after the flight — documentation of the day’s totals, not in-flight readings:
The G3X engine page after shutdown — CHTs already settling into the 320s–350s following the three-hour sortieThe Fuel Calculator at shutdown — 36.1 gallons used, matching the truck receipt to a third of a gallonThe PFD’s ADAHRS source page at shutdown — three attitude sources, all in agreement at the end of a long day
Bottom Line
Three hours, twelve timed climbs, a carried stall finished, and cooling that never blinked. The sawtooth is in the can; the weight-corrected Vx/Vy reduction is the homework. Next up: cruise performance and leaning.
Ground track for Flight 13 over the Phase 1 test area.
Every flight test program has a day where you stop sneaking up on the stall and just go fly it. For N997CZ, that was Flight 13. The slow flight and first banked stalls on Flight 12 had shown the airplane was honest at high angle of attack; this flight was about systematically documenting where the wing quits — clean, with flaps, and with power on — and doing all of it with a lot of sky underneath.
It was also the flight that finally set the airplane free of round numbers: a new program-high altitude of 11,520 ft MSL (12,069 ft GPS).
The Numbers
Date
2026-06-07
Engine time
~2.2 hr
Distance
233.3 nm (GPS path)
Fuel used
24.1 gal (totalizer)
Engine hours
16.2 → 18.3
Max altitude
~11,520 ft MSL (12,069 ft GPS) — new program high
Cruise OAT
+67 °F (warm day)
Loading
solo, light weight
Cruise mixture
leanest yet — ~11.5 gph
The Card Deck
Flight 12 only got partway through the stability cards before the slow-flight work used up the morning, so this flight’s deck rolled the leftovers in with the stall series — eight cards in fly order: area set-up, steady-heading sideslips, spiral stability checks, then the pre-stall set-up and recovery drill, and finally the stalls themselves — 1-g clean, full-flap, and power-on. (The last card, accelerated/turning stalls, didn’t get flown before fuel and the warm afternoon said go home — it carries forward.)
The sideslips and spiral stability points were flown and are sitting in the log waiting for their own data reduction — a future post once the numbers are out.
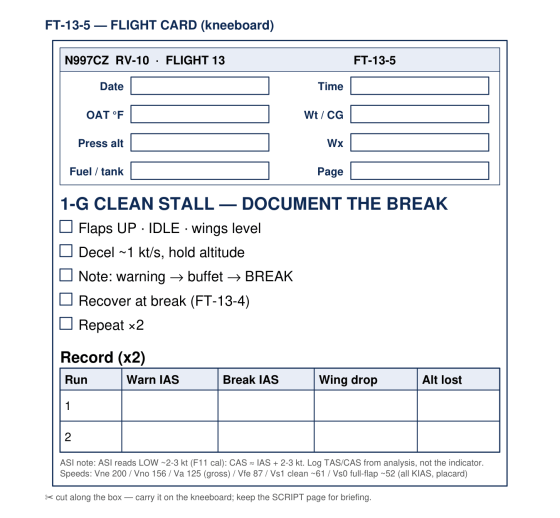
The full 16-page deck — a briefing script page for each card plus a boxed, cut-out kneeboard card for the cockpit — is here: Flight 13 test cards (PDF). Here’s one from the deck, the 1-g clean stall:
The FT-13-5 kneeboard card — 1-g clean stall, document the break.
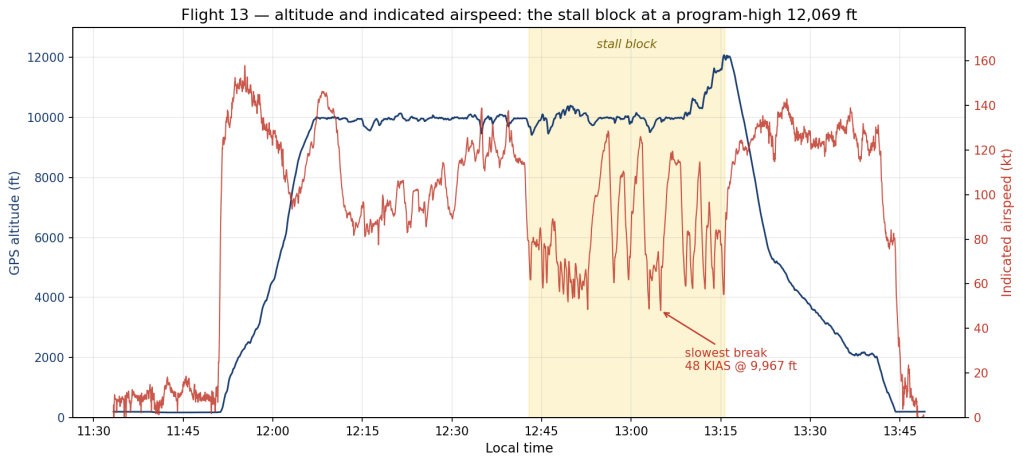
The Stall Block
Altitude and indicated airspeed vs time — the shaded block is 33 minutes of stall work, ending with the climb to the program-high 11,520 ft MSL (12,069 ft GPS).
The profile chart shows the structure: climb out of Manassas, stability work around 10,000 feet, then a sustained 33-minute stall block — that dense comb of deceleration spikes in the red trace, each one a deliberate walk down to the break and a recovery. Toward the end of the block the airplane steps up and up, topping out at 11,520 ft MSL (12,069 ft GPS) for the power-on series, then a long descent home.
The headline numbers, all flown solo at light weight:
Series (engine-verified)
Break
Notes
Power-off, early series
52–58 KIAS
idle/low power, ~10,000 ft — likely the clean (flaps-up) cards, per fly order
Power-off, later series
~48 KIAS
three events, 48.0–48.7, idle/low power — likely the full-flap cards, per fly order
Power-on (departure)
55–59 KIAS
16–18″ MAP / ~2,500 RPM, +14 to +18° pitch — verified from engine data
A word on how those rows are labeled, because honesty matters more than tidiness. The flap-position sensor is one of the program’s open squawks — this flight’s log records raw counts from −521 to +9, which is to say, nothing usable — so no row above can claim a data-verified flap setting. What the data does verify is power: the engine channels cleanly separate five power-on breaks (16–18 inches of manifold pressure, 2,500 RPM, nose up +14° or more) from seven power-off breaks at or near idle. The flap attribution rests on the card fly order — the clean stalls were scheduled before the full-flap ones — plus a physics cross-check: flaps lower the stall speed, and sure enough the later power-off series broke a good seven knots slower than the earlier one. Likely, not proven, until the new flap sensor goes in.
The numbers also pass the placard test once you account for weight. The placarded stall speeds at gross are about 61 knots clean and 52 with full flaps; stall speed scales with the square root of weight, and this was one pilot and partial fuel, far below gross. Scale the placard numbers down and you land almost exactly where the airplane did: high-50s breaks for the (likely) clean series, 48 for the (likely) full-flap series. The G-trace adds one more correction — the breaks happened partially unloaded, 0.74–0.88 G, which reads lower still. And through all of it the airplane behaved: buffet warning, a straight-ahead break, conventional recovery, every time.
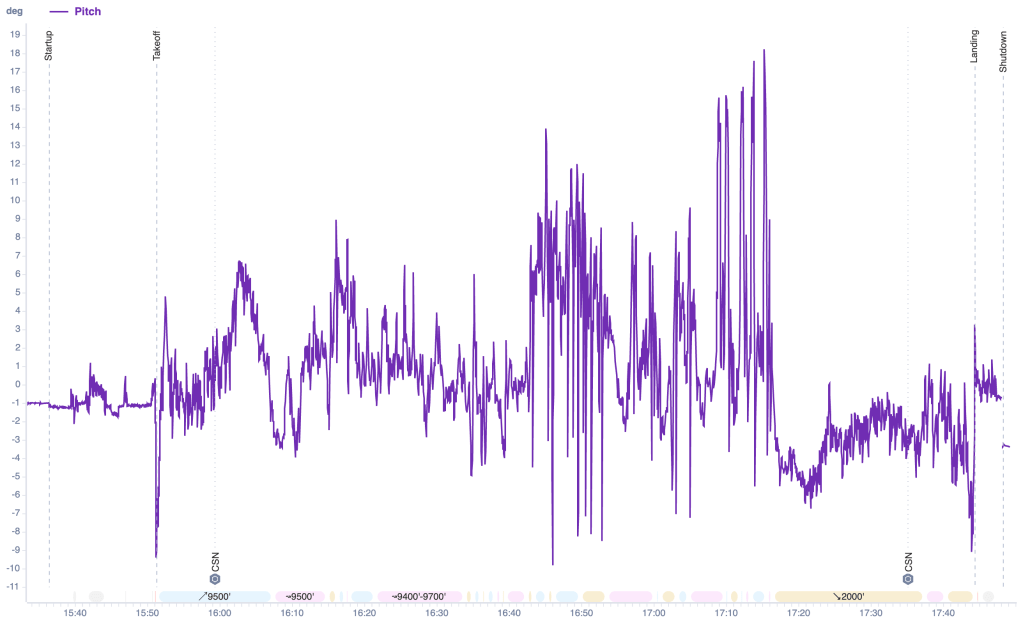
FlySto’s pitch trace makes the hour of stall work visible at a glance — every tooth in that comb is a nose-up walk toward the break and the nose-drop after it, and the tall +14 to +18° peaks late in the block are the power-on series, right on the card’s target attitudes:
FlySto’s pitch chart for Flight 13 — every tooth in the comb is one stall cycle; the +14–18° peaks are the power-on series.
One more layer from Flight 11’s calibration work: at these speeds the airspeed indicator reads about a knot and a half low, so calibrated break speed is closer to 49–50. Every knot of that bookkeeping matters when these numbers eventually set the approach speeds.
Can You See the Buffet in the Data?
The pre-stall buffet is unmistakable in the seat — the airframe starts talking to you well before the break. A fair question is whether the data logger hears it too. The answer: yes, faintly. The G3X logs at 1 Hz, and real airframe buffet shakes at several cycles per second or more, so the log catches only an aliased, heavily muted echo of what the pilot feels. But it’s there: in eleven of the twelve stall events, the roughness of the normal-acceleration trace climbs to two to five times its smooth-air baseline in the final seconds before the break.
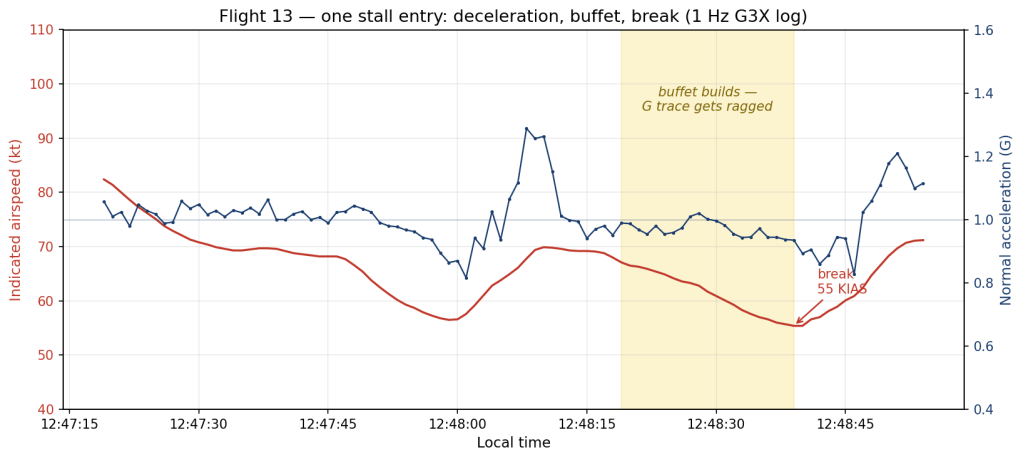
One stall entry from the block — airspeed bleeding down, the G trace fraying in the buffet window, the break, and the recovery.
The chart above is one entry from the block: airspeed bleeding down, the G trace starting to fray in the shaded buffet window, the drop at the break, and the firm recovery pull after. The amplitudes look small — a few hundredths of a G — but remember the sampling: the cockpit experience is a much louder version of what survives into a once-per-second log.
Engine: Leanest Cruise Yet, and a Plot Twist in the CHTs
The mixture story keeps marching: median cruise fuel flow was ~11.5 gph, the leanest of the program — a long way from the 18–23 gph full-rich break-in flights.
FlySto’s CHT chart for Flight 13 — one climb-out peak brushing the caution band, then a busy green-band sawtooth through the stall work.
The FlySto chart shows the whole flight: one hot moment on the climb-out where the pack peaks just over 420 °F, brushing the caution band, then a busy, healthy green-band sawtooth as the stall work cycles power up and down for an hour. The plot twist is which cylinder topped the chart: cylinder 2 at 422 °F — not cylinder 5, the climb-cooling canary from the last three flights (it logged 419). One warm-day flight isn’t a trend, but the ranking shuffle is noted and goes in the watch file.
The CO Detector Read Zero — Which Is Suspicious
Cabin CO logged 0 ppm for the entire flight. Taken at face value that would be the best result of the program — but every slow-flight-heavy flight from 6 through 12 showed at least a few ppm, and this was the most aggressive high-AoA profile yet. A sensor that suddenly reports perfect silence on exactly the profile that always made it talk is more likely asleep than victorious. Verifying the detector is on the squawk list; until then, this flight’s CO data gets an asterisk, not a trophy.
Also On This Flight
A freshly overhauled attitude unit went into the panel the day before this flight — and through an hour of stalls and high-AoA work, the attitude display never so much as twitched. By my count that makes this the first flight in the airplane’s life with no attitude-horizon tumble — the cross-source roll disagreement that hit ~136° the day before stayed under 10° through all of it, and it has stayed that way since. (The story has a sequel brewing: the #2 attitude source has started miscomparing against the newly healthy #1.) The full saga, and the data behind it, is getting its own post.
Manual flying practice: about an hour of the flight was hand-flown — stall work is hand-flying by definition, and the autopilot got the cruise legs.
Squawks
Accelerated/turning stall card not flown — carried forward to a future sortie.
CO detector read zero all flight — verify it’s actually alive before trusting the result.
Flap position indication still broken — and it stings more on a flight like this one, because it leaves the stall-speed-versus-configuration record resting on the card sequence and pilot recollection instead of data. Replacement sensor is on the parts list.
Bottom Line
Flight 13 closed out the bread-and-butter stall series: power-off breaks walking down from the high 50s to 48 knots indicated as the flaps (most likely) came out, power-on breaks in the high 50s — all of it right where the placard predicts once you do the weight math — honest manners throughout, and a new program-high 11,520 ft MSL (12,069 ft GPS). The engine ran its leanest cruise yet, cylinder 2 stole the hot-cylinder crown for a day, and the CO detector’s perfect silence earned suspicion instead of celebration. One card carries forward, and the stability data is in the can awaiting analysis. The envelope is opening up.
If you’ve been following the N997CZ journal, you’ll know that cylinder-head temperatures have been on my mind since the very first takeoff. Flight 1’s Cyl 1 peaked over 450°F before I’d even cleared the pattern, and from that moment on, every flight has carried with it a small cardiac event for me when I look down at the engine page on the G3X.
After ten flights and about 13 engine hours, I’ve finally pulled all of that CHT data into one place, run some regressions across it, and learned that a lot of what I thought I was seeing wasn’t quite right. This is the story of what the data actually shows — and where my initial interpretation broke down once I added one more variable.
Why CHTs Matter on a New Engine
For anyone new to all of this: cylinder-head temperature is the temperature of the metal at the top of each combustion cylinder, measured by a thermocouple right at the spark plug boss. Lycoming’s redline on the IO-540 is 500°F. The general guidance for break-in is to keep CHTs comfortably under 420°F during cruise and well clear of redline during climb, but more importantly to let the engine work: high power, full-rich mixture, no babying. The piston rings are seating against the cylinder walls during these first 25 to 50 hours, and that process needs combustion pressure and heat to happen properly.
The trade-off is that you’re running an engine hot, and you’re learning its baffling system, its idiosyncrasies, with no historical data to compare against. So you watch. And you write down what you see. And, in my case, you eventually pull it all into Python and start asking questions.
The Method: One Regression Per Cylinder, OAT Normalized
CHTs depend strongly on outside air temperature. A 70°F day produces materially hotter cylinders than a 40°F day, all else equal, just because the cooling air arriving at the baffles is hotter. So before I could see a meaningful “break-in” trend across ten flights spread over five weeks of spring weather, I needed to normalize for OAT.
I pulled the cruise window from each flight’s G3X log (filtered to RPM ≥ 2400 and altitude relatively steady), grabbed the OAT (°F) and the per-cylinder CHTs (°F), and fit a simple two-term regression for each cylinder:
CHT_cruise = a + b · OAT + c · flight_number
b tells me the OAT sensitivity (°F of CHT per °F of OAT — engineering rule of thumb is around 1.0). c is the break-in slope: how fast that cylinder is cooling off as the engine accumulates hours, after controlling for OAT.
I also kept the raw max CHTs flight-by-flight (peak during the climb), since climb is where the cooling system runs nearest its capacity and where any improvement in heat transfer would show up most clearly.
What I Thought I Was Seeing
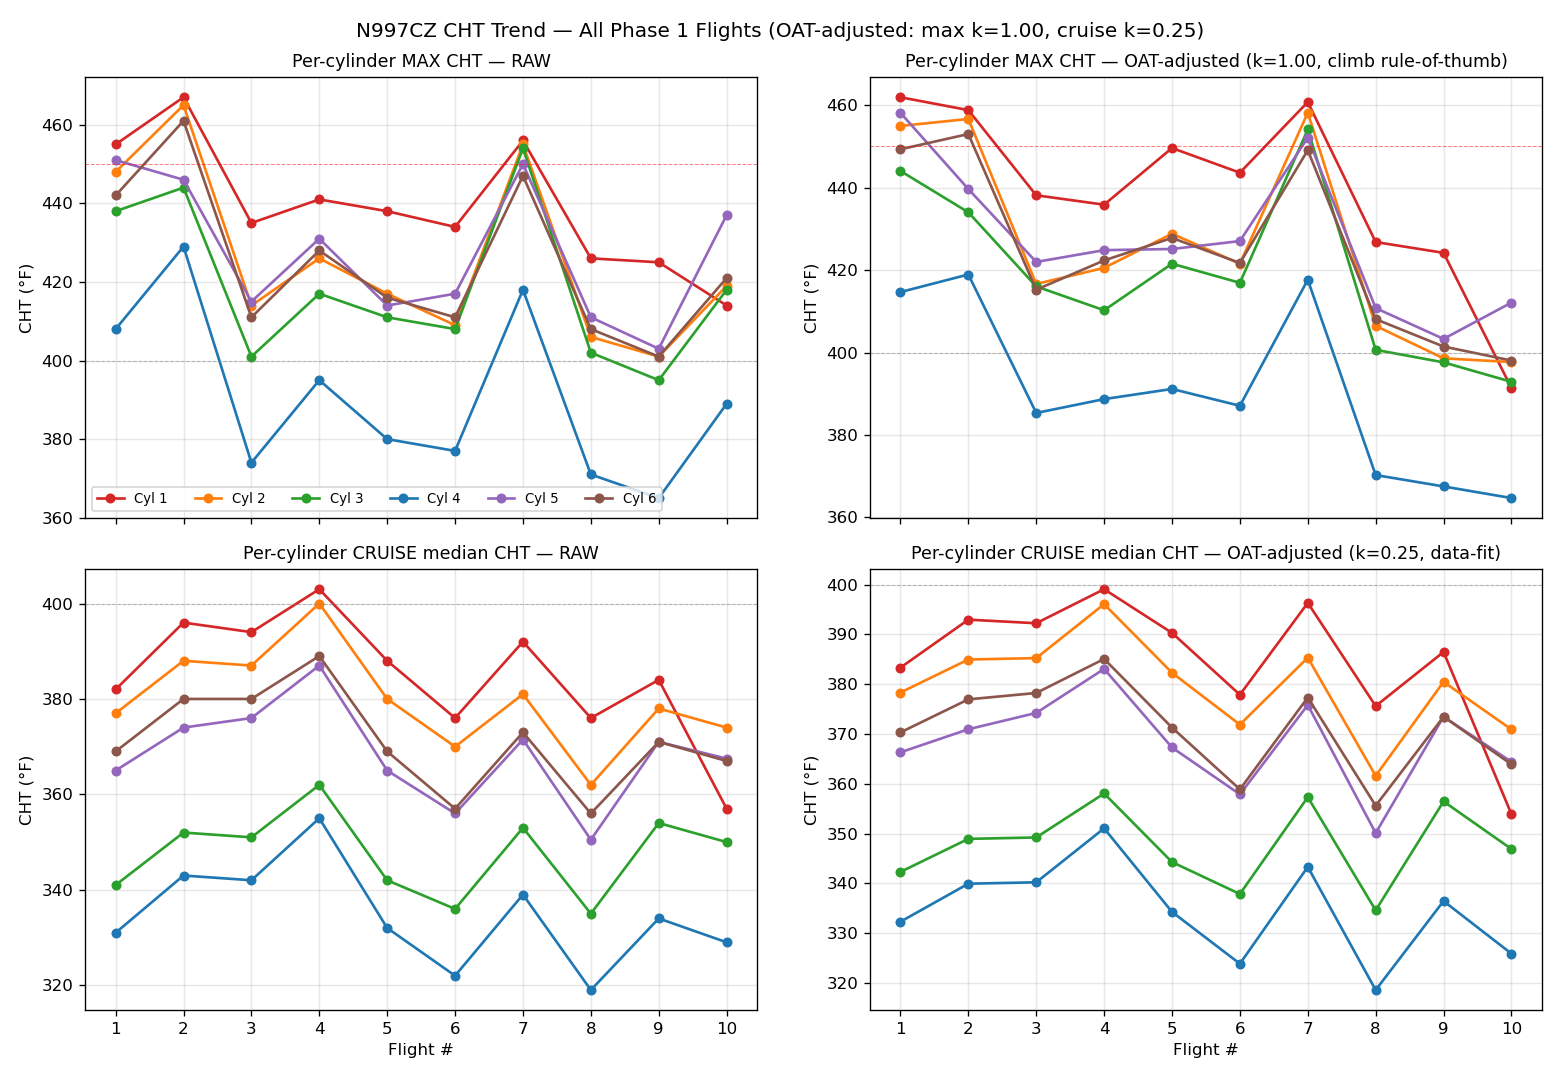
The first fit was across all ten flights, F1 through F10. The numbers looked beautiful:
Cyl 1: c = −2.75 °F/flight. Hottest cylinder. Cooling fastest.
Cyl 2: c = −1.52 °F/flight.
Cyl 4: c = −1.31 °F/flight.
Cyl 6: c = −1.33 °F/flight.
That fits the classic break-in story so well. The hottest cylinder breaking in fastest. Rings seating. The cruise temps trending down at a measurable rate. I wrote it up, called the family in to admire the regression coefficients, and started drafting a post about how my engine was breaking in nicely.
CHT trend across all 10 flights, OAT-normalized cruise values per cylinder. Looks like clean break-in cooling. It isn’t.
Then I added one more variable.
The Thing That Broke the Story
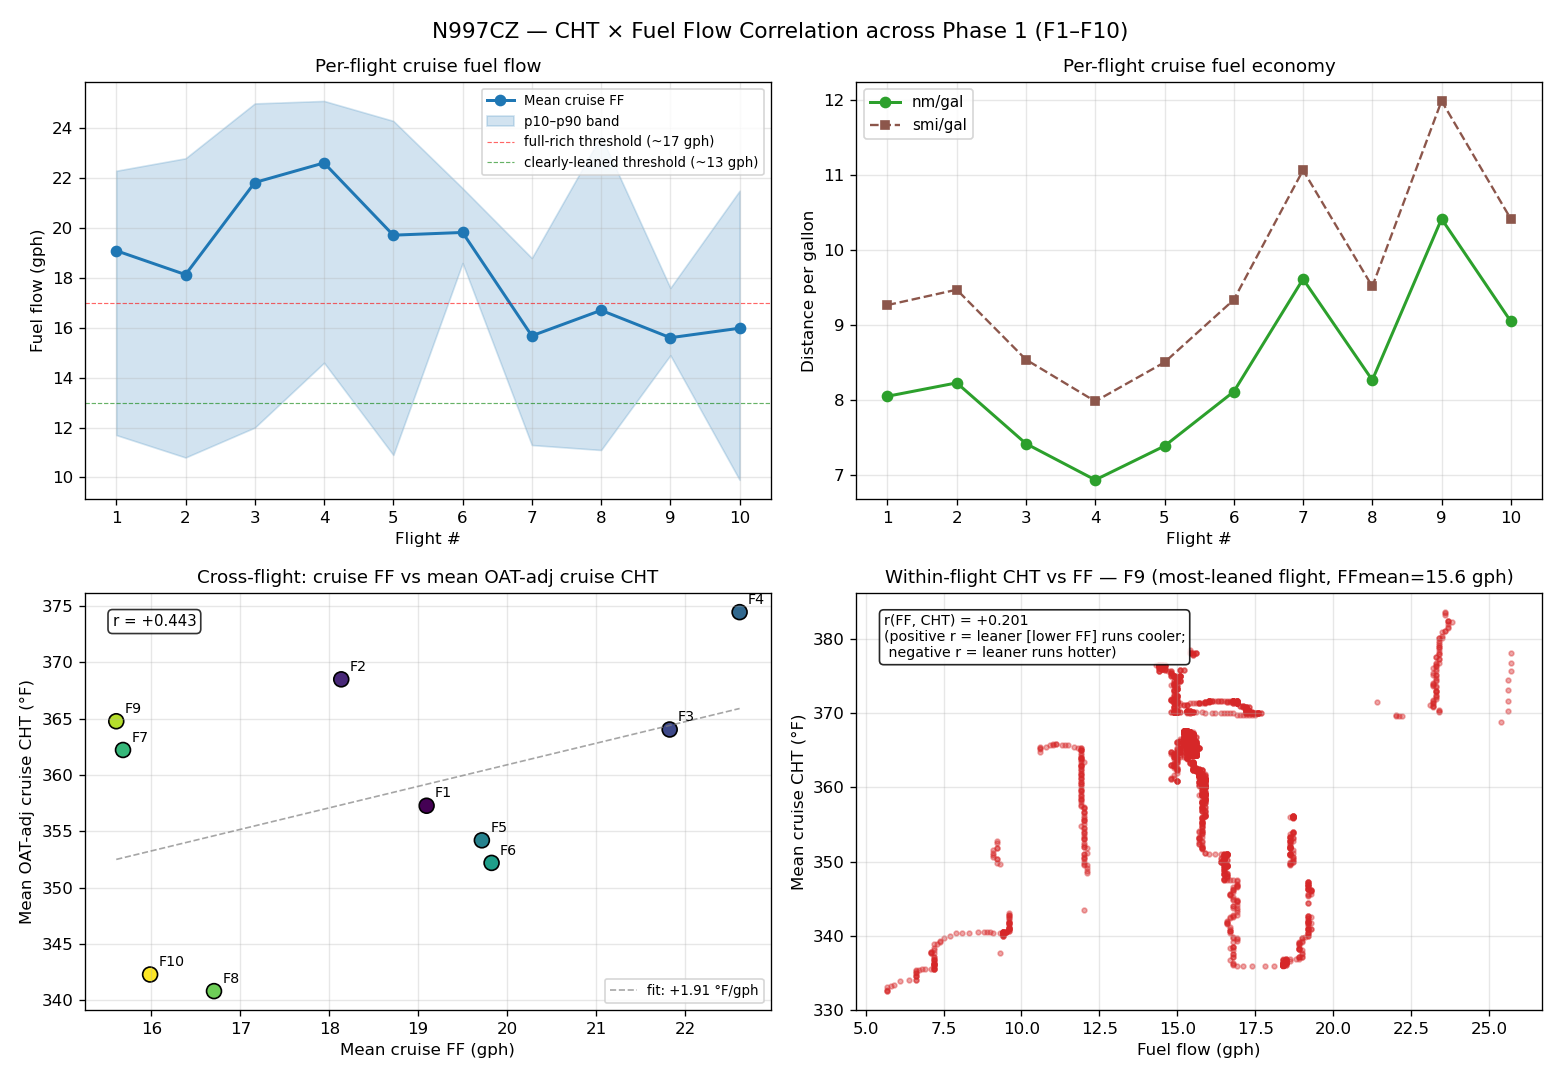
The variable was fuel flow. I’d been logging it the whole time, but I hadn’t pulled it into the CHT analysis. The thought was: what is each flight’s mean cruise fuel flow, and does it correlate with CHT in any obvious way?
Here’s what it looked like:
Flight
Mean cruise FF (gph)
nm/gal
F1
22.6
6.9
F2
19.5
7.5
F3
18.4
7.9
F4
20.3
7.2
F5
21.1
7.1
F6
19.83
8.11
F7
15.68
9.61
F8
16.4
9.9
F9
16.7
9.3
F10
15.6
10.4
Look at the step between F6 and F7. Mean cruise fuel flow dropped from 19.83 to 15.68 gph — a sharp single-flight transition — and fuel economy stepped from 8.11 to 9.61 nm/gal (+18%). Every F7+ flight runs leaner than every F1–F6 flight, without exception.
That step is exactly what it looks like: it’s where I started leaning the mixture. F1 through F6 were flown with the mixture at full rich, per the typical break-in playbook. By F7 — about 10 engine hours in — I’d decided I had enough data to start running a little leaner in cruise, and the fuel-flow numbers tell the story.
CHT vs fuel flow across the 10 flights. The sharp step at F7 is where I started leaning the mixture — the exact same step that was being smeared into a false “break-in cooling” trend by the all-flights regression.
Now look at what that did to CHTs. The F6 → F7 comparison, OAT-adjusted: cruise CHT went UP +10°F from F6 to F7 (352°F → 362°F across the cylinder array). That’s the textbook leaning signature — pulling the mixture leaner moves combustion peak temperatures closer to the cylinder head, and head temps respond.
In other words, my break-in regression across F1 through F10 was fitting a smooth line through what is actually two different operating regimes. The “cruise CHT is dropping” trend wasn’t break-in; it was 60–70% the F7 leaning step pulling the F7+ flights down toward a different equilibrium. The regression couldn’t tell the difference.
It gets worse. Flight 10 had another step change: I pulled the air dam in front of Cyl 1. That’s a physical change to the cooling baffling. Another shift in the operating regime, layered on top of the leaning regime.
Re-fitting on the Clean Range
Once you know about a regime change, you fit around it, not across it. So I re-ran the regression on F1 through F6 only — the clean, full-rich, no-air-dam-mod range — and the picture changed entirely:
Cyl 1 c = +0.29 °F/flight (was −2.75 in the all-flights fit)
Cyl 2 c = +0.37 (was −1.52)
Cyl 3 c = +0.35 (was +0.10)
Cyl 4 c = +0.02 (was −1.31)
Cyl 5 c = −0.02 (was −0.86)
Cyl 6 c = −0.67 (was −1.33)
Mean c = +0.06 °F/flight (was −1.28)
Cruise CHT break-in, in the full-rich regime, is essentially zero. The cylinders are not measurably cooling at cruise as the engine accumulates hours. The earlier “Cyl 1 broke in fastest at −2.75°F/flight” was about 60–70% the F7 leaning step plus the F10 air-dam mod. The actual break-in signal in cruise data, in the regime where break-in is supposed to be happening, is statistical noise.
And the OAT sensitivity that I’d been wondering about (the all-flights fit said b ≈ +0.25, way below the engineering rule of thumb of 1.0) snapped back into shape when I limited it to the clean regime: b ≈ +0.89 °F CHT per °F OAT in F1–F6 only. The rule-of-thumb is roughly right for this engine in full-rich cruise; the previous low number was suppressed by mixing in the leaning regime.
Where Break-In Actually Shows Up
So is my engine breaking in at all? Yes — but the signal lives in maximum CHTs (climb conditions), not in cruise.
Flight
Cyl 1 MAX CHT
F1
455°F
F2
442°F
F3
438°F
F4
438°F
F5
437°F
F6
434°F
That’s a −21°F drop over six flights for the hottest cylinder, in conditions where the cooling system is running near its capacity. That’s the break-in signature. Climb is where the engine is making the most heat per unit of cooling air; that’s where any improvement in heat transfer (or any small reduction in friction work) is going to be most visible.
The lesson: cruise has so much cooling margin that ring-seating doesn’t move cruise temps in any measurable way. If you want to see break-in in your CHT data, look at the climb maxes, not at cruise medians. I’d been looking at the wrong column.
Lycoming SI 1427C and the Leaning Mistake
While I’m being honest about what I got wrong: Lycoming Service Instruction 1427C explicitly says do not lean during break-in. I leaned at Flight 7, which was around 10 engine hours of total operation — earlier than the manufacturer recommends. The good news is that F8 and F10 don’t show any distress signature (no CHT excursions, no rough running, no oil consumption surprises I can see), so it’s probably fine.
But the cleaner path for the remaining ~12 to 15 hours of break-in is to go back to full rich at high power, and let the cylinders finish seating against the cylinder walls without me changing the operating point underneath them.
There’s a second piece of Lycoming guidance worth flagging: their actual gold-standard test for “is break-in complete?” isn’t CHT at all. It’s oil consumption. When per-hour oil add stabilizes at a low and consistent rate, the rings have seated. I haven’t been tracking oil consumption nearly carefully enough through these first 10 flights, and that’s a habit I’m going to fix going forward.
The F10 Experiment
I mentioned the F10 air-dam removal in passing — that deserves its own paragraph because the result is interesting.
Cyl 1 has consistently been the hottest cylinder on this engine, and the cylinder layout (Lycoming IO-540, right bank front to rear: 1 → 3 → 5; left bank front to rear: 2 → 4 → 6) puts it at the front of the right bank, where you’d expect it to be getting the freshest, coolest induction air. So why is it always the hottest?
One hypothesis was that the small air-dam baffle in front of Cyl 1 was redirecting too much cooling air past it (toward Cyl 3 and Cyl 5 deeper in the bank) and not onto it. So I pulled the air dam before Flight 10 to see what happened.
The result, OAT-adjusted, F9 → F10 deltas:
Cyl 1 cruise: −32°F. Cyl 1 max: −33°F. That’s about 23°F of extra cooling on Cyl 1 beyond what the other (control) cylinders saw. Strong, clean air-dam-removal signal.
Cyl 3 (right middle, downstream of the redirected air): no penalty. Cruise tracked the control group; max actually dropped slightly.
Cyl 5 (right rear, downstream): the canary. Cruise tracked the control group. But max Cyl 5 went UP +9°F while every other cylinder went down 0–10°F. That’s a 12–18°F relative warm-up in the high-stress climb regime, on the cylinder that’s furthest downstream on the right bank.
So the air dam was doing real work — keeping enough air flow over to the back of the right bank to keep Cyl 5 happy during climb. F11 will be the test. If Cyl 5 max stays elevated relative to the trend, that’s a real climb-cooling cost and I’ll need to think about a partial air dam or a different baffle modification. If Cyl 5 pulls back into line, F10 was noise on a small sample size.
What I’d Do Differently
A few takeaways from this round of analysis, mostly aimed at past-me:
Don’t lean during break-in. Lycoming says so, and it confounds your data in addition to whatever it does to your engine. I should have stayed full-rich for the first 25 hours.
Always split your regression at known regime changes. Adding fuel flow as a variable, or just visually inspecting it for step changes, would have caught this before I started believing the −2.75 °F/flight number. A regression doesn’t know about operating regimes; you have to tell it.
For break-in, watch max CHT, not cruise CHT. That’s where the cooling system is closest to its limits, and that’s where any change in heat transfer will show up. Cruise has too much margin to be a useful break-in metric on this engine.
Track oil consumption rigorously. It’s the actual answer to “is break-in done?” — and I’ve been treating it as a footnote.
Single-flight changes are not break-in. F10 looked great on Cyl 1, but it was one data point against a known air-dam-removal mod. F11/F12 will tell us whether that’s the new baseline or a fluke, and whether the Cyl 5 climb-cooling cost is real.
A Footnote on How This Analysis Got Done
I want to be honest about the workflow here, because it’s something I’m thinking about a lot lately. I built the original “Cyl 1 is breaking in fast” regression in an afternoon, and I was ready to ship it. The reason it didn’t ship that way is that I was talking through the result with Claude — Anthropic’s AI assistant — and it kept asking annoying questions like “have you looked at whether fuel flow changes across these flights?” and “are you sure the operating point is the same?” The fuel-flow analysis that broke the story open was prompted by exactly that kind of push-back.
I’ll write a longer post on this workflow at some point, but the short version: AI-assisted data analysis is genuinely useful for catching the things a tired homebuilder is about to ship. It’s also a useful collaborator for sanity-checking the math, generating the chart, and writing the script that drops a fuel-flow column into an existing dataframe. None of which is a substitute for thinking about the data carefully — but it’s a force multiplier on the thinking.
What’s Next
F11 and F12 are going to be the air-dam follow-up flights. The plan: go back to full-rich mixture, fly a representative climb-and-cruise profile, see what Cyl 1 cruise (does it stay near 354°F, or does it drop further — that distinguishes mod-only effect from continuing break-in) and Cyl 5 max (does it stay elevated, or pull back in line) do. And start logging oil add events more carefully so I have the actual break-in metric Lycoming cares about.
If you’re working through Phase 1 on a new engine yourself and you’ve been staring at CHT numbers wondering what they’re telling you, I hope this is useful. The headline I’d leave you with: watch the maxes, not the means; don’t change two things at once if you can avoid it; and if your data tells you a beautiful story, ask it what’s missing before you publish.
Posted from N997CZ flight test program — see the CAN Bus Rewire post for the most recent system-level fix, and the First Flight post for the origin of the CHT story.
We had hoped to be wheels-up by 6:30 AM. First flights have a way of humbling your schedule.
The day actually started on time — at around 6:30 AM we were already on the radio with the Manassas tower, working through the coordination that my operating limitations required before I could fly. That conversation shaped the flight plan for the morning. I asked the controller for 1,800 feet MSL inside the Class Delta, offset between one and two miles west of the runway, with north and southbound legs west of the field. It was a compromise altitude — lower than I would have liked for gliding distance safely, but it was as high as we could go inside the Delta without conflicting with Washington Dulles airspace to the north. The tower was accommodating and we had our area sorted.
What we didn’t have sorted quite yet was the aircraft. By the time we’d finished the walkaround, coordinated with the local fire department (who graciously agreed to stand by on-field — something I’d strongly recommend to any first-time experimental flyer), and began taxiing out, it was closer to 8:30. Two hours of pre-dawn nerves, checklists, and quiet conversations on the ramp.
The fire crew’s presence wasn’t just a safety net — it was a reminder of how seriously we were taking this. This wasn’t a routine departure. This was the culmination of years of building, hundreds of hours in the hangar, and a lot of faith in the process.
What Came Before: Engine Time at First Flight
One thing worth noting for anyone following along with their own build: we kept pre-flight engine running to an absolute minimum.
By the time we lined up on RWY34R that morning, the engine had seen just two cold starts and one brief taxi test to break in the brakes — probably less than 10 minutes of total run time prior to the day of the first flight. The conventional wisdom on Lycoming break-in is to get the engine to altitude quickly, run it hard, and let the rings seat properly. So we kept ground time short and intentional. I believe this is also to prevent “gazing” the cylinder walls — a condition that can occur from prolonged low-power operations before the engine is thoroughly broken in, and which can make proper ring seating much harder to achieve afterward.
That philosophy was tested on the morning itself. The long taxi out gave the engine time to heat up, and by the time we completed our run-up, CHTs had climbed to around 405°F — already nudging our yellow warning limit. I made the call to pull back to idle for a couple of minutes and let things cool down before attempting the takeoff roll. It was the right call: temperatures settled, we confirmed everything was in order, and we lined up.
We knew engine temperatures were going to be a story on this flight. We just didn’t fully anticipate how much of a story.
The Flight Area
Per my operating limitations and the coordination with Manassas tower, the first flight was conducted inside the Class Delta airspace, one to two miles west of the runway at 1,800 feet MSL, with north and southbound racetrack legs west of the field.
The altitude was a deliberate trade-off. Higher would have been better for cooling airflow and giving me more options in an emergency, but 1,800 feet was the ceiling we could use without stepping into Dulles’s airspace. You work with what you have.
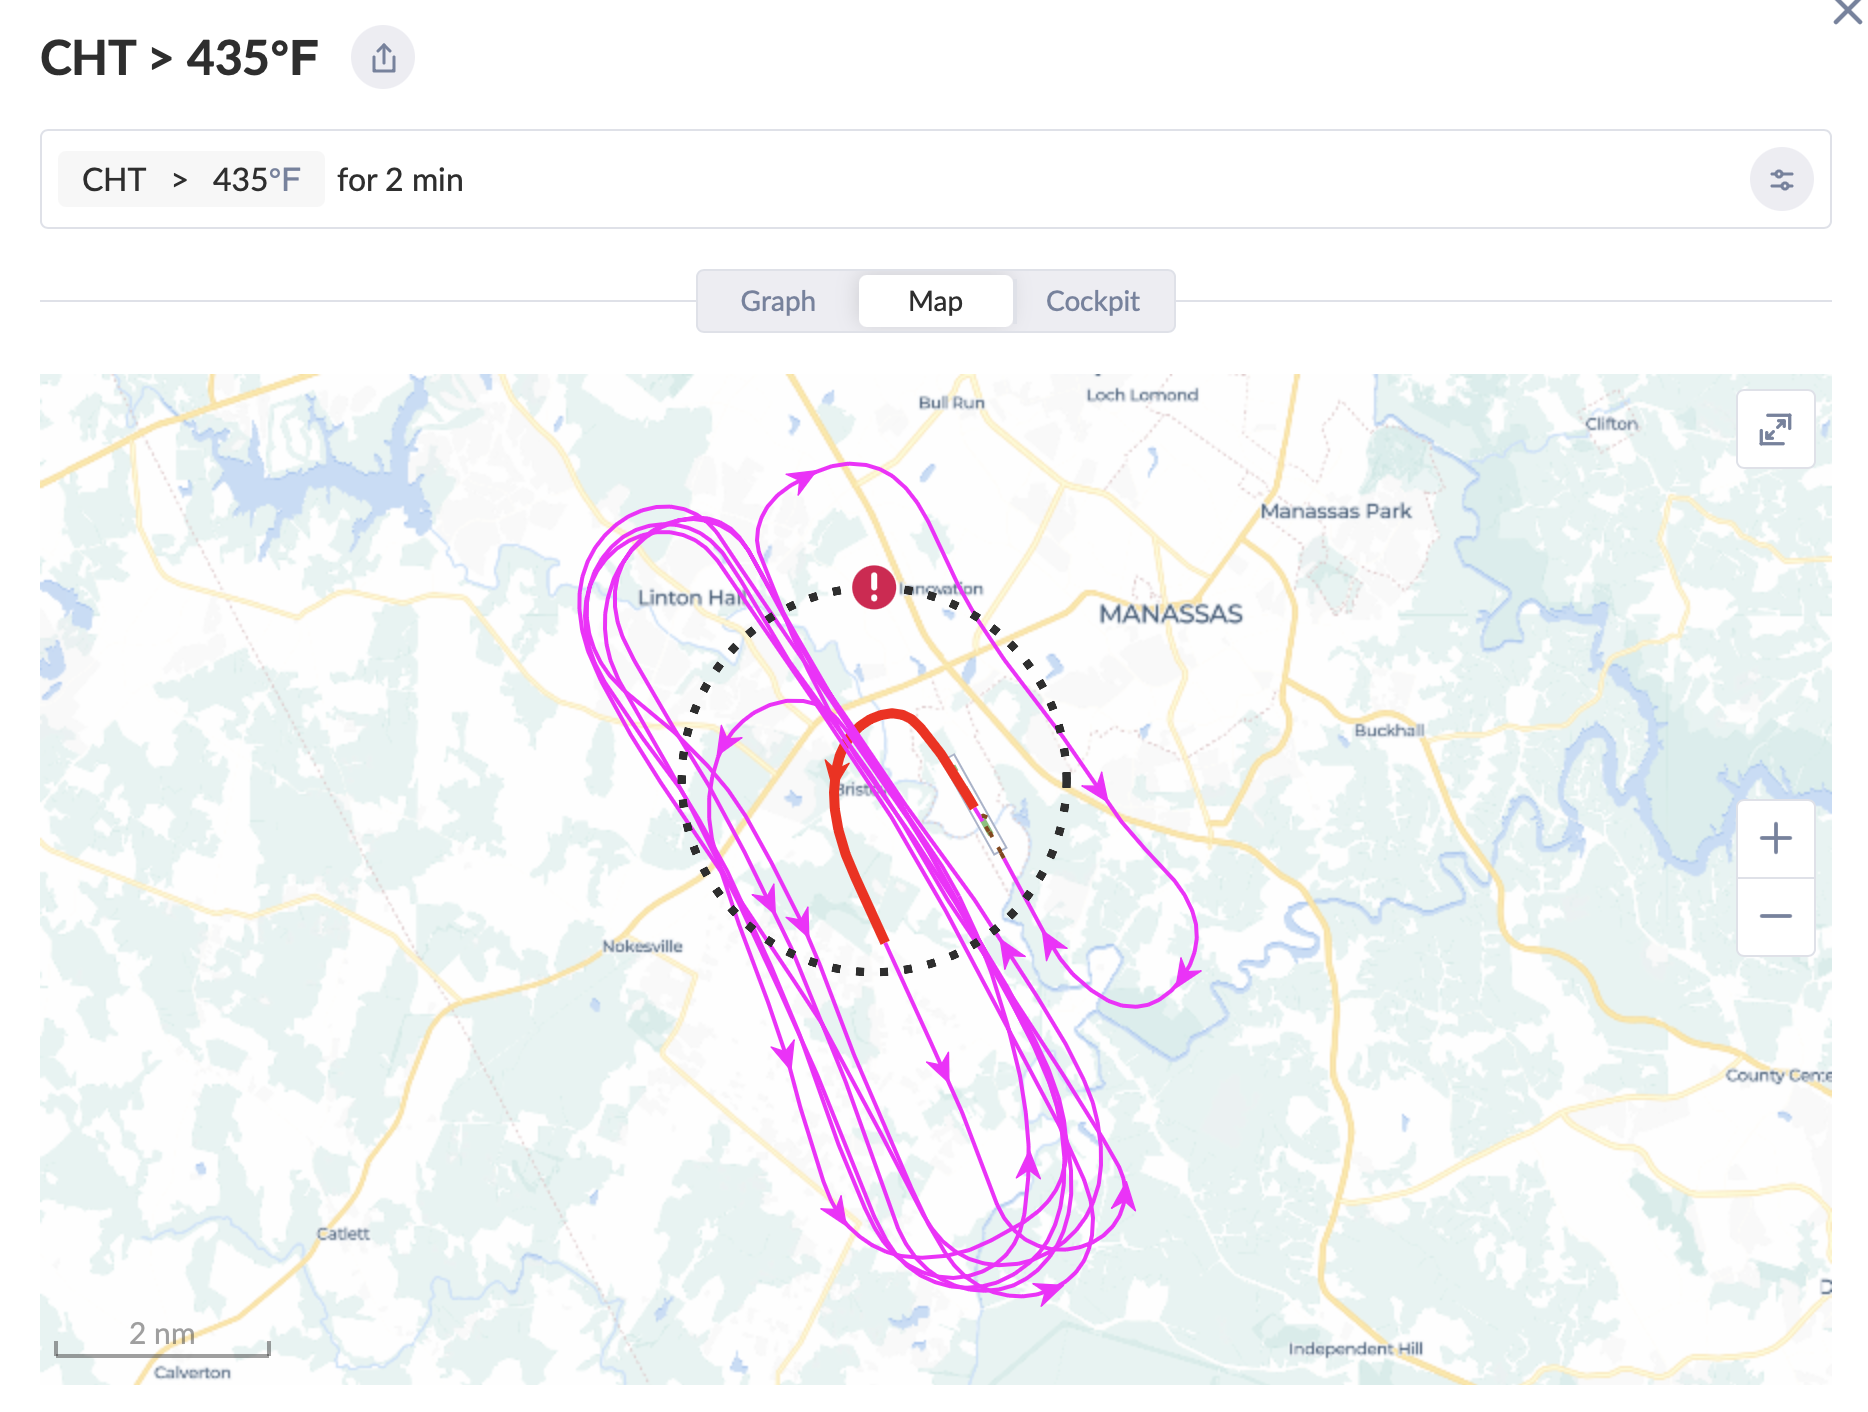
Flight track over Manassas (KHEF). Red segment marks where CHTs exceeded 435°F — concentrated at the departure end of RWY34R.
Takeoff and Climb: The CHTs Tell the Tale
Liftoff from RWY34R was clean. The RV-10 accelerated exactly as I was expecting — consistent with the seven hours of transition training I’d done with Mike Seeger in Vernonia, Oregon before the build was complete. That experience paid off; there were no surprises on the runway and the controls felt immediate and responsive — more on the flight characteristics in a future post. For now, let’s talk about what the engine monitor was screaming at us.
We had configured our warning limits conservatively for the first flight:
Yellow (caution): 400°F CHT
Red (warning): 425°F CHT
Remember, CHTs were already at around 405°F during run-up, before we even started the takeoff roll. The climb loaded the engine further and temperatures rose quickly.
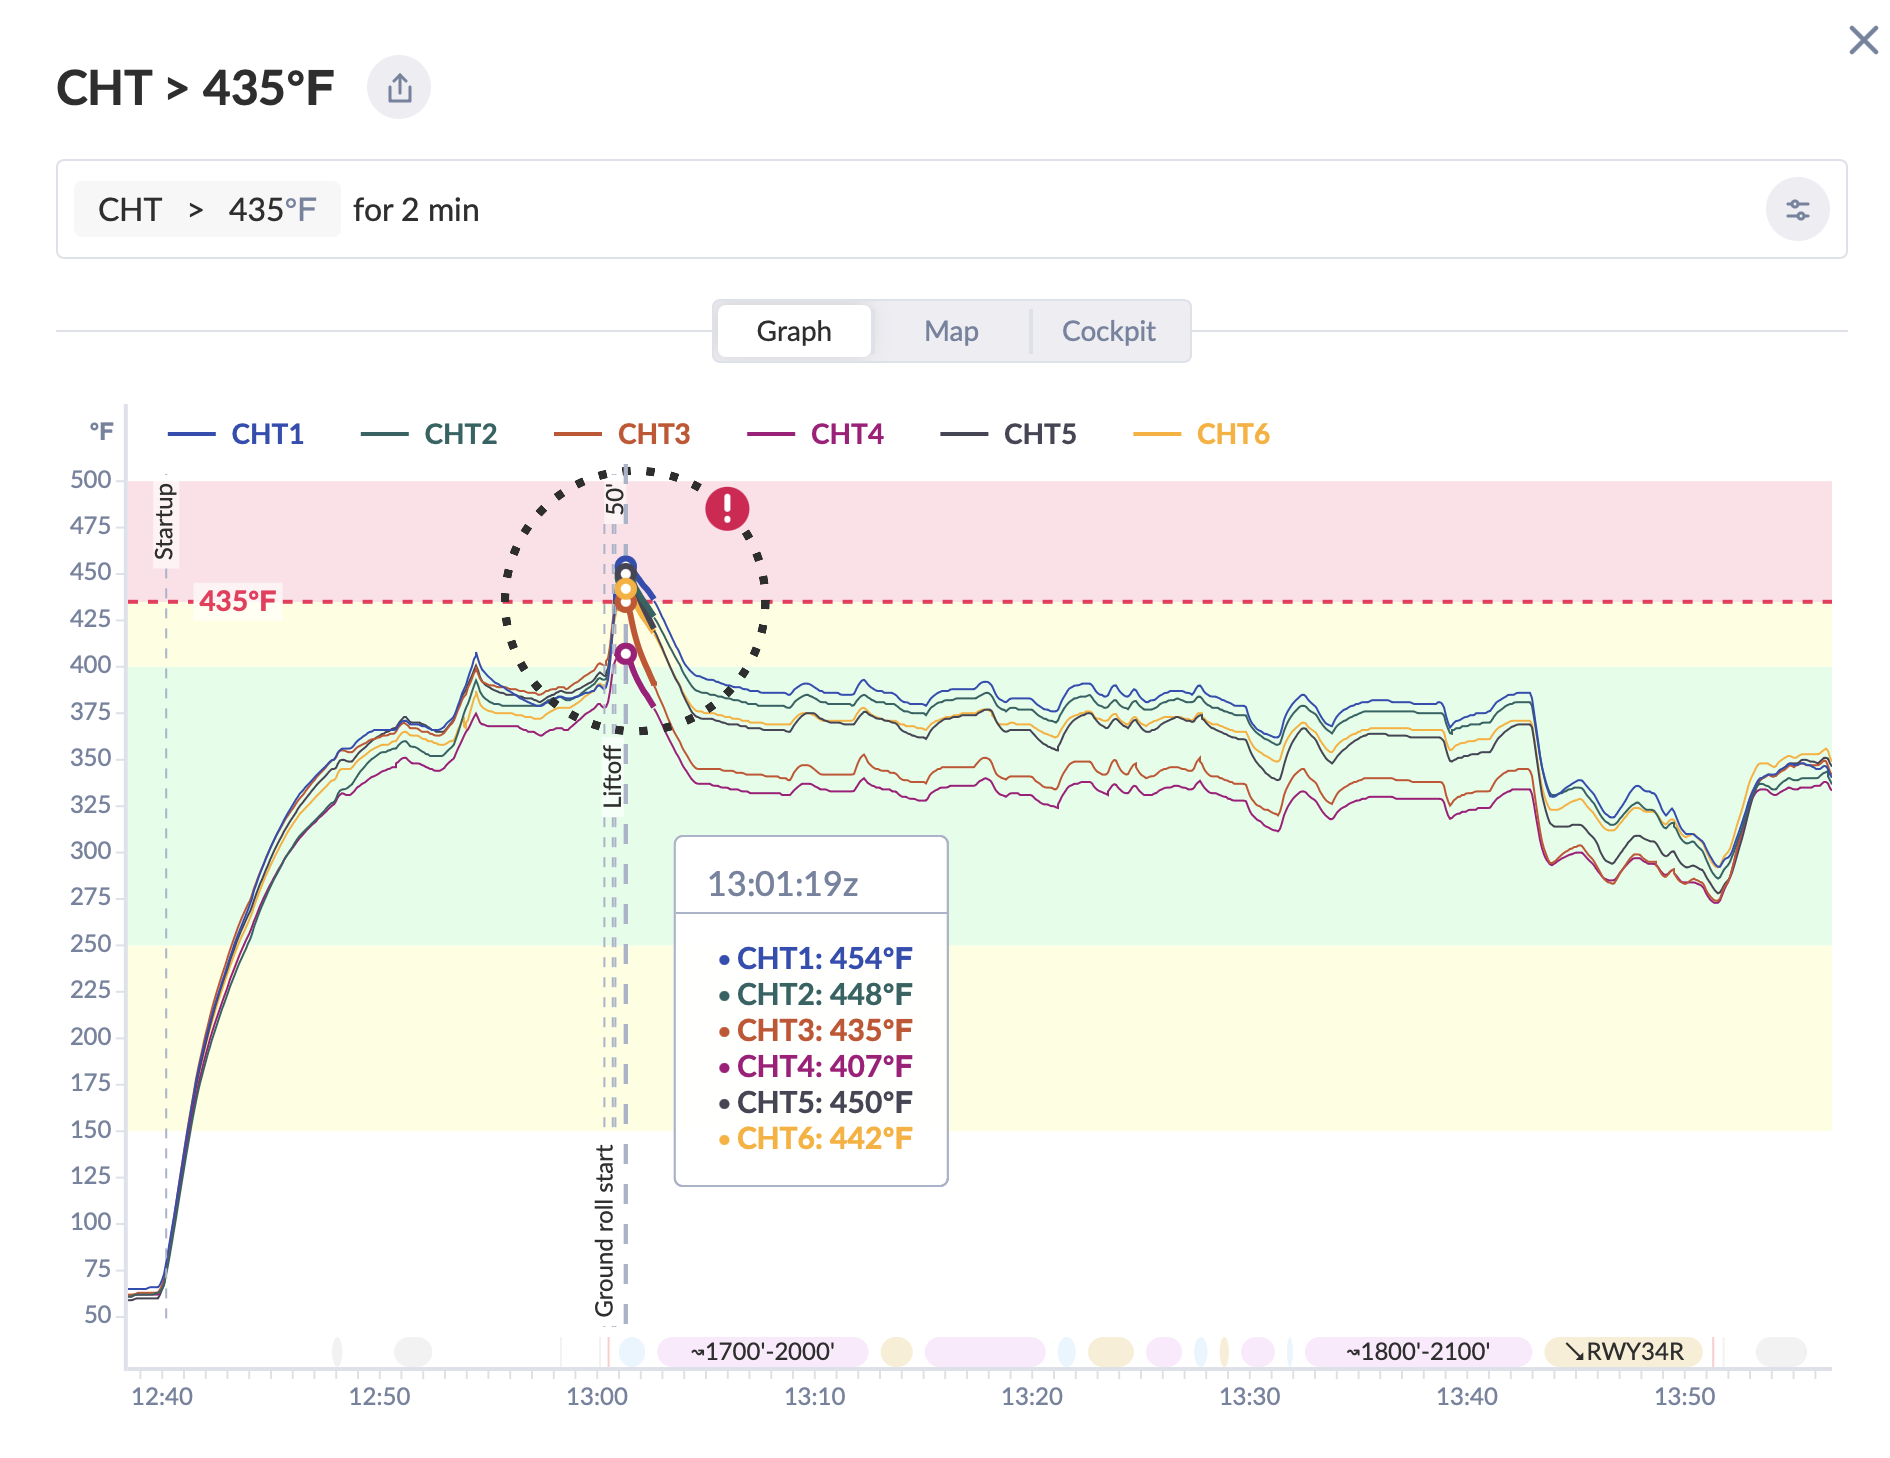
At 13:01:19 UTC — roughly a minute after liftoff — cylinder head temperatures peaked across the board:
Cylinder
Peak CHT
CHT 1
454°F
CHT 2
448°F
CHT 3
435°F
CHT 4
407°F
CHT 5
450°F
CHT 6
442°F
Five of six cylinders exceeded our red warning limit. CHT1 hit 454°F — well into territory that gets your attention. The aircraft’s engine monitor was painting a very pink picture.
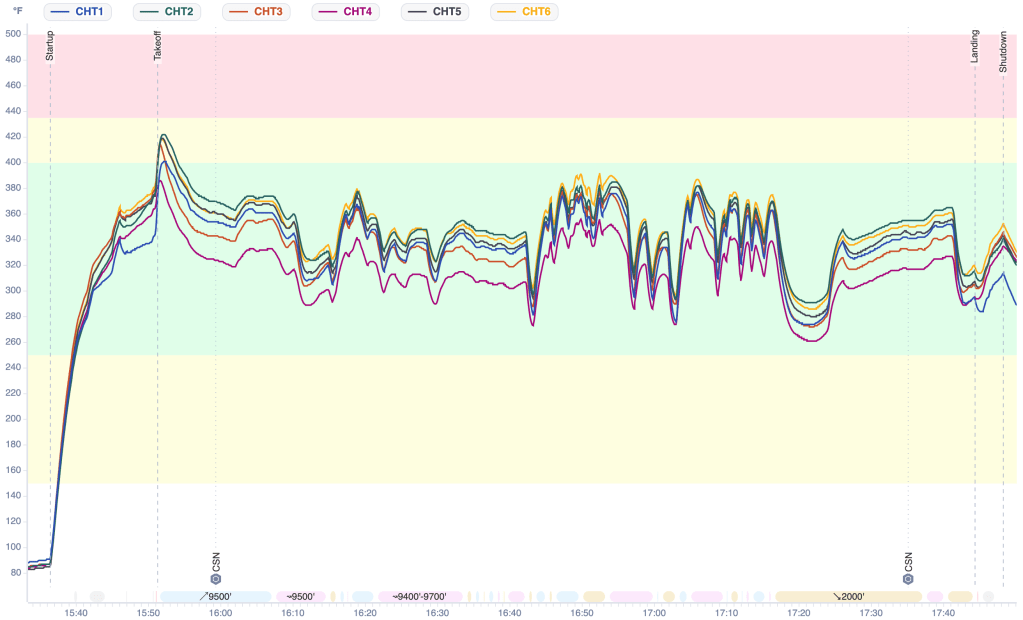
All six CHTs during the first flight. Peak at 13:01:19 UTC with CHT1 reaching 454°F. Temperatures were above 435°F for approximately 2 minutes before trending down.
The good news: we had expected elevated temperatures during break-in, had briefed the scenario, and had a plan. We maintained climb power, kept the nose slightly lower than we might otherwise to maximise airflow, and watched the numbers. Within about two minutes, CHTs began their descent back toward normal operating range and continued to trend down through the rest of the flight as the engine settled in.
Not everything was alarming, though. Oil temperature and oil pressure both told a completely different story — and a reassuring one.
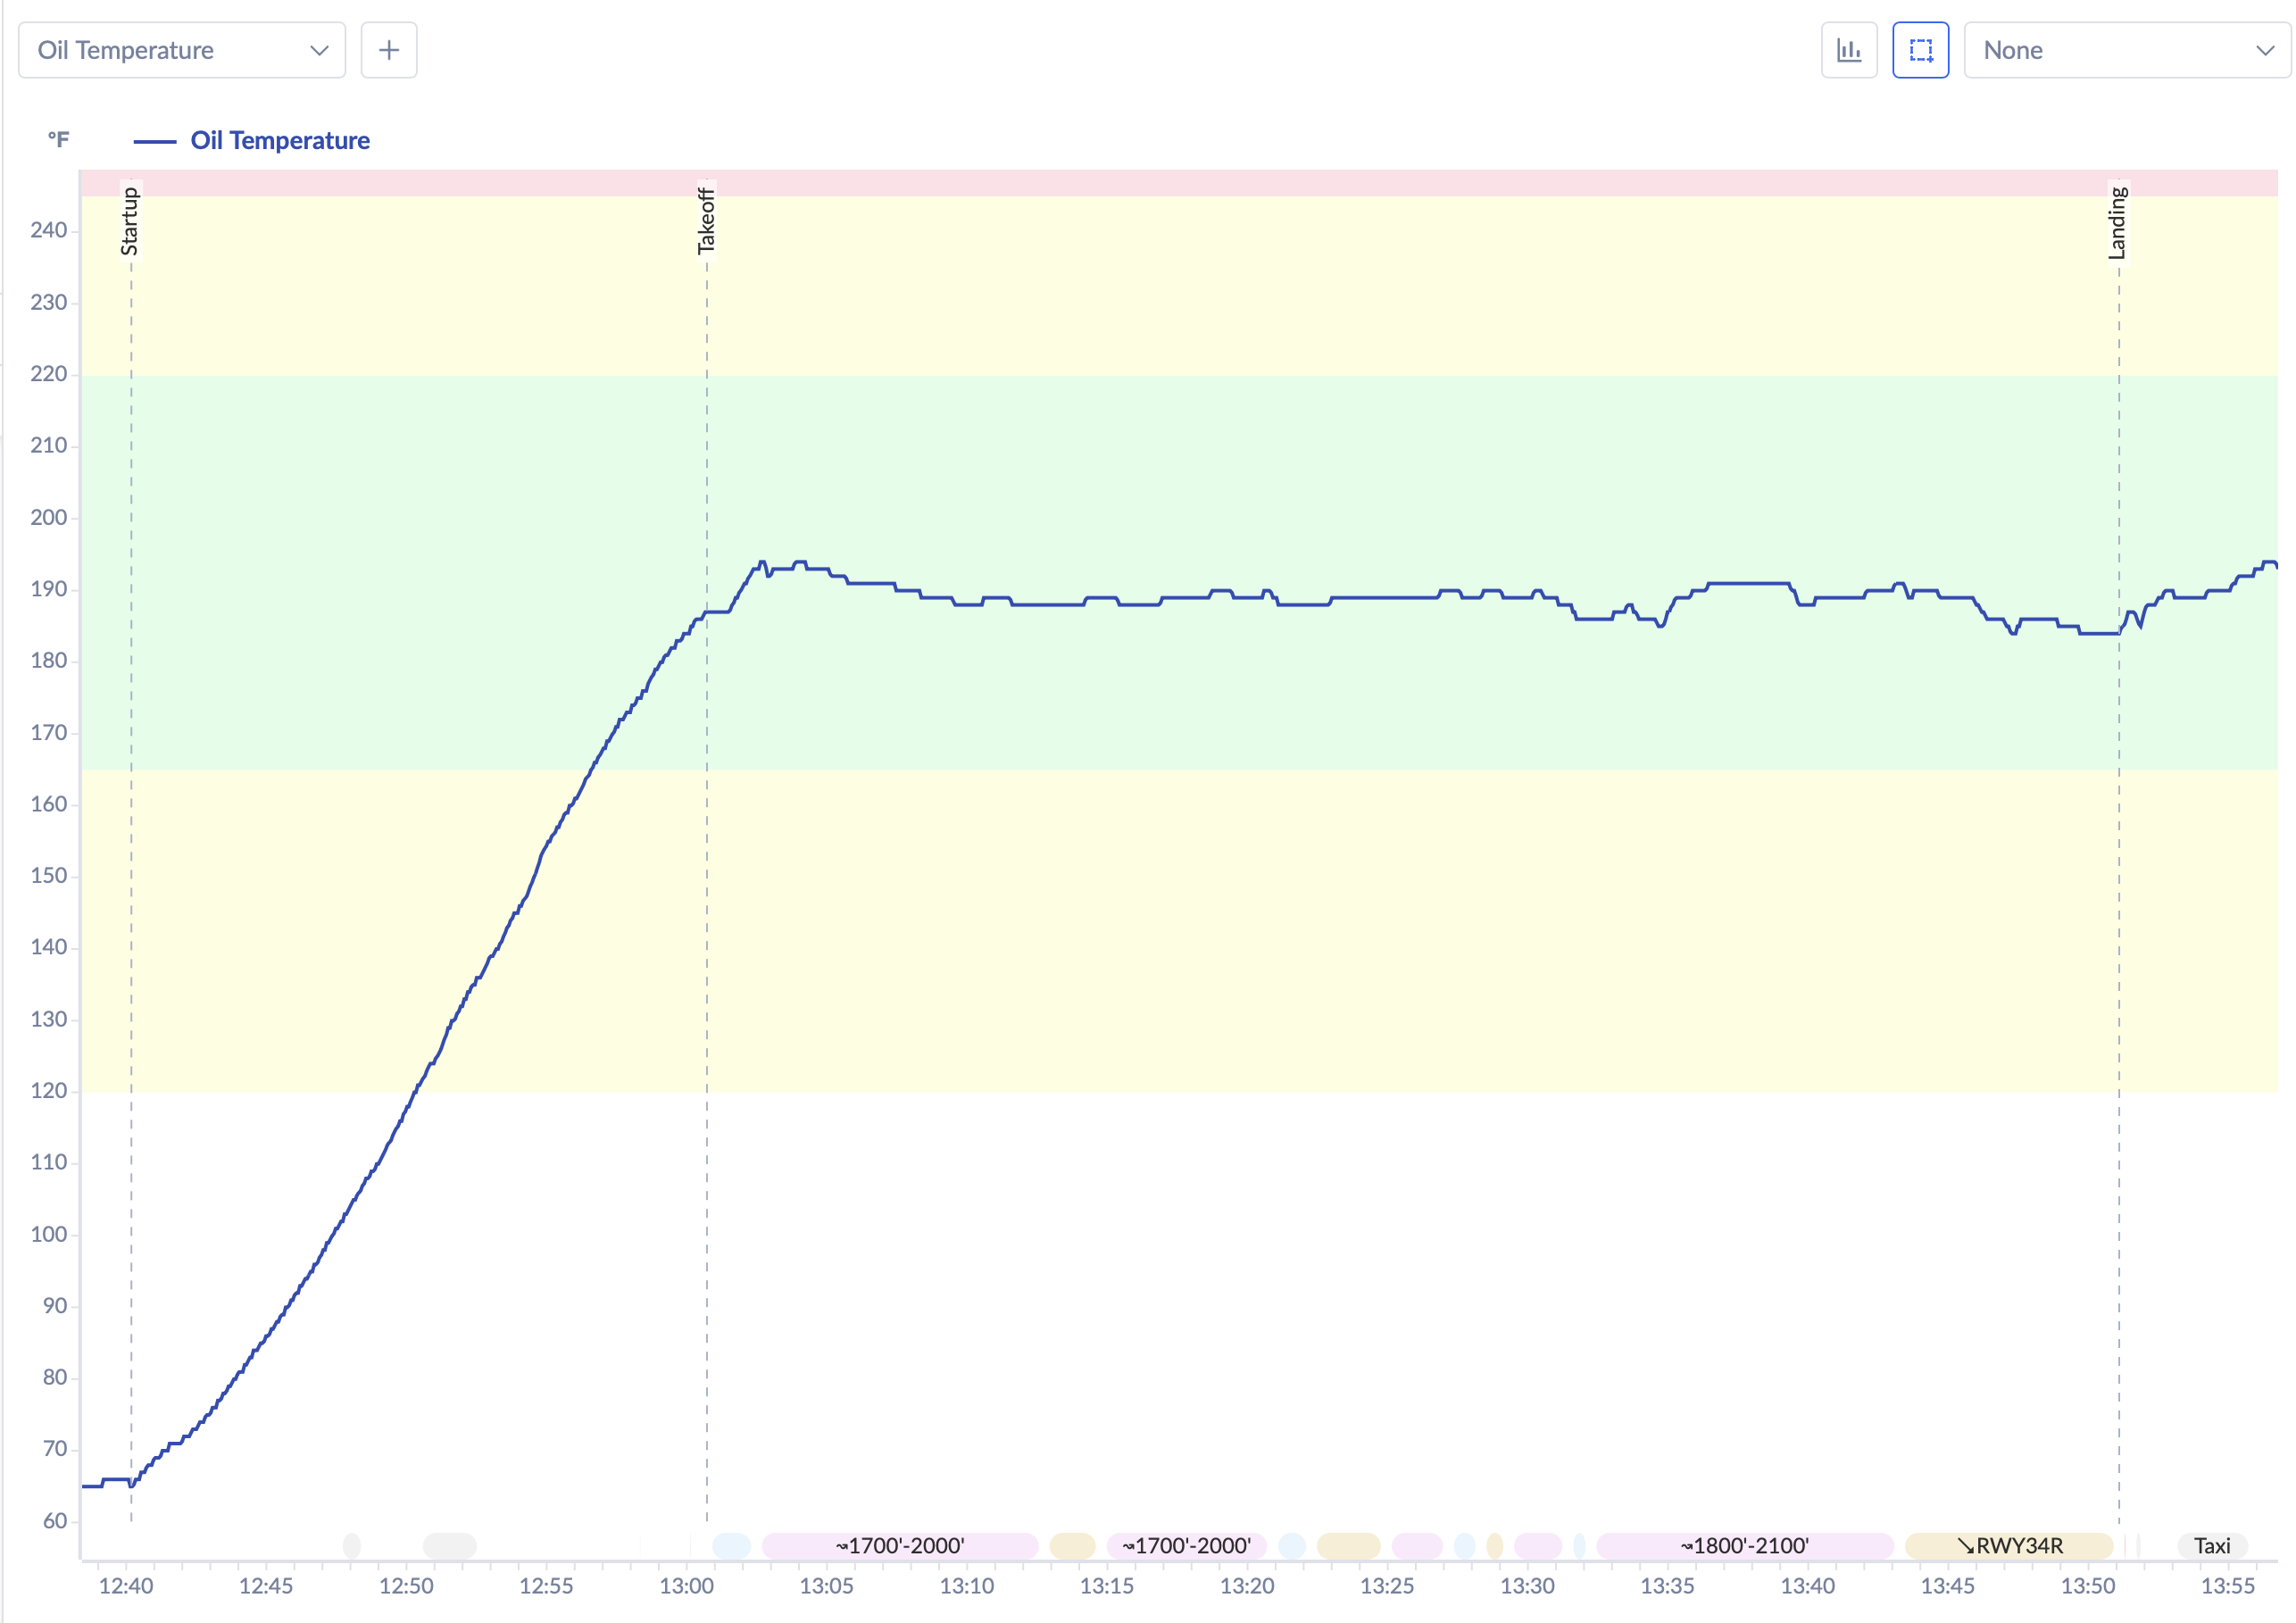
Oil temperature started around 65°F at engine start, climbed steadily through the long taxi, reached roughly 185–190°F by the time we lifted off, peaked at around 195°F shortly after takeoff, then settled into a rock-solid band of 185–195°F for the entire flight — squarely in the green, never threatening the yellow or red zones. Whatever the CHTs were doing, the oil temperature was happy throughout.
Oil temperature throughout the flight. Climbed steadily during taxi, peaked at ~195°F shortly after takeoff, then held a stable 185–195°F band for the duration — solidly in the green zone throughout.
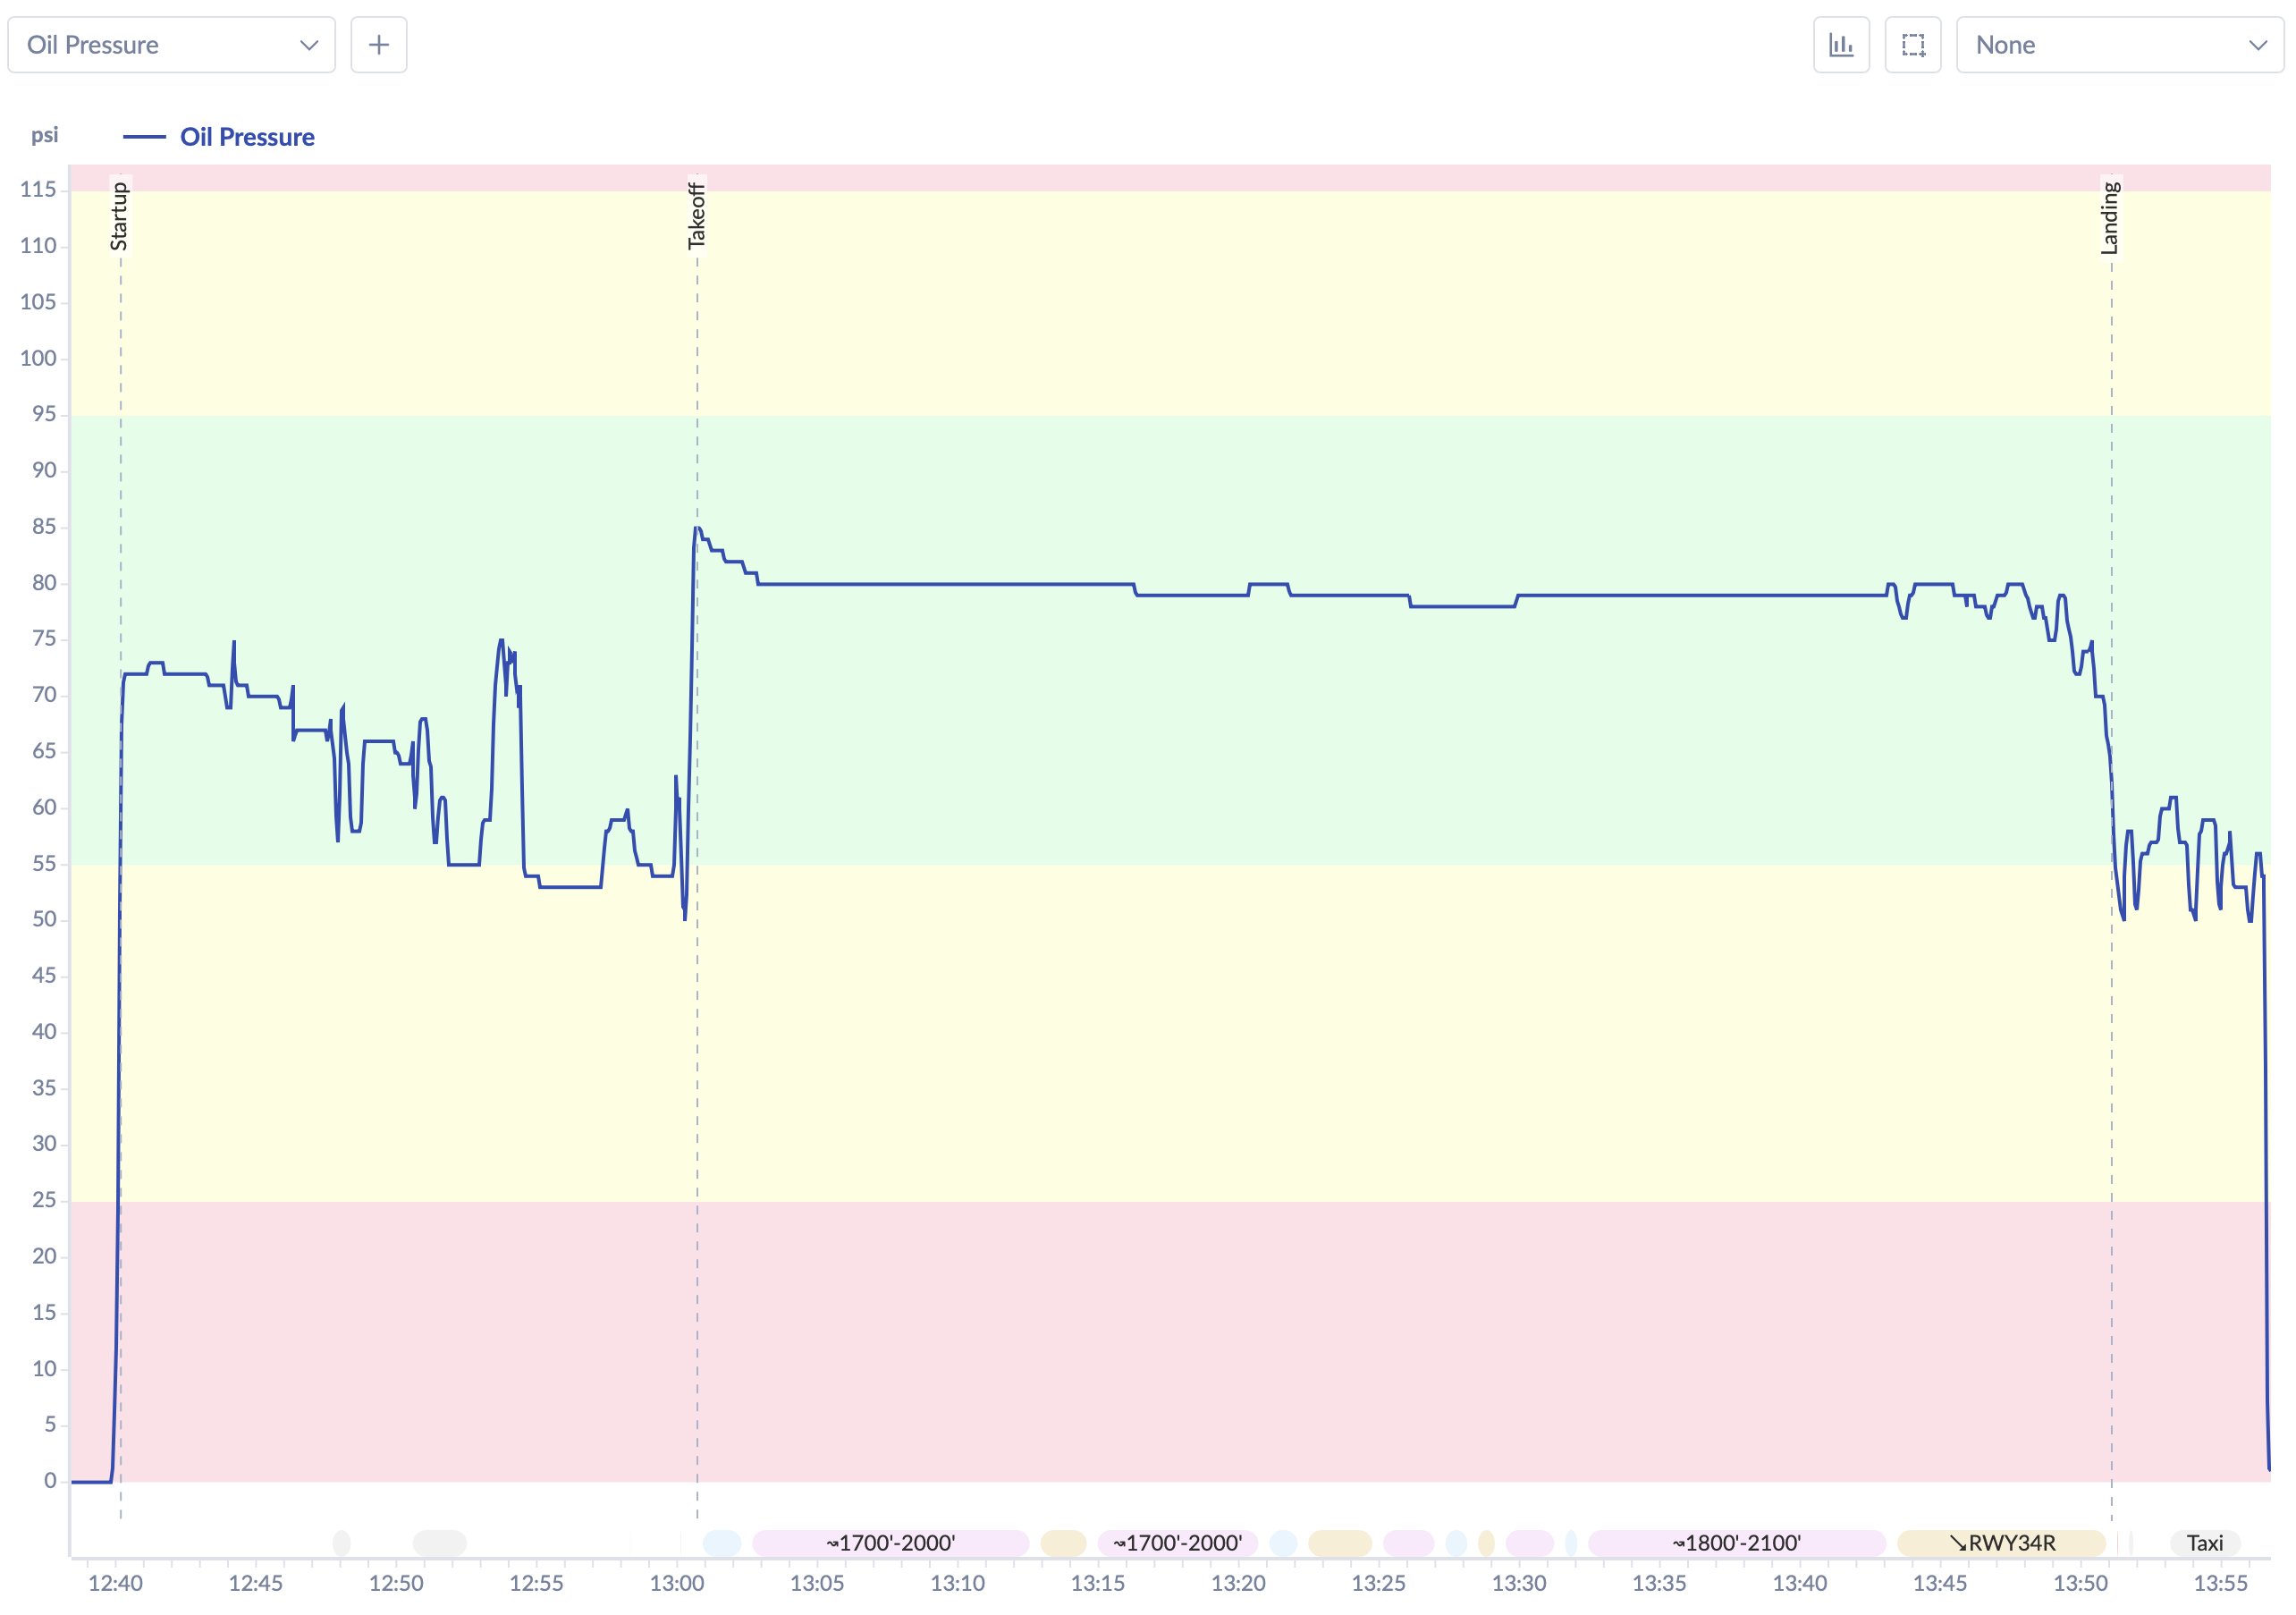
Oil pressure was equally well-behaved. It jumped to around 70 psi immediately at startup, showed some normal variability during taxi at idle power, then spiked cleanly to ~85 psi as full power was applied for takeoff. From there it held a steady ~80 psi through the entire flight — solidly in the green band — before settling back down during the taxi in after landing. On a brand new engine, seeing oil pressure that stable and consistent is exactly what you want.
Oil pressure throughout the flight. A brief spike to ~85 psi at full-power takeoff, then a steady ~80 psi through the pattern — well within the green band for the entire flight.
The flight track map tells the same story geographically — you can see the red segment (CHT > 435°F) concentrated right over the departure end of the runway, fading as we worked through our planned pattern to the southwest of the airport.
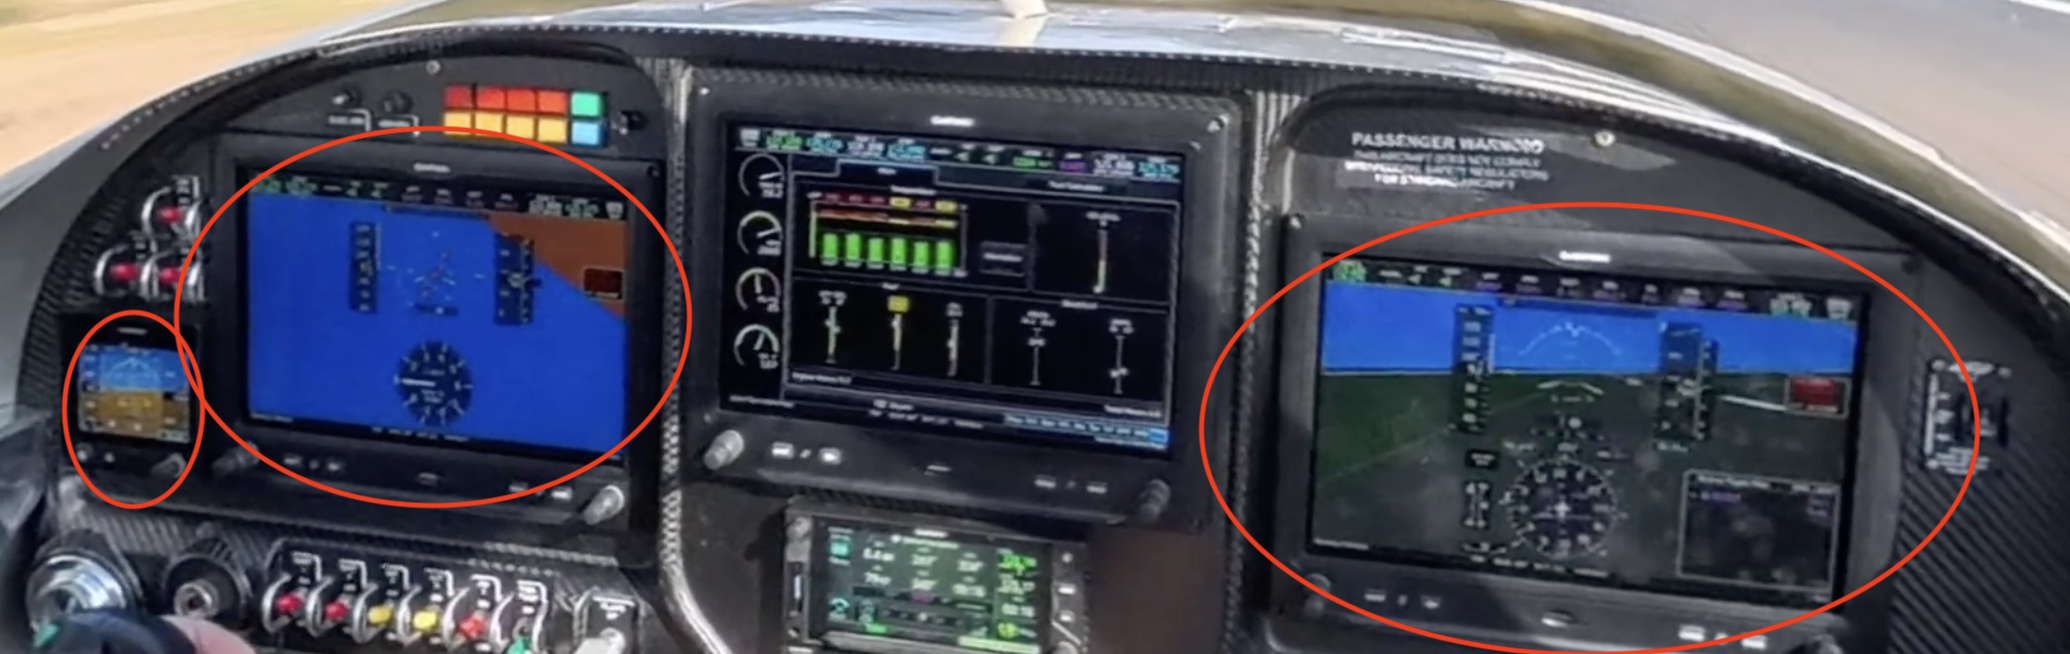
One other thing you’ll notice if you watch the cockpit video: the primary flight display — connected to Attitude and Heading Reference System number one (AHRS-1) — tumbled during the takeoff roll. Importantly, this was isolated to screen one. Primary flight display two, connected to AHRS-2, remained solid throughout, as did the G5 standby attitude indicator. So while the artificial horizon on screen one was misbehaving, we had two other reliable attitude references in the cockpit the entire time. The image below captures it clearly — PFD1 on the left showing a wildly incorrect attitude while PFD2 on the right remained perfectly stable.
PFD1 (left, circled) showing a tumbled attitude during the takeoff roll. PFD2 (right, circled) and the G5 standby both remained solid throughout.
Notably, AHRS-1 corrected itself shortly after takeoff — before we even reached the first turn — so the tumble was brief. That said, “it fixed itself” isn’t a satisfying answer for a system you’re counting on, and it’s not ideal, absolutely something that needs to be resolved before any IFR or night flight. It’s sitting lower on the priority list right now while we focus on the engine temperatures. One squawk at a time.
The Builder’s Conundrum: Run It Hard vs. Take It Easy
Here’s the tension nobody talks about enough.
A brand new Lycoming needs to be run like you stole it. Full power, or as close to it as you can manage, for as long as it takes to get the rings to seat against the cylinder walls. We’re talking an hour or two of hard running — sustained high power, letting the pressure in the combustion chamber do the work of pushing those rings out and wearing them in. The payoff is a marked drop in cylinder head temperatures on subsequent flights as the seal improves and the engine breathes properly. You watch for that drop like a hawk.
But running an engine flat-out is exactly at odds with what you want to do with a brand-new airframe. Every builder’s instinct — and the right instinct — is to build up slowly. Fly a little conservatively at first. Take things one step at a time. Get familiar with the aircraft before you start pressing limits.
Those two requirements don’t coexist gracefully.
This isn’t our first rodeo — we previously built and flew an RV-7A (N997RV), and we had elevated cylinder head temperatures on the first several flights of that aircraft too. That experience helps. You know the temperatures are coming, you’ve seen the trend lines before, and you have some confidence that the numbers will fall as the engine breaks in. But it doesn’t make the decision any easier when you’re staring at 454°F on CHT1 and trying to decide how hard to push a machine you’ve spent years building.
What We Learned
A few takeaways that might help others approaching their own first flight:
1. Brief the temperature scenario in advance. We had talked through “what do we do if CHTs spike” before we ever started the engine that morning. That meant when the warnings lit up, there was no panic — just a pre-briefed response.
2. Watch your pre-takeoff temps carefully. The long taxi and run-up had already pushed CHTs to ~405°F before we ever lifted off. That warm baseline mattered. If temperatures had continued to climb during run-up, I would have aborted and tried again later in the day. Knowing your limits — and sticking to them — is the whole game.
3. Keep the new engine ground running time to a minimum — get it flying at high power quickly. The elevated temps during climb are part of that process — uncomfortable to watch, but expected.
4. Coordinate your airspace early. The 6:30 AM tower call was one of the better decisions of the morning. Having the flight area locked in before we even went through the walkaround meant one less variable to manage when we were ready to fly.
5. Set your limits to inform, not alarm. Our conservative warning thresholds (400°F yellow, 425°F red) meant we were informed early. Some builders set limits higher to avoid nuisance alerts; I’d argue starting conservatively and adjusting based on data is the better approach.
6. Have the fire department on standby and mean it. Not as a formality. Talk to them beforehand, make sure they know the aircraft and where you’ll be operating. They were professional, prepared, and I hope we never need them — but knowing they were there made a difference. We also brought them donuts as a bribe, which we highly recommend as part of any first flight preflight checklist.
What’s Next
The RV-10 is now officially a flying machine. Phase 1 flight testing has begun, and there’s a lot of data to collect and share. Future posts will cover:
Flight handling and control harmony
Engine break-in progress and CHT trends over the first 25 hours
Performance numbers vs. the Van’s specs
Lessons learned from the build that showed up on the flight line
If you’re building an RV-10 (or any experimental), I’d love to hear from you. Drop a comment below or reach out directly — the EAA community is one of the best parts of this whole journey.