Flight 16 gave us our first real cruise card — a speed-power polar and a GAMI lean sweep at 2500 RPM. The obvious next question: how much does prop RPM matter? On a constant-speed prop you get to pick your cruise RPM, and the folklore says lower RPM is more efficient. Flight 18 set out to put a number on it.
The plan was simple: fly the same two F16 cruise cards again — the speed-power polar (cards 18-2 / 18-4) and the GAMI mixture sweep (18-3 / 18-5) — but at a low RPM (2400) and a high RPM (2600), back to back on the same flight, at the same 7,500 ft MSL I used on Flight 16 so the density altitude is comparable. That puts F16’s 2500 RPM run right in the middle as a reference, and lets me bracket the cruise RPM range with one morning’s data.
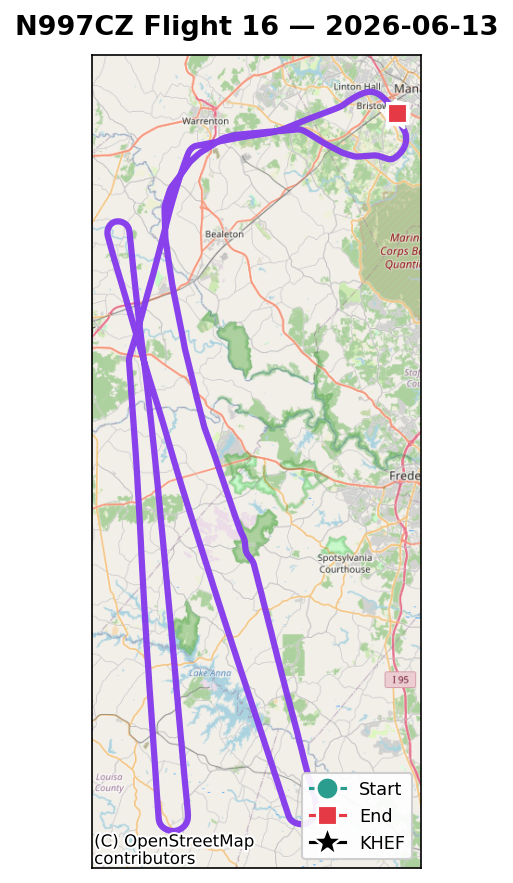
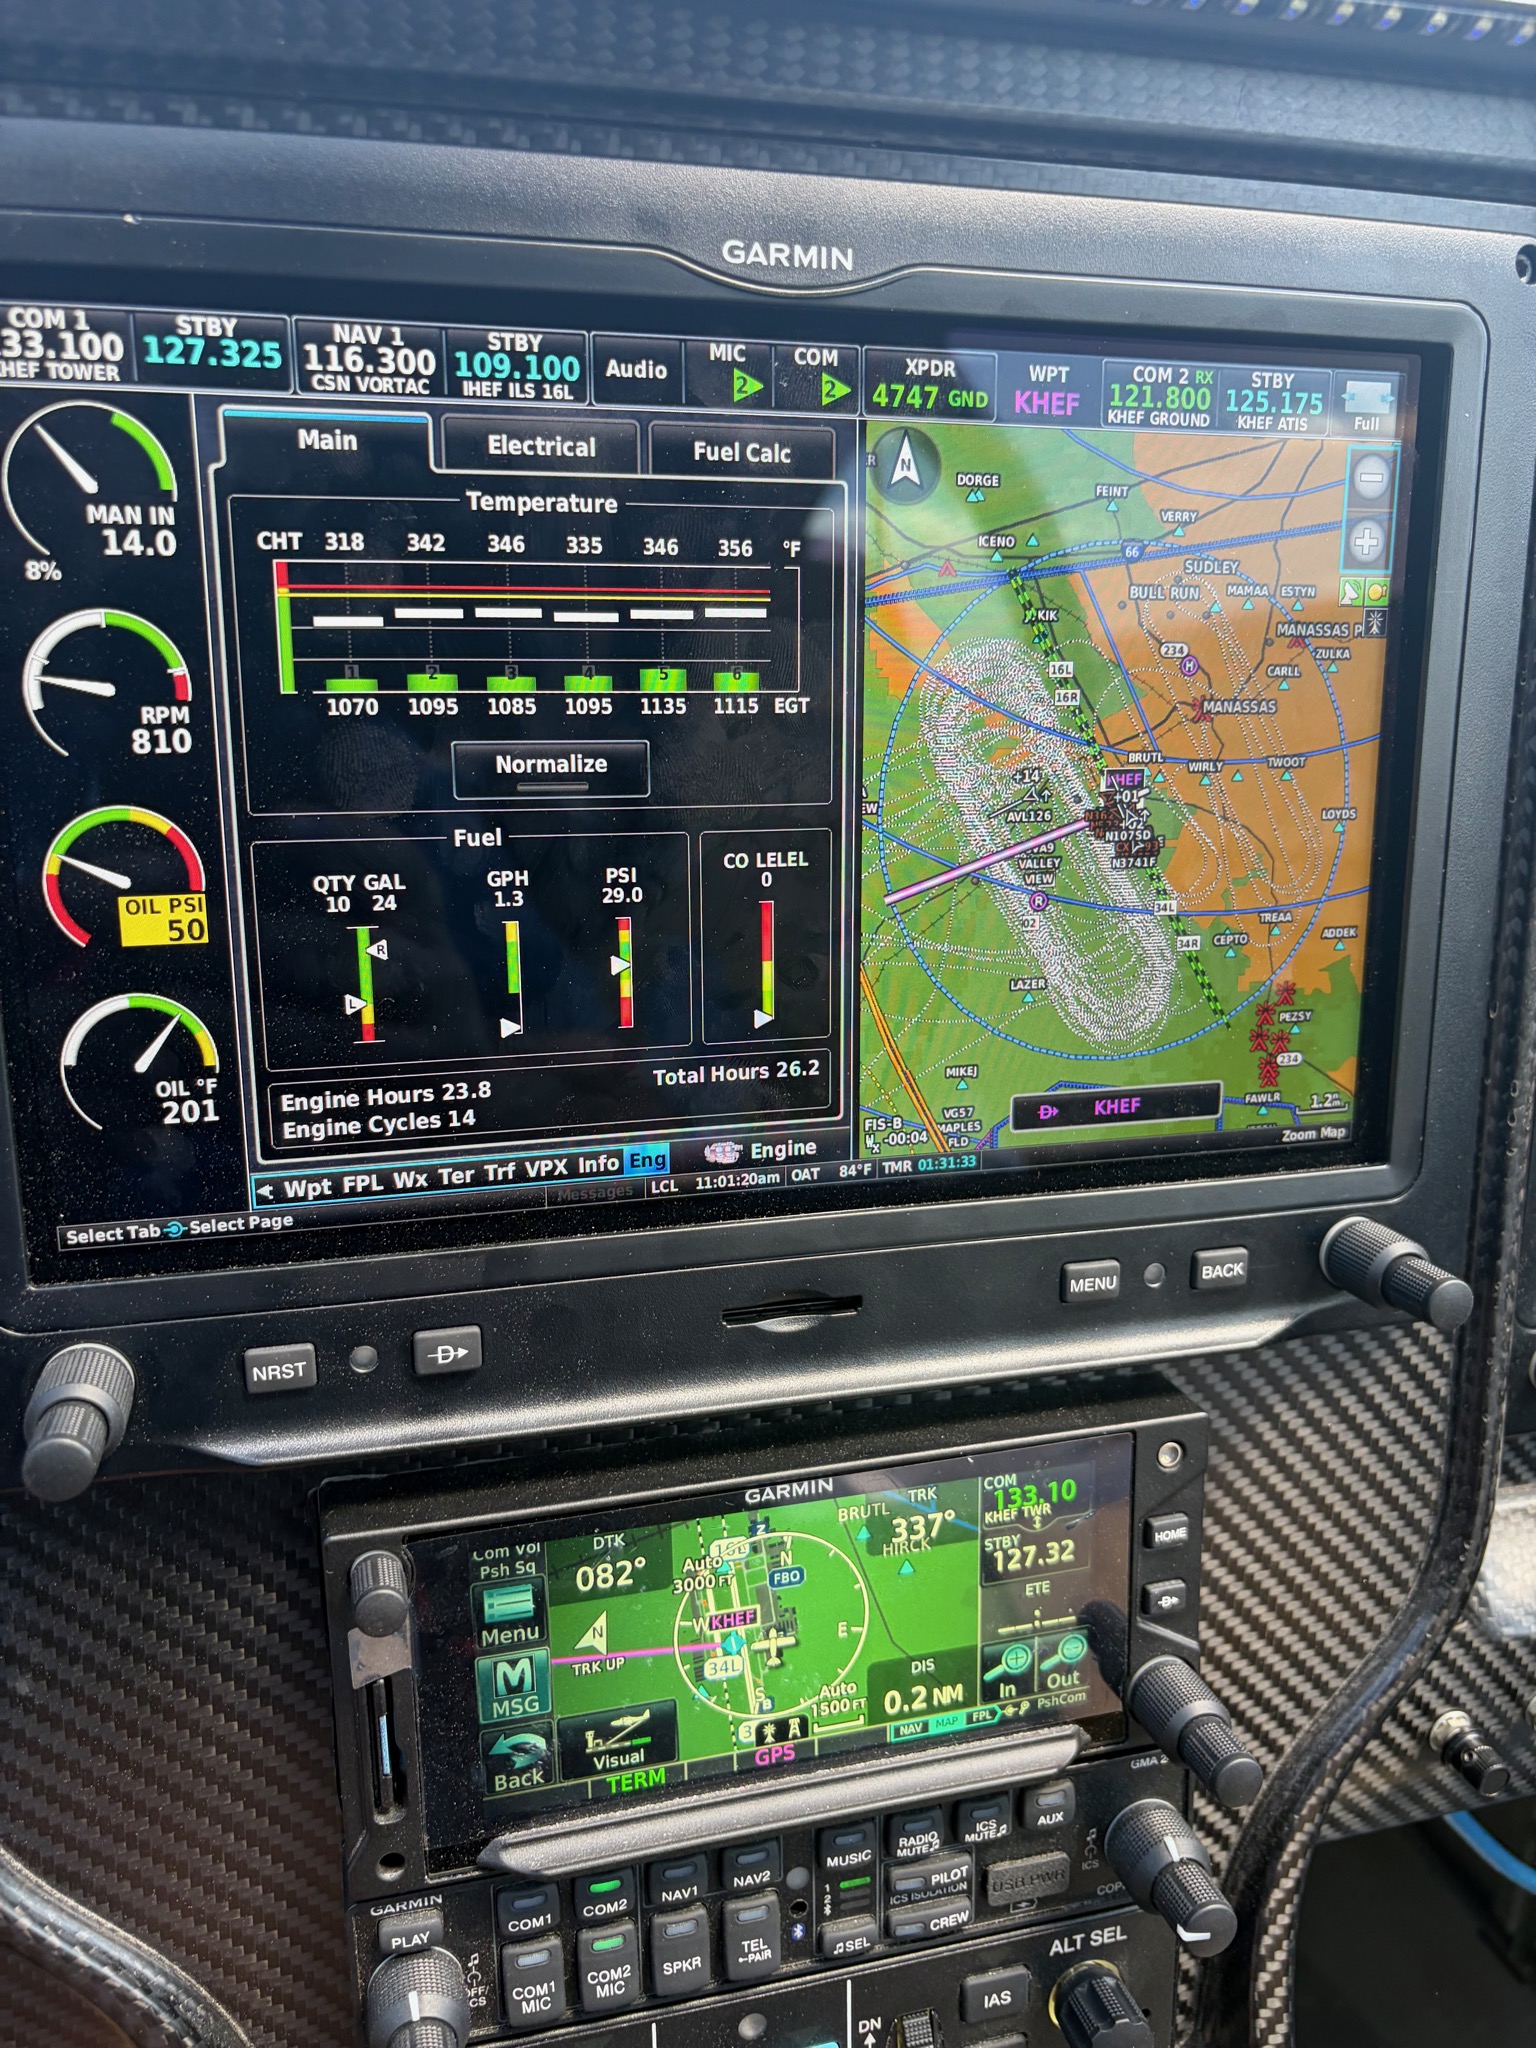
Solo, smooth morning air, 07:07 engine start to 08:56 shutdown, 1.8 hours on the Hobbs.
The headline: lower RPM, same speed, less fuel
Here are the three RPMs at the top of the cruise band — wide-open throttle, ~22.7″ of manifold pressure, 7,500 ft:
| Prop RPM | TAS | Power | Fuel flow | Economy |
|---|---|---|---|---|
| 2400 | 167 kt | 68% | 14.8 gph | 11.3 nm/gal |
| 2500 (F16 ref) | 168 kt | 70% | 18.7 gph | 9.0 nm/gal |
| 2600 | 169 kt | 73% | 18.0 gph | 9.4 nm/gal |
Read the 2400 and 2600 rows — they were flown back to back on this flight, same air, same altitude. For all of 2 knots of true airspeed, pulling the prop back from 2600 to 2400 saved 3.2 gallons per hour — about a 20% improvement in economy (11.3 vs 9.4 nm/gal). On a three-hour leg that’s roughly ten gallons of avgas for no meaningful loss of speed.
And it wasn’t just the top end. At every power setting I tested, 2400 RPM held the same true airspeed as 2600 on less fuel:
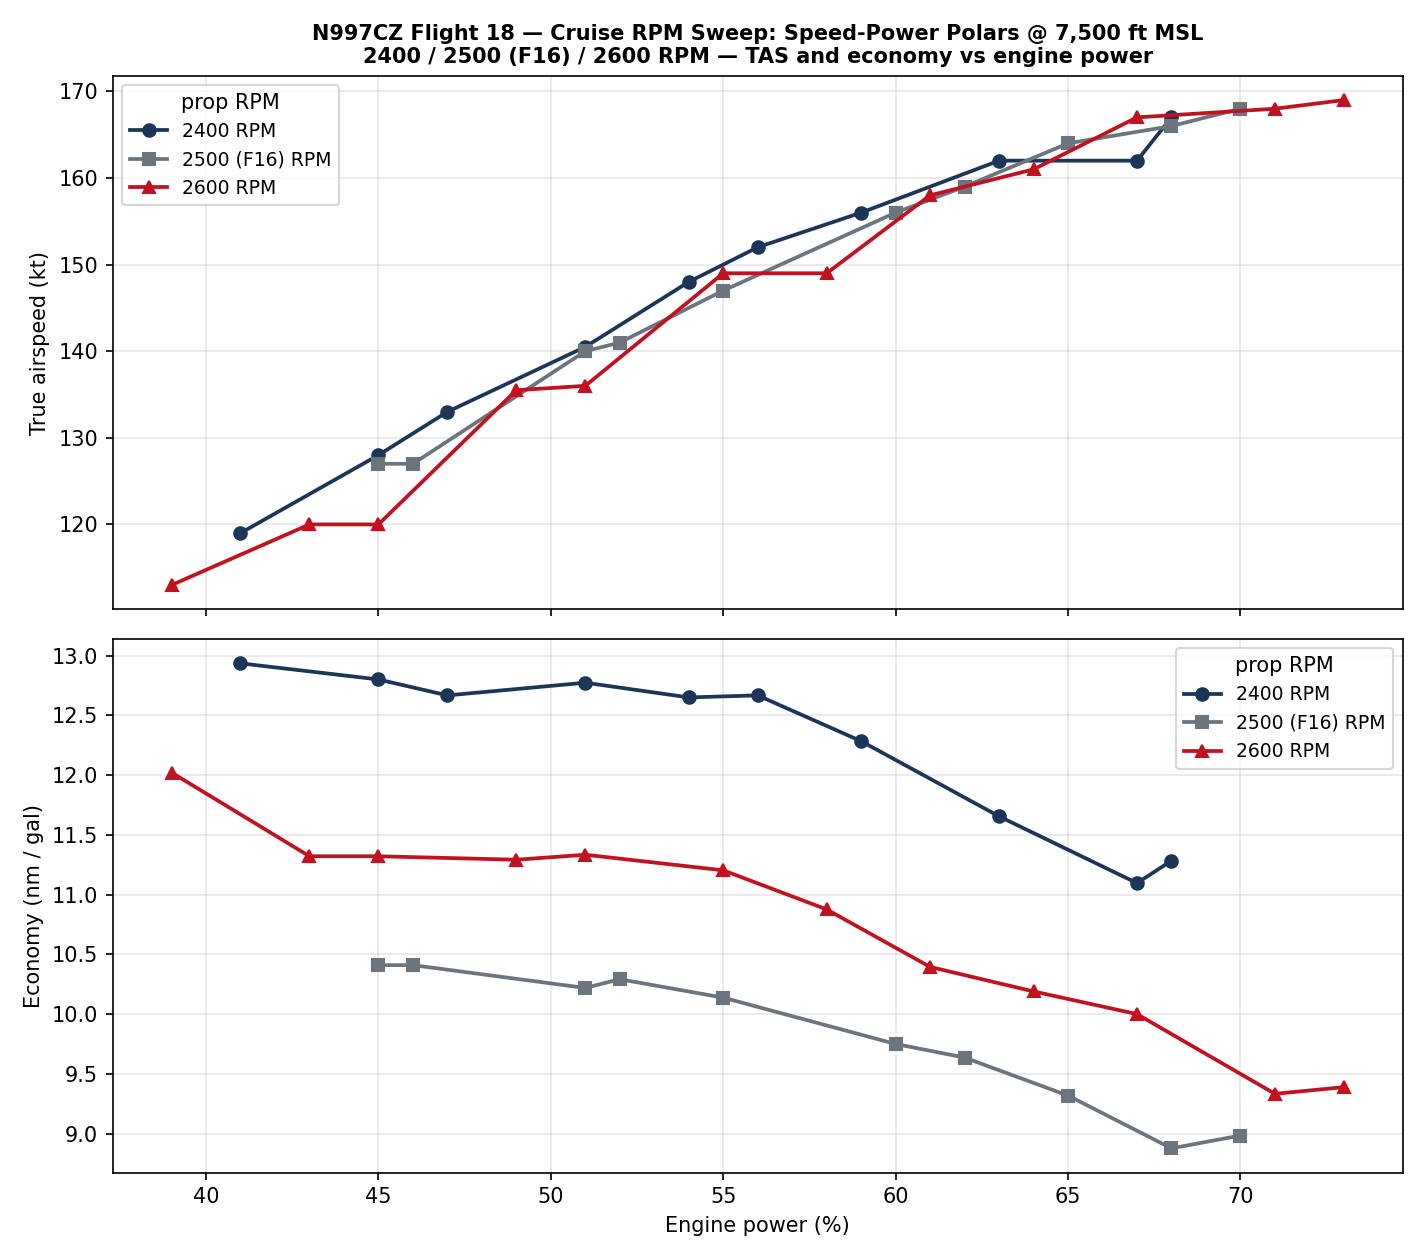
The top panel is true airspeed vs engine power; the bottom is economy (nm/gal) vs power. The 2400 line sits at or above the 2600 line for speed while burning less — so its economy curve rides consistently higher. At a typical ~55% power cruise, 2400 returns about 12.6 nm/gal vs 2600’s 11.2 and 2500’s 10.1.
A caveat on the 2500 line. That data is from Flight 16 — a different day, a touch cooler, and flown full-rich for the whole polar. It brackets the picture but it isn’t a clean same-flight point, and at high power it actually runs richer than either F18 sweep, which is why it sits low on the economy plot. The trustworthy, apples-to-apples result is the 2400-vs-2600 comparison from this single flight, and that one is unambiguous: lower RPM wins.
Leaning: tight injectors, and RPM doesn’t change that
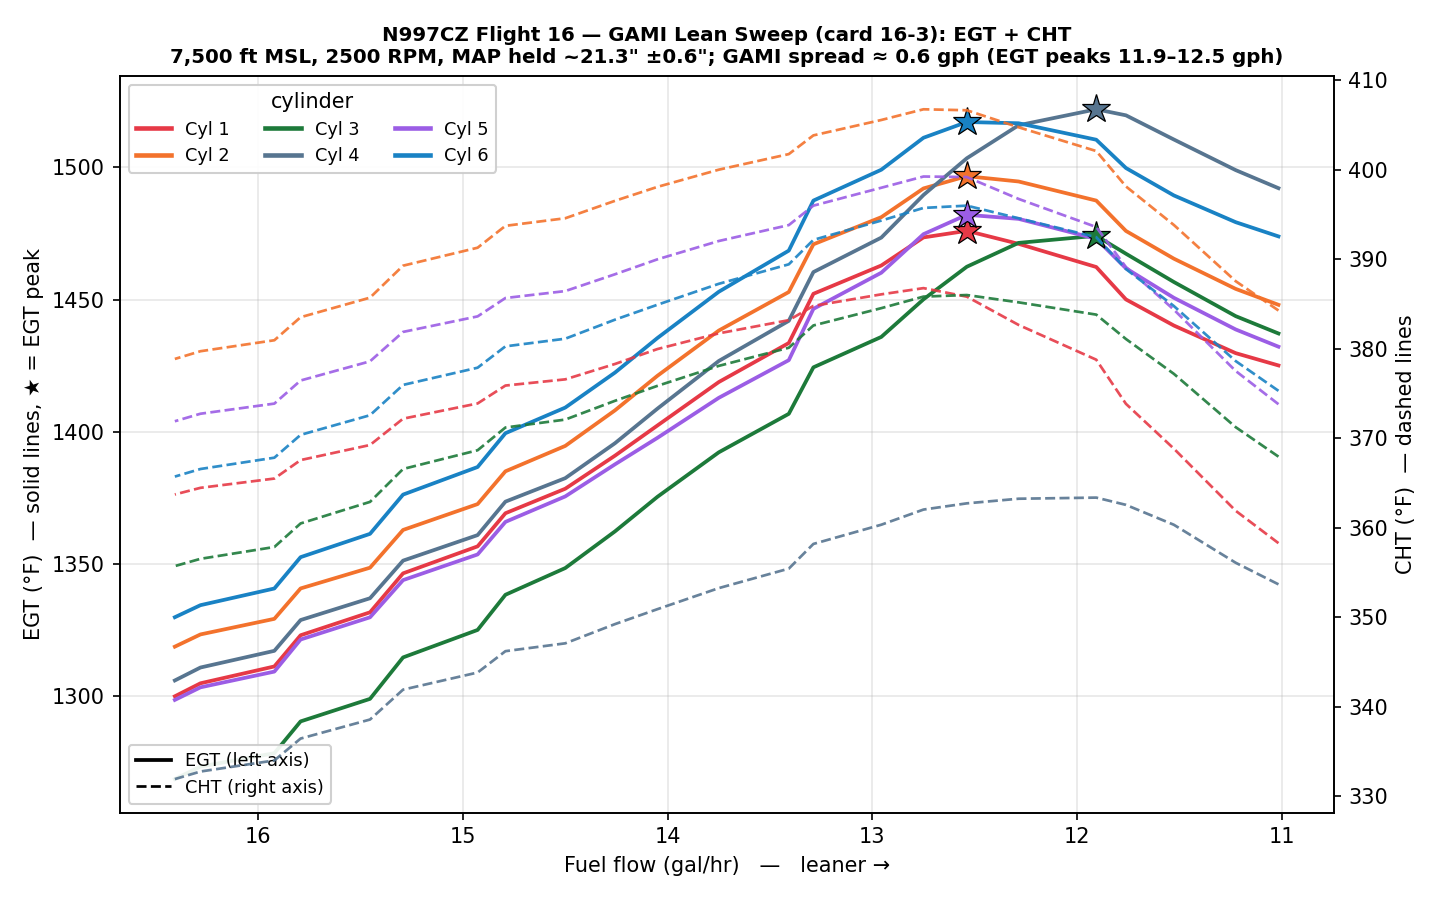
After each polar I ran a GAMI lean sweep — slowly leaning at a held manifold pressure and watching the order in which each cylinder’s EGT peaks. The spread between the first and last cylinder to peak is the GAMI spread, the classic measure of how evenly the fuel injectors are matched.
The result was tight and consistent:
- 2600 RPM: 0.50 gph spread
- 2400 RPM: 0.55 gph spread
- 2500 RPM (F16 reference): ≈ 0.6 gph
All comfortably under the ~1.0 gph rule of thumb for “well-matched” injectors — and notably, the spread barely moved with RPM. The ordering was the same both sweeps too: Cylinder 1 runs leanest, Cylinder 4 richest. Same fingerprint we saw on Flight 16. Nothing to chase here.
And just like Flight 16, it’s worth seeing each lean sweep in the same form as the polar table — fuel flow, power, speed, and economy as the mixture comes back. Watch the Power column: it barely moves (the throttle’s parked), so the leaning alone is buying the economy, and the speed holds right up until the very lean end.
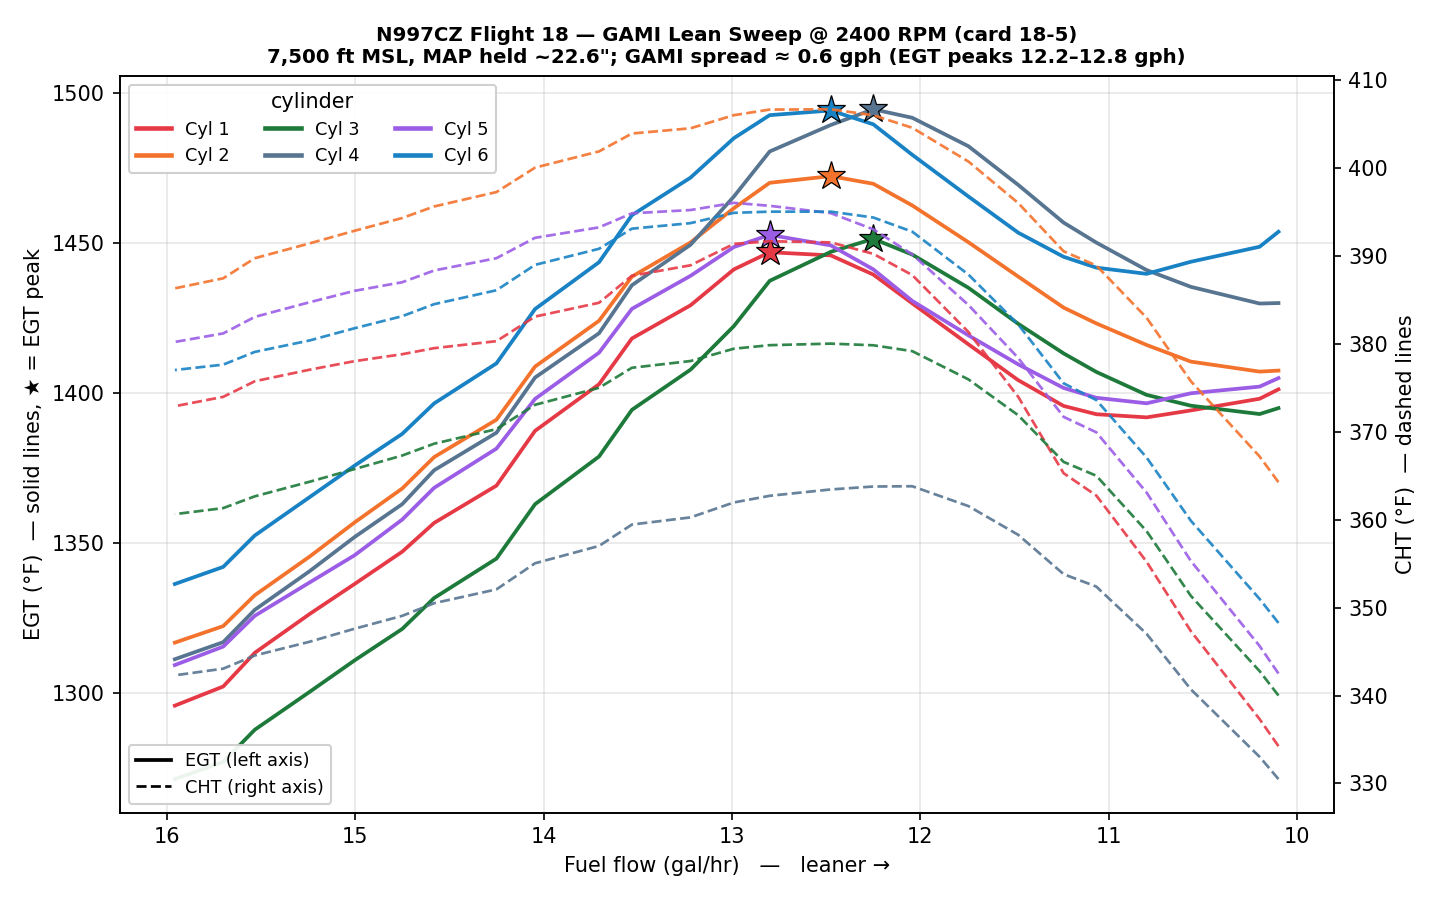
2400 RPM lean sweep (manifold pressure held ~22.6″, 7,500 ft):
| Fuel flow | Power | TAS | Economy |
|---|---|---|---|
| 15.9 gph | 67% | 165 kt | 10.4 nm/gal |
| 15.0 gph | 67% | 167 kt | 11.1 nm/gal |
| 14.0 gph | 67% | 167 kt | 11.9 nm/gal |
| 13.0 gph | 68% | 166 kt | 12.8 nm/gal |
| 12.5 gph | 67% | 165 kt | 13.2 nm/gal |
| 12.0 gph | 67% | 162 kt | 13.5 nm/gal |
| 11.1 gph | 66% | 156 kt | 14.1 nm/gal |
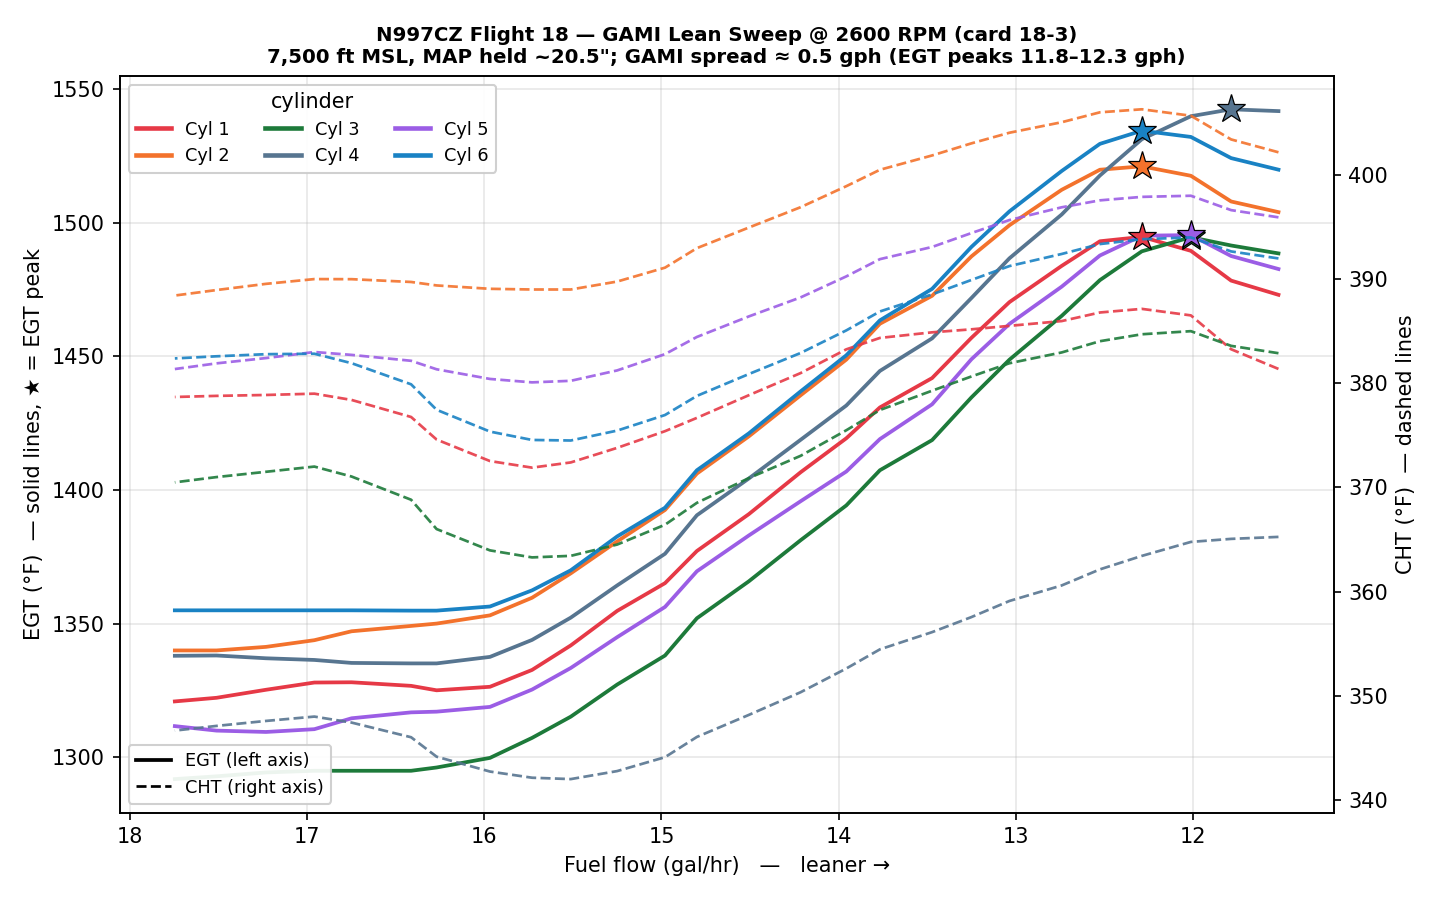
2600 RPM lean sweep (manifold pressure held ~20.5″, 7,500 ft):
| Fuel flow | Power | TAS | Economy |
|---|---|---|---|
| 16.3 gph | 66% | 164 kt | 10.1 nm/gal |
| 15.0 gph | 66% | 164 kt | 10.9 nm/gal |
| 14.0 gph | 64% | 162 kt | 11.6 nm/gal |
| 13.0 gph | 65% | 162 kt | 12.5 nm/gal |
| 12.5 gph | 65% | 161 kt | 12.9 nm/gal |
| 12.0 gph | 65% | 157 kt | 13.1 nm/gal |
| 11.5 gph | 66% | 156 kt | 13.6 nm/gal |
The same trend the polars showed turns up here too: at a matched ~67% power, the 2400 sweep holds ~166 kt while leaning all the way down, bottoming out near 14 nm/gal — a touch better than 2600’s best of ~13.6. Lower RPM keeps winning, lean or rich.
Health check: cool, clean, and steady
- Cylinder head temps: the hottest airborne reading was 412°F (CHT2, during the climb); the cruise sweeps stayed at or below 399°F. Everything well under the 450°F redline.
- Carbon monoxide: cabin CO peaked at just 2 ppm (mean 0.03) — benign. Worth noting because Flight 16 read a flat zero all flight, which I’ve flagged as a detector anomaly; Flight 18’s normal, non-zero trace confirms the detector is alive and reading.
- Attitude (AHRS): another flight since Garmin replaced the second AHRS unit, and it stayed rock-solid — cross-unit pitch differences ≤ 5.4°, roll ≤ 3.3°, and zero of the big deviation spikes that plagued the airplane before the swap.
All three sweeps, side by side
To put the three lean sweeps in one place — each cell stacks three values: economy (nm/gal), TAS, and mixture (degrees F rich or lean of peak EGT, ROP / LOP), at that fuel flow, all at 7,500 ft. A dash means that sweep didn’t reach that fuel flow:
| Fuel flow | 2400 RPM | 2500 RPM | 2600 RPM |
|---|---|---|---|
| 18.0 gph | — | — | 9.3 nm/gal 166 TAS 178 ROP |
| 17.5 gph | — | — | 9.4 nm/gal 166 TAS 178 ROP |
| 17.0 gph | — | — | 9.9 nm/gal 168 TAS 176 ROP |
| 16.5 gph | — | 9.9 nm/gal 161 TAS 173 ROP | 10.1 nm/gal 164 TAS 175 ROP |
| 16.0 gph | 10.4 nm/gal 165 TAS 147 ROP | 10.2 nm/gal 162 TAS 164 ROP | 10.2 nm/gal 163 TAS 168 ROP |
| 15.5 gph | 10.7 nm/gal 166 TAS 135 ROP | 10.6 nm/gal 164 TAS 143 ROP | 10.5 nm/gal 163 TAS 153 ROP |
| 15.0 gph | 11.1 nm/gal 167 TAS 114 ROP | 11.0 nm/gal 163 TAS 122 ROP | 10.9 nm/gal 164 TAS 131 ROP |
| 14.5 gph | 11.4 nm/gal 166 TAS 91 ROP | 11.3 nm/gal 163 TAS 99 ROP | 11.2 nm/gal 163 TAS 105 ROP |
| 14.0 gph | 11.9 nm/gal 167 TAS 66 ROP | 11.6 nm/gal 163 TAS 71 ROP | 11.6 nm/gal 162 TAS 79 ROP |
| 13.5 gph | 12.2 nm/gal 166 TAS 36 ROP | 12.3 nm/gal 163 TAS 41 ROP | 12.0 nm/gal 162 TAS 50 ROP |
| 13.0 gph | 12.8 nm/gal 166 TAS 11 ROP | 12.5 nm/gal 163 TAS 12 ROP | 12.5 nm/gal 162 TAS 23 ROP |
| 12.5 gph | 13.2 nm/gal 165 TAS peak | 13.1 nm/gal 161 TAS peak | 12.9 nm/gal 161 TAS 4 ROP |
| 12.0 gph | 13.5 nm/gal 162 TAS 9 LOP | 13.4 nm/gal 160 TAS 2 LOP | 13.1 nm/gal 157 TAS peak |
| 11.5 gph | 13.7 nm/gal 157 TAS 26 LOP | 13.7 nm/gal 157 TAS 18 LOP | 13.6 nm/gal 156 TAS 2 LOP |
| 11.0 gph | 14.1 nm/gal 156 TAS 43 LOP | 14.0 nm/gal 154 TAS 28 LOP | — |
| 10.5 gph | 13.9 nm/gal 147 TAS 49 LOP | — | — |
Each cell stacks economy (nm/gal), TAS, and mixture (degrees F rich or lean of the engine-average peak EGT). Only the 2600 sweep was run up into the rich 17–18 gph range; only 2400 was leaned past 11 gph (the dashed corners). Since this engine runs a conventional left mag against the SDS electronic ignition on the right, treat the absolute ROP/LOP numbers as approximate; the trend across the sweep is what matters.
Read the table by the second value in each cell — true airspeed — and 2400’s advantage is plain: at any fuel flow from about 16 down to 12 gph, the 2400 sweep holds roughly 3–5 knots more TAS than 2600 for the same fuel burn (and a couple of knots over 2500), at equal-or-better economy. The sweet spot is a lean cruise around 12.0–12.5 gph — right at peak EGT or a hair lean of it (see the mixture value) — where 2400 returns ~13.2–13.5 nm/gal and still makes 162–165 kt. You’ve leaned into the efficient range and barely given up any speed, while at that same fuel flow 2600 is down near 157–161 kt. The three only converge at the very lean end (~11.5 gph and below), where speed tails off for all of them. Lean or rich, the lower RPM keeps the airplane moving faster on the same gas — and ~2400 RPM at ~12–12.5 gph looks like the efficient-cruise sweet spot.
Bottom line
If you fly an RV-10 (or really any constant-speed-prop airplane) and you want range, the cheapest “modification” available is your right hand on the prop control: pull the RPM back. On N997CZ, 2400 RPM cruises at essentially the same speed as 2600 while burning about 3 gph less. The injectors are well matched at any RPM, the engine stays cool, and nothing about lower-RPM cruise costs you anything but a few knots.
Next I’d like to repeat this in smoother, more stable air and tie it to a fuel-flow endurance number — but the trend is already clear enough to change how I set cruise.
Test cards flown: Flight 18 (cards 18-1 through 18-5). Cruise analysis and charts generated from the G3X data log. See also Flight 16: Cruise Numbers and Three Healthy Horizons for the 2500 RPM baseline.