Flight 19 put Harry Tsepelias back in the left seat for another go in N997CZ. It wasn’t a formal test card — more of a shakedown and stick time — but it gave the autopilot a long, honest workout, and that finally pinned down a roll-autopilot squawk we’ve been chasing: it just wasn’t aggressive enough rolling into turns. The good news is everything else on the airplane behaved beautifully.
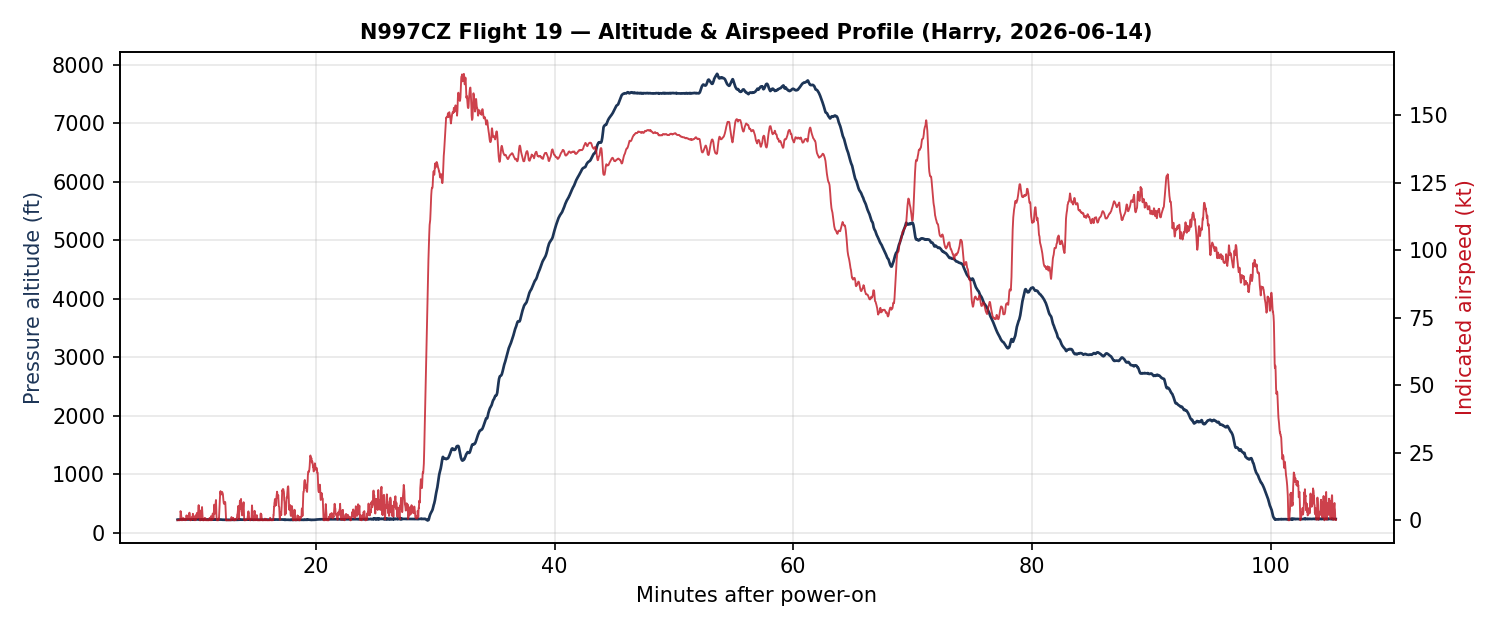
A quick snapshot of the flight: engine start 09:42, shutdown 11:19 — about 1.6 hours — out of KHEF, up to 7,830 ft MSL (8,238 ft GPS), 165 KIAS / 172 kt true at the fast end, 18.6 gallons burned (all from the right tank, no switch).
The autopilot is slow to roll into a turn
The squawk is easy to feel from the seat: dial in a big heading change with the heading bug, and the flight director snaps to a commanded bank — but the airplane is slow to roll into it, as if the servo can’t push the ailerons over. I’d been chasing it for a few flights mostly by adding muscle, walking the roll-servo maximum torque up 15% → ~40% → 90%. It helped, but never quite cured it. So I went digging in the logs to settle the real question: is the autopilot short on muscle, or just using it badly?
One other autopilot note worth logging: during a slower segment the system briefly went to its “minimum airspeed” protection (it annunciated for about 38 seconds, along with nose-up trim commands). That’s the autopilot refusing to fly slower than its configured floor — and it’s exactly why lowering that minimum-airspeed setting is on the to-do list, so the AP can fly the slower approaches we want for upcoming testing.
Following the thread: muscle or gain?
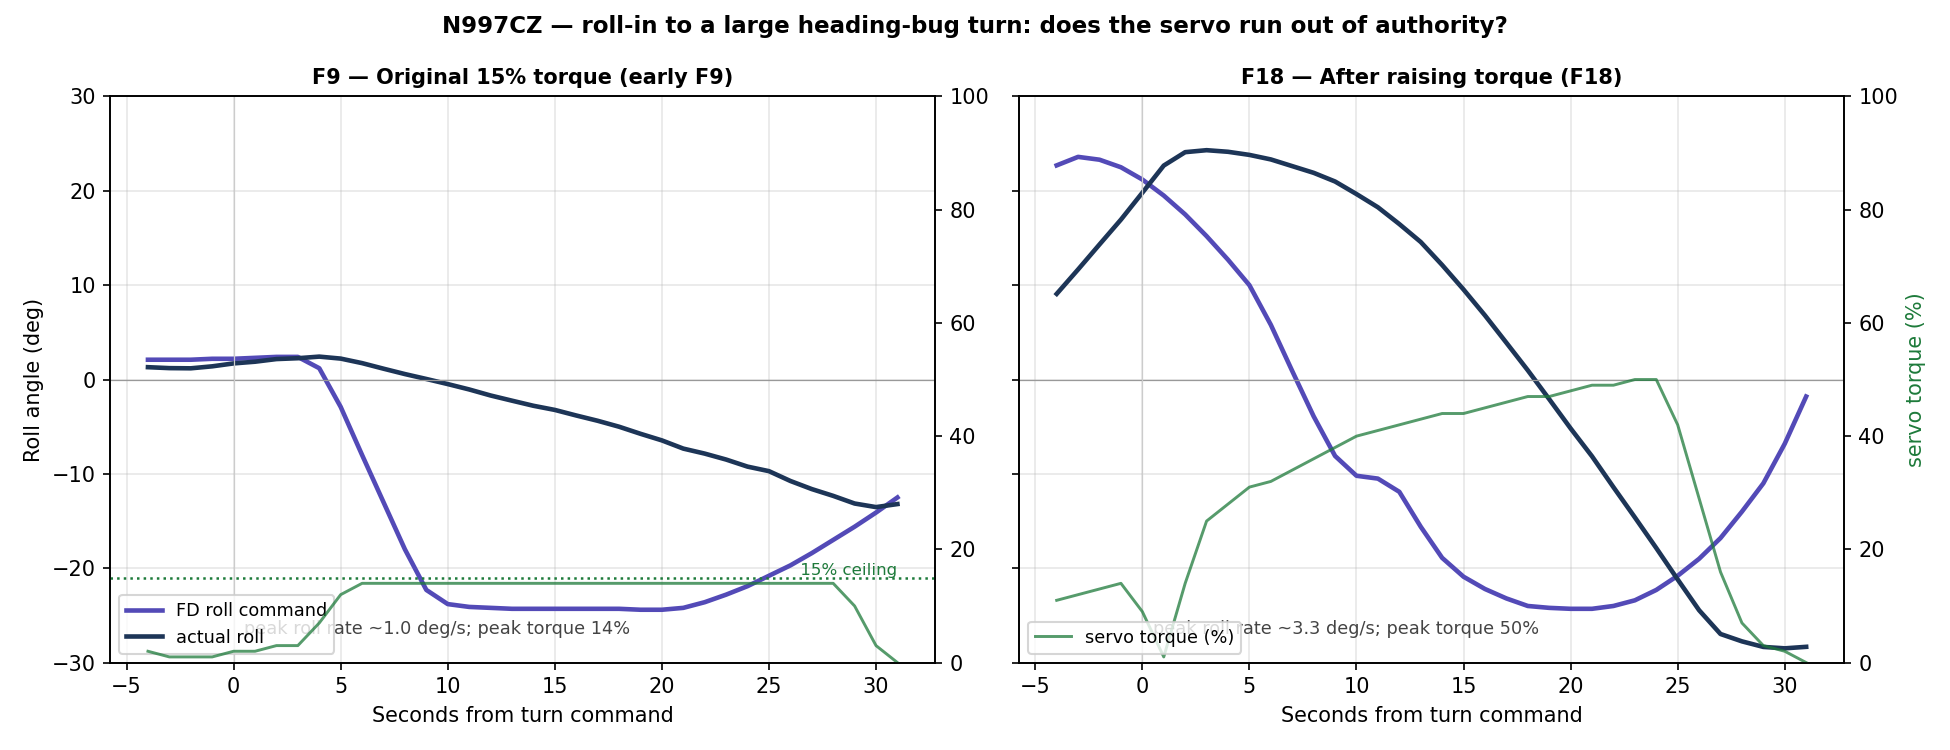
Early on, the sluggishness was real torque starvation. Back on Flight 9 the roll servo’s max torque was set to just 15%, and on a big heading-bug turn the servo pegged that 15% ceiling and the airplane rolled in at about 1° per second — never even reaching the commanded bank. That’s the “no strength to move the ailerons” feeling, and it’s exactly why I kept raising the torque.
Roll-in to a 24° heading-bug turn: at 15% torque (left) the servo pegs its ceiling and the airplane barely rolls; after raising it (right) the airplane follows the command.
Raising the torque fixed the authority problem. But here’s the catch: at the current 90% setting the roll-in is still gentle — and when I pull the numbers, the servo is only using about 20–45% of its torque during those turns. It never gets near 90%. It’s no longer out of muscle; it has plenty in reserve and simply isn’t using it.
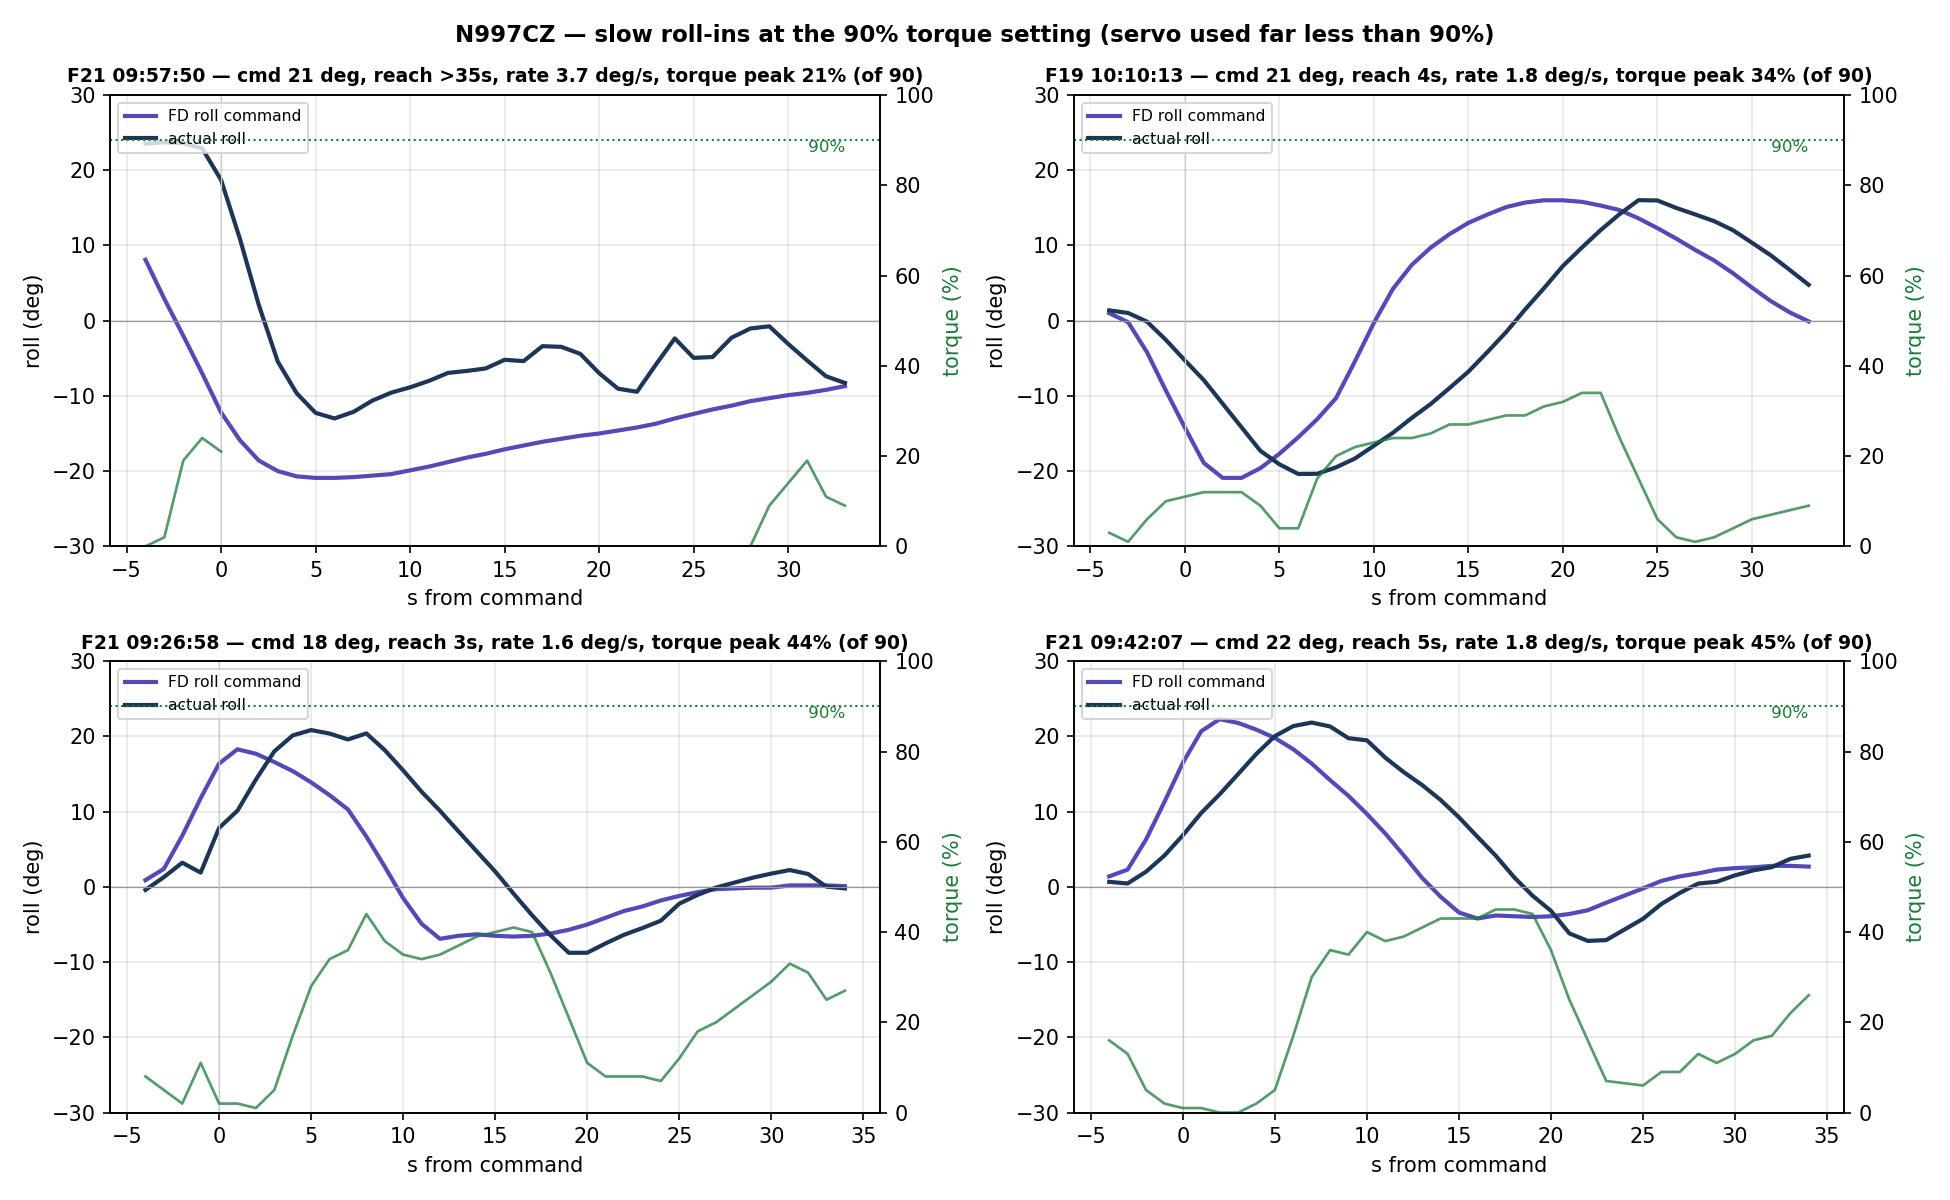
Four heading-bug turns at the 90% torque setting — the airplane (navy) lags the flight director command (purple) into the bank while servo torque (green) stays well below the 90% line.
In each of these four heading-bug turns, the actual roll trails the flight director’s commanded bank by several seconds, rolling in at only ~1–3° per second — and the servo torque sits far below the 90% line the whole time. The autopilot has authority to spare and just isn’t asking for it.
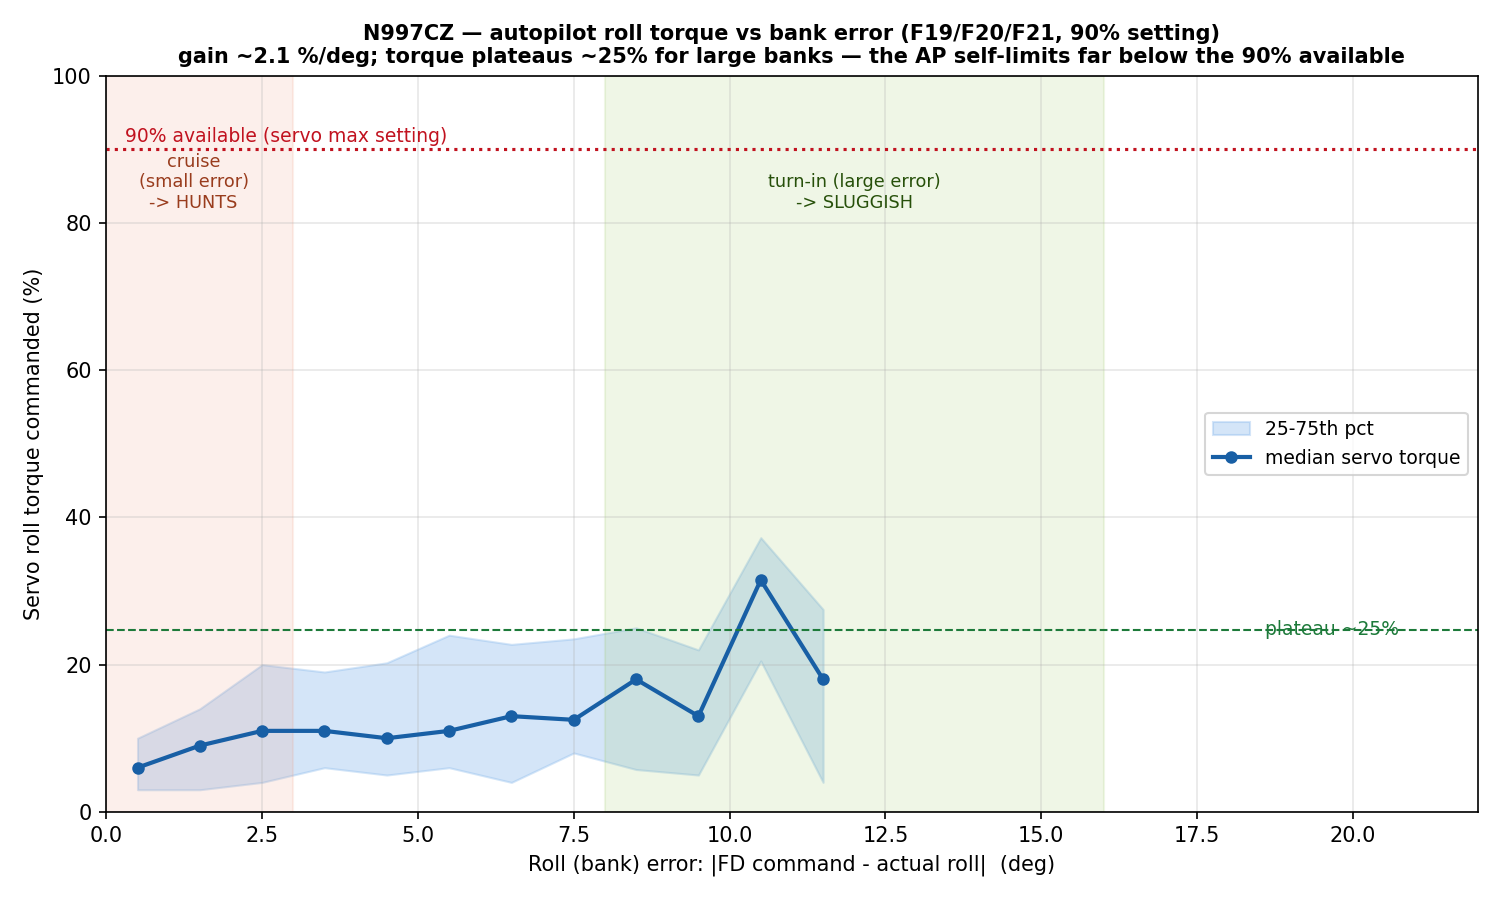
The clincher is the autopilot’s torque-versus-bank-error curve. Pooling every autopilot-flown turn on the recent flights, the servo commands only about 2% torque for every degree the airplane is off the commanded bank, and it plateaus around 25% even when the wing is more than 10° from where it should be:
Servo torque vs bank error — the gain is only ~2%/deg and torque plateaus near 25% of the 90% available.
That’s the signature of a roll gain set too low — the autopilot is under-driving a servo that has torque to spare. And Garmin’s roll servo has exactly two knobs: Max Torque (the muscle, which I’d been raising) and Roll Servo Gain — literally “how aggressively the servo moves the ailerons,” adjustable from 0.05 to 10.00. Mine is sitting around 0.6, down near the bottom of the range.
So I’d been turning the wrong knob. The fix for the sluggish turns isn’t more torque, it’s more gain — telling the servo to use the authority it already has. If raising the gain doesn’t crisp up the roll-in, the next suspect is mechanical friction in the aileron circuit, which the Garmin servo can test for with a clutch-slip check.
Everything else: healthy
While I chase the autopilot tuning, the rest of the airplane turned in one of its cleaner data sets:
Engine temps: the hottest cylinder head was Cylinder 5 at 416°F — still the air-dam “canary” that runs warmest in the climb — with Cylinder 4 coolest at 379°F. Everything comfortably under the 450°F redline.
Carbon monoxide: cabin CO peaked at 6 ppm (mean under 1) — benign, and the normal non-zero trace confirms the detector is reading correctly.
Attitude (AHRS): rock-solid. Another flight since Garmin replaced the second AHRS — cross-unit deviations stayed under 400%, with zero of the big >500% spikes from the bad-unit era and roll disagreement never over 2.3°. The roll squawk is an autopilot-tuning issue, not an attitude-sensing one — the AHRS knew exactly where the wing was.
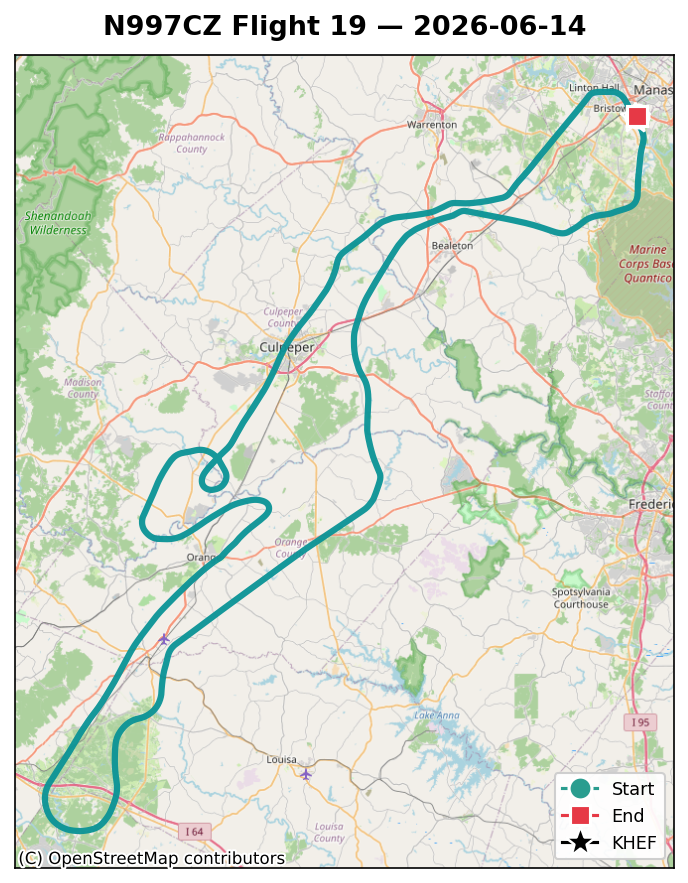
Flight 19 altitude and airspeed profile.Flight 19 ground track (KHEF test area).
Bottom line
Flight 19’s headline is a course correction, not a triumph: I’d been adding torque to a roll autopilot that was actually short on gain. The servo has muscle to spare — it uses only a quarter of what’s available — and just needs to be told to use it. So the next session is about raising the Roll Servo Gain a few steps at a time (Garmin’s in-air method: overpower the autopilot off the commanded bank, release, and watch how crisply it drives back), leaving the torque where it is. Engine, fuel, CO, and the overhauled attitude system all came home clean. Thanks to Harry for the stick time and the careful notes that made this one easy to pin down.
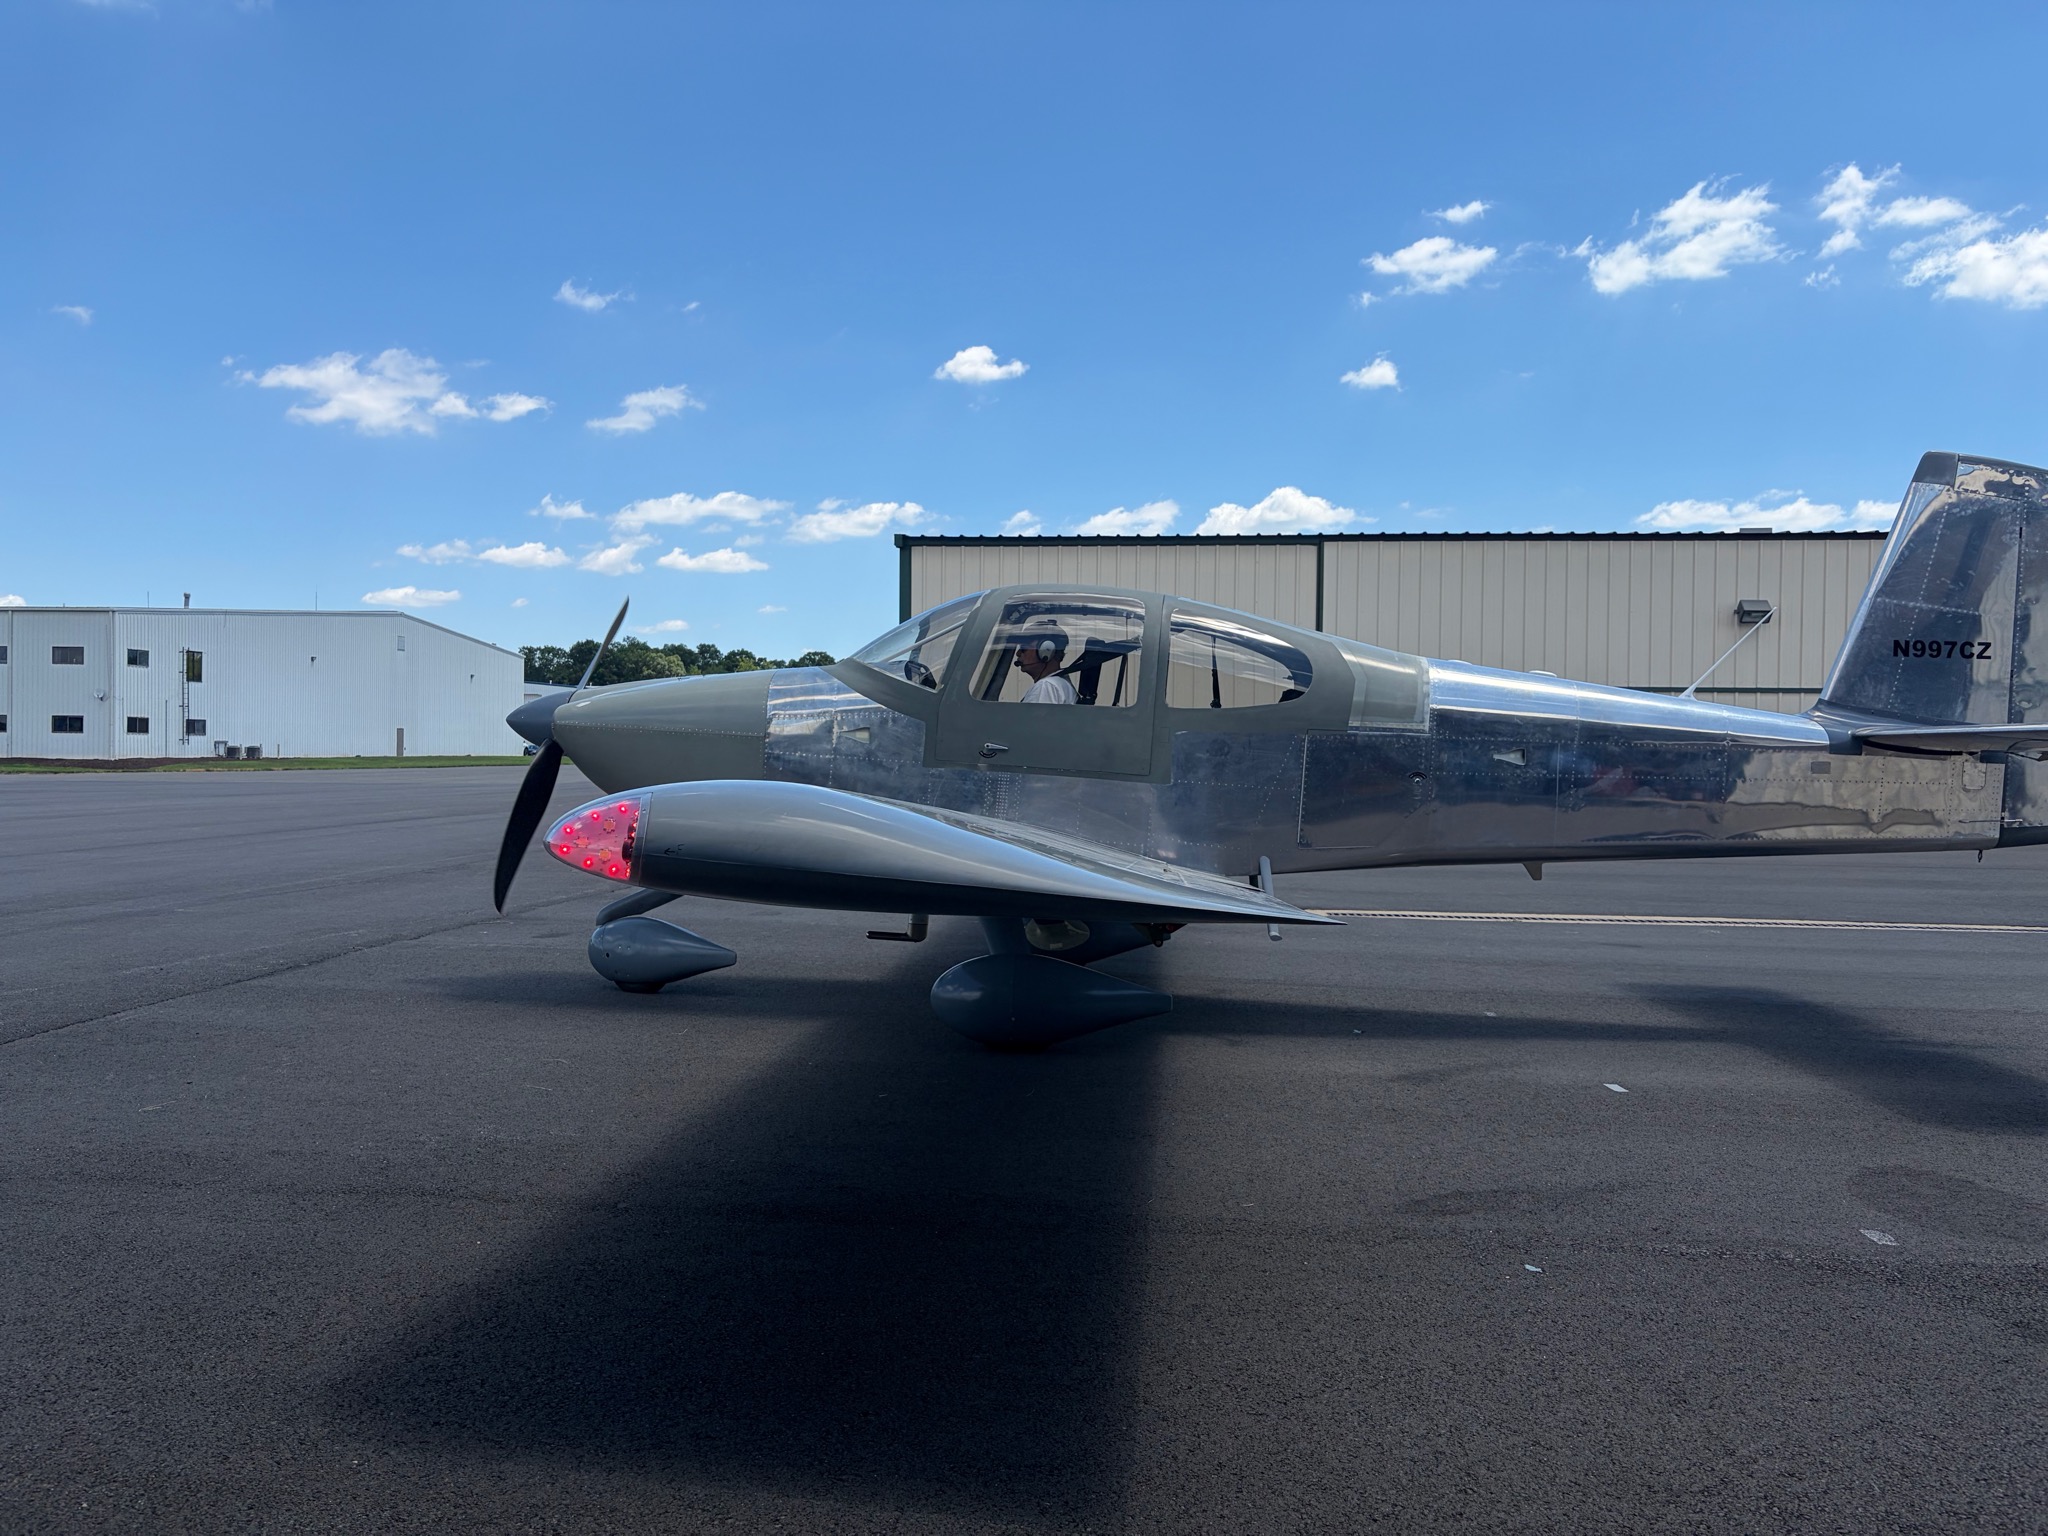
N997CZ on the ramp at KHEF, ready for Harry’s first flight
Three owners, three pilots — and as of this afternoon, all three have now flown the airplane. Flight 14 was Dan’s first flight; Flight 17 was Harry’s. Harry is no stranger to the family — he’s a partner in our RV-7 too, and a seasoned RV hand — but this was his first time at the controls of the RV-10. I flew the morning’s cruise-and-leaning card solo (Flight 16); in the afternoon I handed N997CZ over, stood out on the ramp with the camera, and watched the third member of the partnership take our airplane up.
The Numbers
Date
2026-06-13 (afternoon)
Engine time
~1.3 hr
Engine hours
23.9 → 25.2
Max altitude
~4,545 ft MSL (4,795 ft GPS)
Fuel used
14.9 gal (totalizer)
Profile
familiarization — no test cards
Conditions
warm afternoon (cruise OAT +63 °F)
No test-card link this time — like Dan’s flight, this was a familiarization sortie, flown rich and relaxed. The cards stayed in the binder.
From the Ramp
Harry took his time with it — a long, unhurried run-up and taxi before rolling, a good 24 minutes of ground time before brake release. That’s exactly how a first flight in a new-to-you airplane should go, and no surprise from someone who already knows his way around an RV.
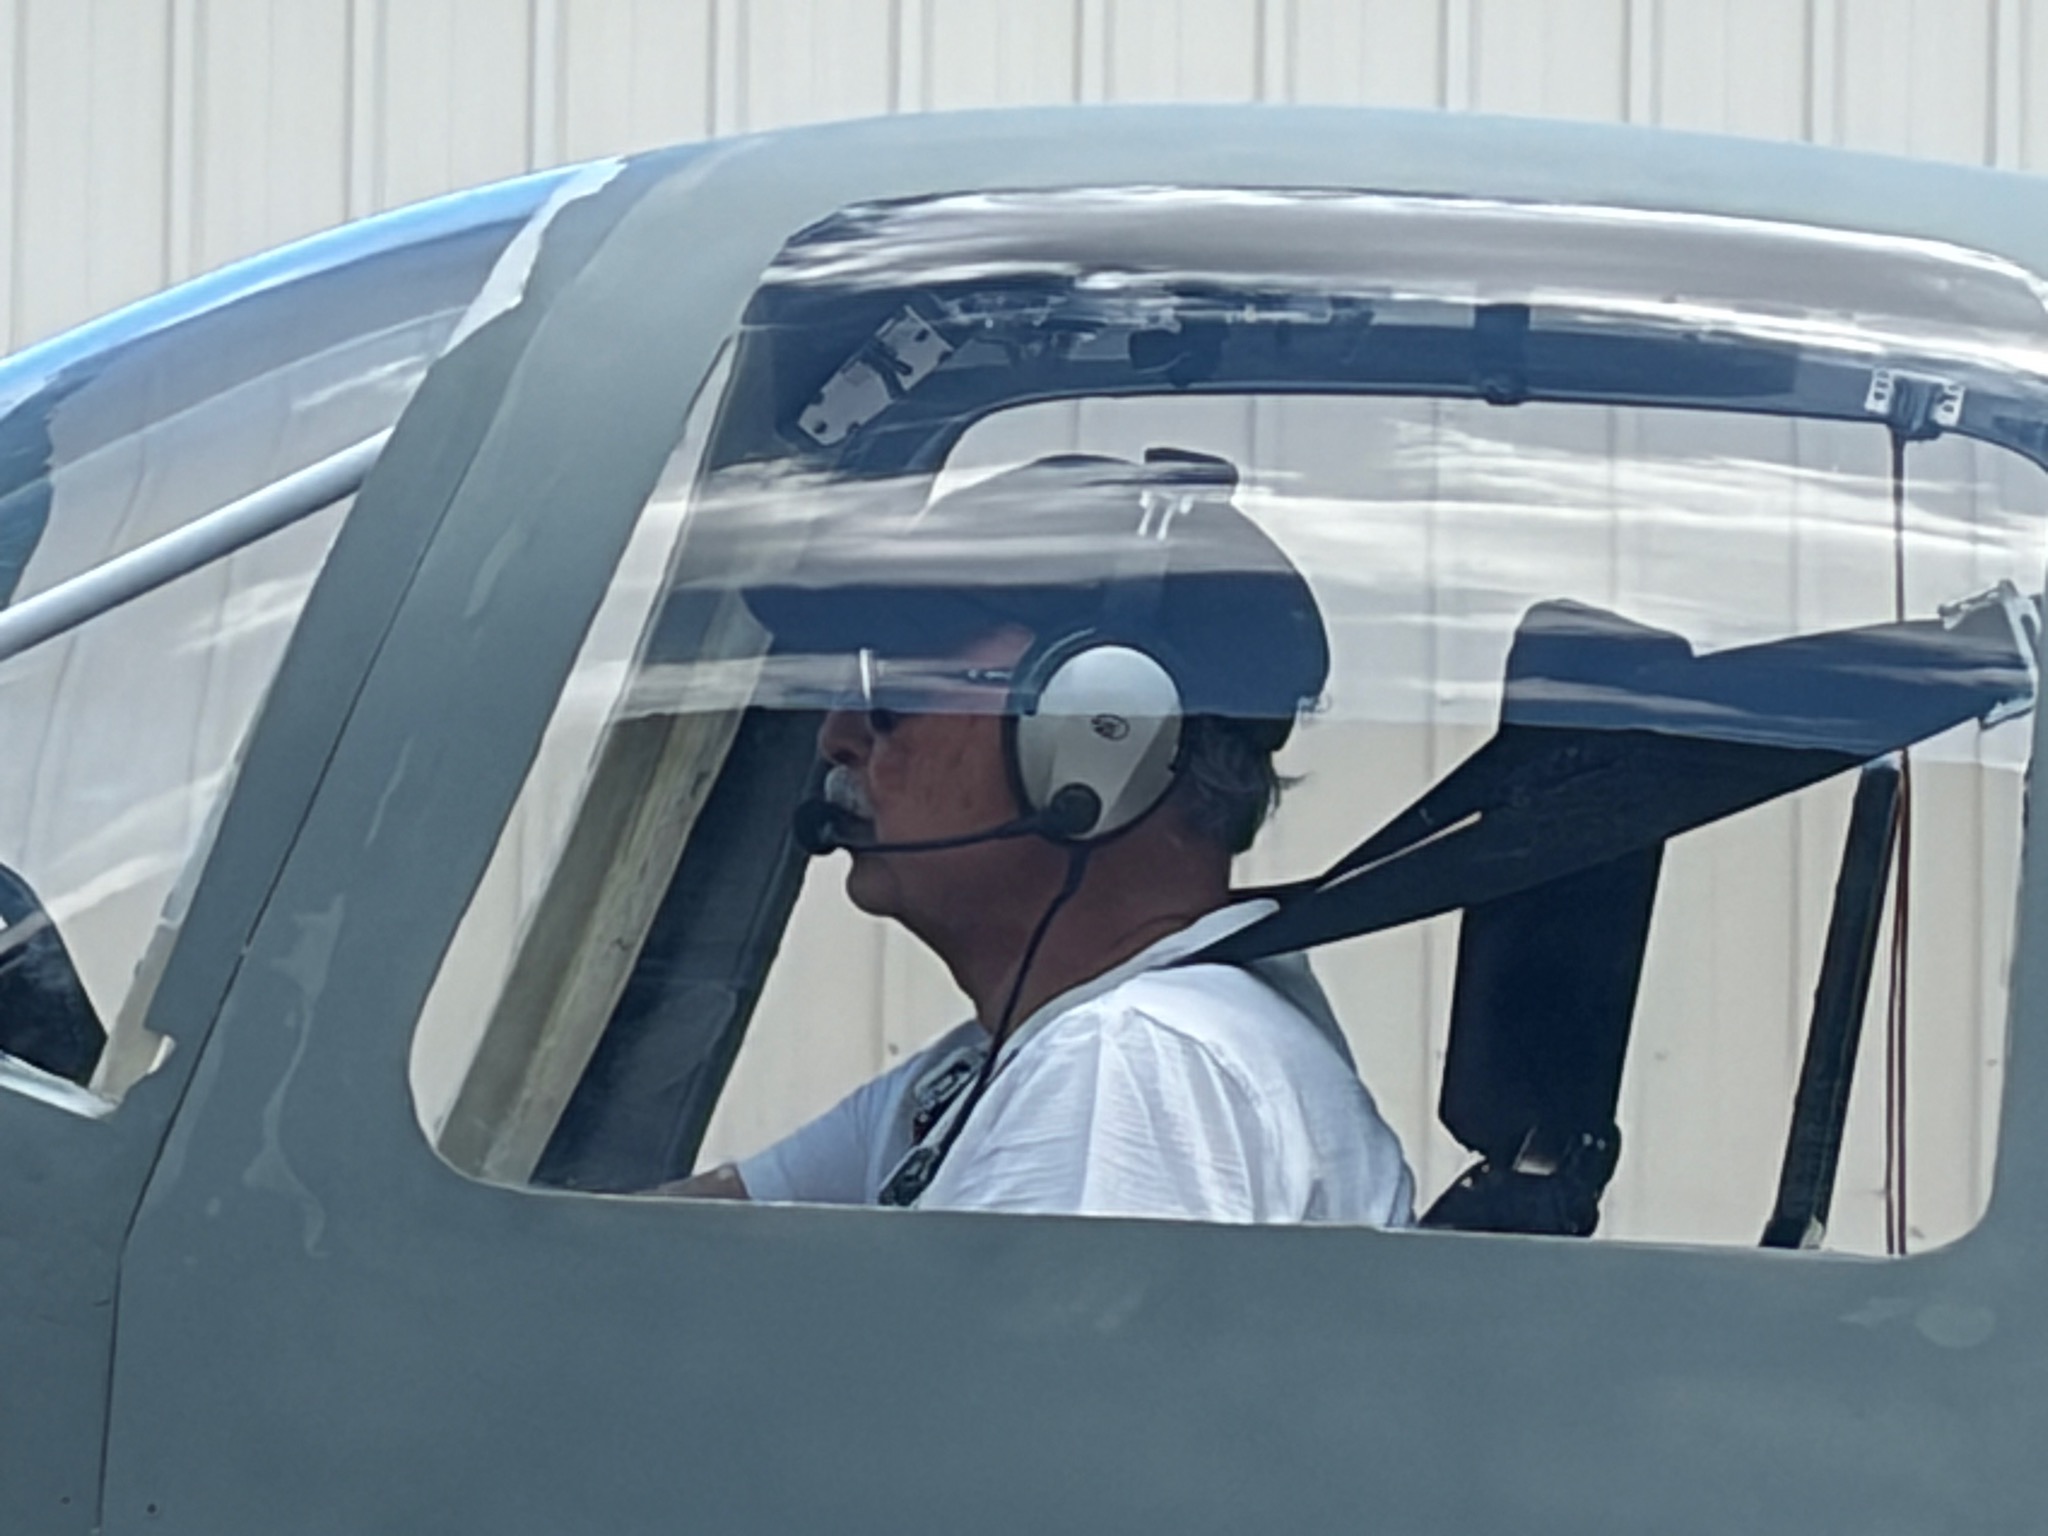
Harry in the left seat of N997CZ before his first flight in the -10
Harry taxis out for his first flight in N997CZ
The Flight
Harry’s first takeoff in the RV-10
A proper get-comfortable hop: a cruise out to the southwest toward the Culpeper/Orange practice area and back, mostly down low (max ~4,500 ft MSL) and quick — about 167 knots true in cruise, full rich, no leaning. Nothing aggressive: no stalls, no steep stuff beyond gentle 30°-bank turns. Just stick time, getting the feel of the airplane’s weight, trim, and sight picture.
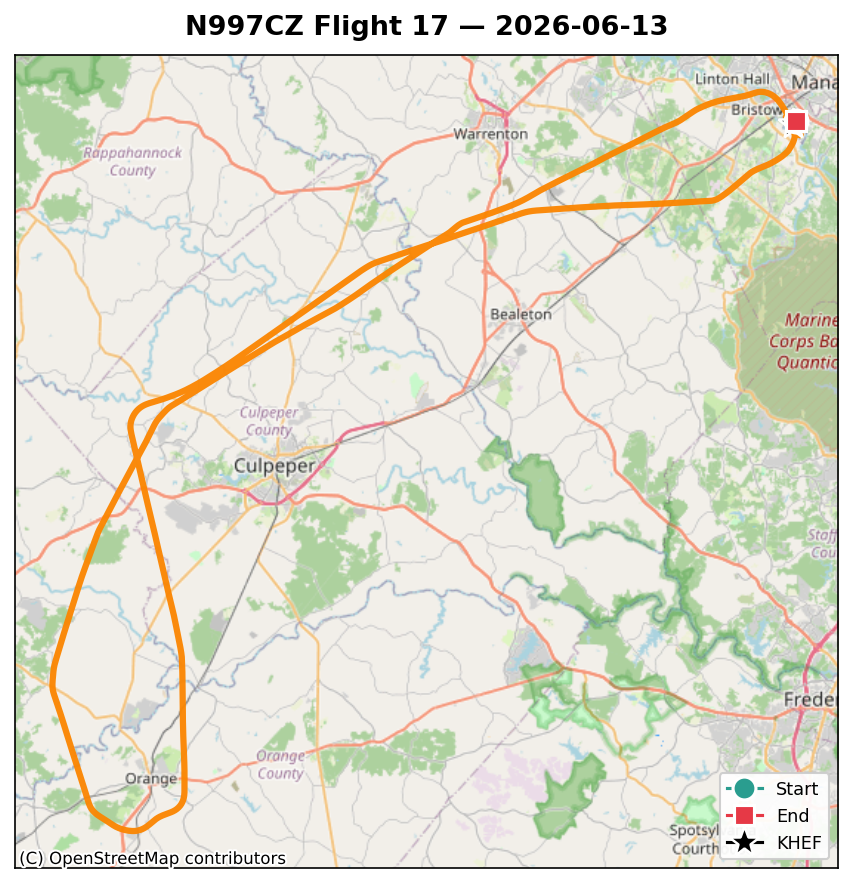
The ground track is a clean out-and-back — none of the test-pattern geometry of a card flight, just a flight with somewhere to go and back.
N997CZ’s Flight 17 ground track — an out-and-back to the southwest toward Culpeper and Orange
A couple of systems notes from the ride. Cabin CO peaked at a benign 6 ppm during the low cruise — worth a mention because it confirms the detector was reading normally, which retroactively makes the flat zero on the morning’s Flight 16 the genuine oddity to keep watching. CHTs ran warm-but-fine on the rich, low-altitude profile (hottest cylinder 430 °F), and the attitude system stayed rock-steady the whole flight — fitting, since this airplane’s long-running attitude saga had finally closed out that same day, with all three sources verified healthy.
Harry taxis in after his first flight in N997CZ
Bottom Line
The whole partnership is now checked out in N997CZ. Harry has the airplane in his logbook, it behaved exactly as it should, and Phase 1 rolls on.
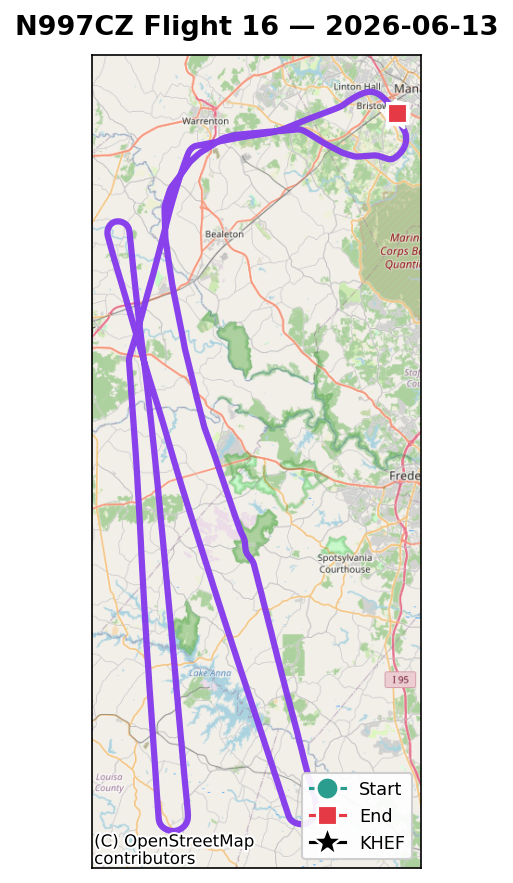
N997CZ’s Flight 16 ground track — long, straight test legs for stabilized cruise points
After the climb sortie, Flight 16 turned to the next block in the Phase 1 deck: cruise performance and leaning. Pick one altitude, hold it dead steady, and step through power and mixture settings, logging speed and fuel flow at each stabilized point. The ground track tells you what that looks like from above — long, patient straight legs instead of the racetracks and sawtooths of the maneuvering flights.
It was also quietly historic for a different reason: this was the first flight with both attitude units overhauled (more on that below).
The Numbers
Date
2026-06-13 (morning)
Engine time
~1.7 hr
Engine hours
22.2 → 23.9
Test altitude
7,500 ft MSL, 2500 RPM (density alt ~8,900 ft)
Max altitude
~7,550 ft MSL (7,905 ft GPS)
Fuel used
22.7 gal (totalizer) — matched the truck receipt (21.70 gal) to ~1 gal
The heart of the flight: hold 7,500 ft and 2500 RPM, then step the throttle down through a range of manifold pressure, letting the airplane stabilize at each setting. The stabilized points (power is the G3X’s own computed engine percentage):
MAP
Power
Fuel flow
TAS
Economy
22.5″
70%
18.7 gph
168 kt
9.0 nm/gal
21.5″
67%
17.6 gph
164 kt
9.3 nm/gal
20.5″
64%
16.8 gph
162 kt
9.6 nm/gal
19.3″
60%
15.9 gph
156 kt
9.8 nm/gal
17.9″
55%
14.5 gph
149 kt
10.3 nm/gal
16.9″
52%
13.7 gph
141 kt
10.3 nm/gal
14.8″
46%
12.3 gph
133 kt
10.8 nm/gal
It’s the classic trade, made concrete: near wide-open (~22.5″, 70% power, 18.7 gph) the airplane trues a brisk 168 knots but returns only 9.0 nm/gal; pull the throttle back toward 15″ (about 46% power) and you give up roughly 35 knots of true airspeed to gain about 20% in fuel economy — up past 10.8 nm/gal. At a fixed mixture, every extra knot of speed costs efficiency: the balance every cross-country pilot strikes.
Two caveats before anyone quotes these figures. This is not the airplane’s top speed. Every point was flown at a fixed 2,500 RPM — not the 2,700 the engine turns at full power — and at 7,500 ft with the mixture full rich, so even the 168-knot top row is leaving speed on the table compared to full throttle, full RPM, and a more efficient altitude. This is a controlled comparison, not a speed record. And it is not best economy. Full rich is the thirstiest way to make any given power; the real fuel savings come from leaning, which is exactly what the next card went after. Read the table for the shape of the power-speed-fuel trade at one condition, all else held equal — not for the best the airplane can do at either end.
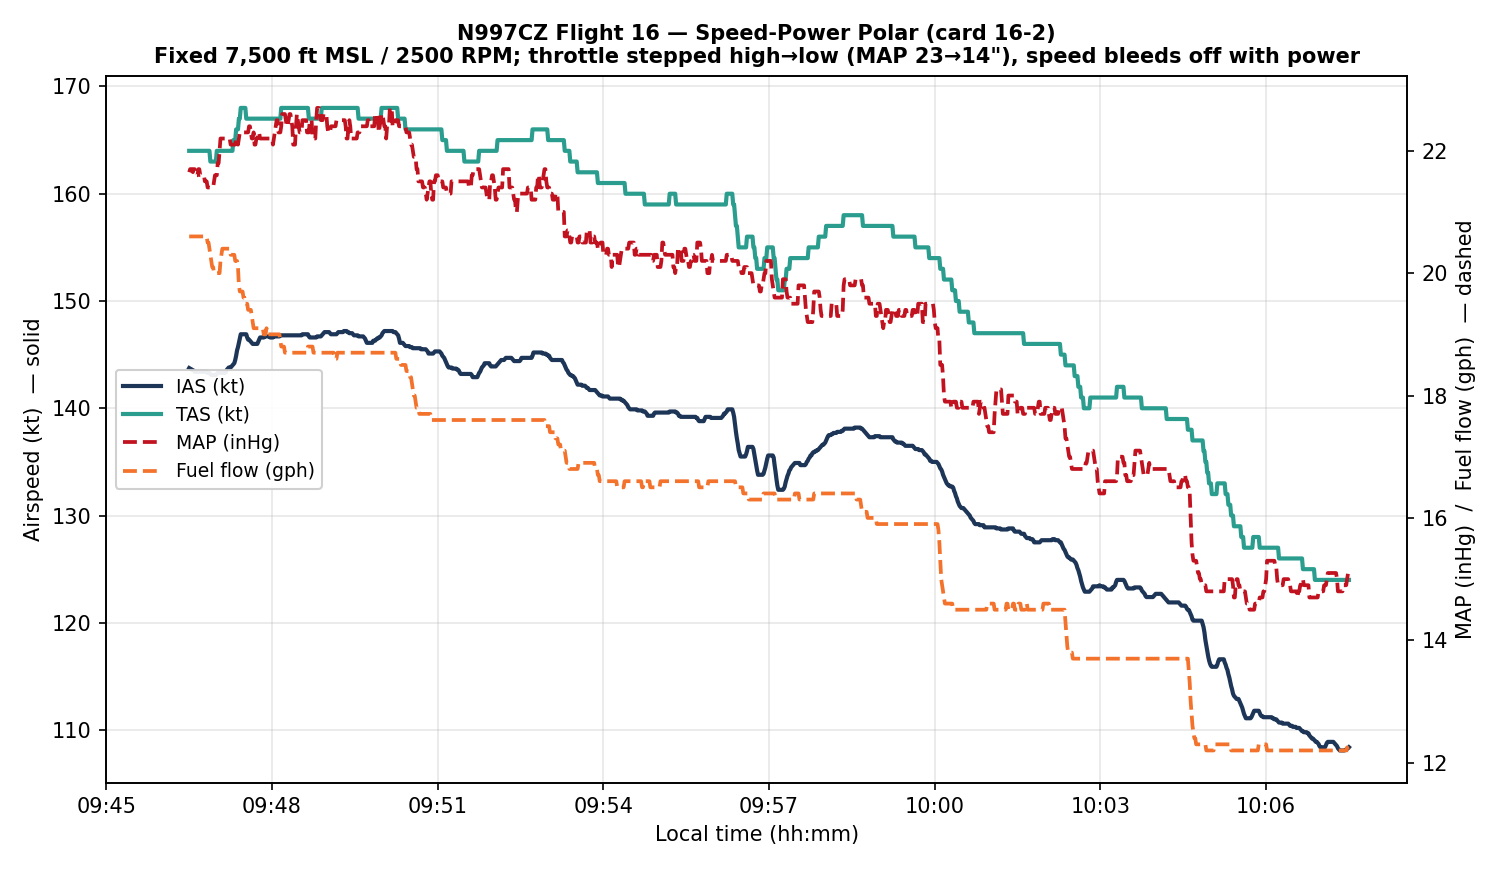
Here’s the whole sequence as flown — throttle stepped down in stages at a fixed altitude, with the airspeed settling out at each new power setting:
Flight 16 speed-power polar — MAP and fuel flow (dashed, right axis) stepped down while IAS and TAS (solid, left axis) bleed off
The Lean Sweep (GAMI Spread)
Then the part I’d been looking forward to: card 16-3, the mixture sweep. Hold the airplane at 7,500 ft and 2500 RPM, leave the throttle alone (manifold pressure parked at ~21.3″, wandering maybe ¾ of an inch), and pull the mixture back slowly — about 16 down to 11 gph — while the G3X logs all six cylinders’ exhaust gas temperatures. Each cylinder’s EGT climbs to a peak and then falls; the fuel flow at which it peaks tells you how rich or lean that cylinder runs relative to the others. The spread between the first and last cylinder to peak is the GAMI spread — the headline number for how well your fuel injectors are matched.
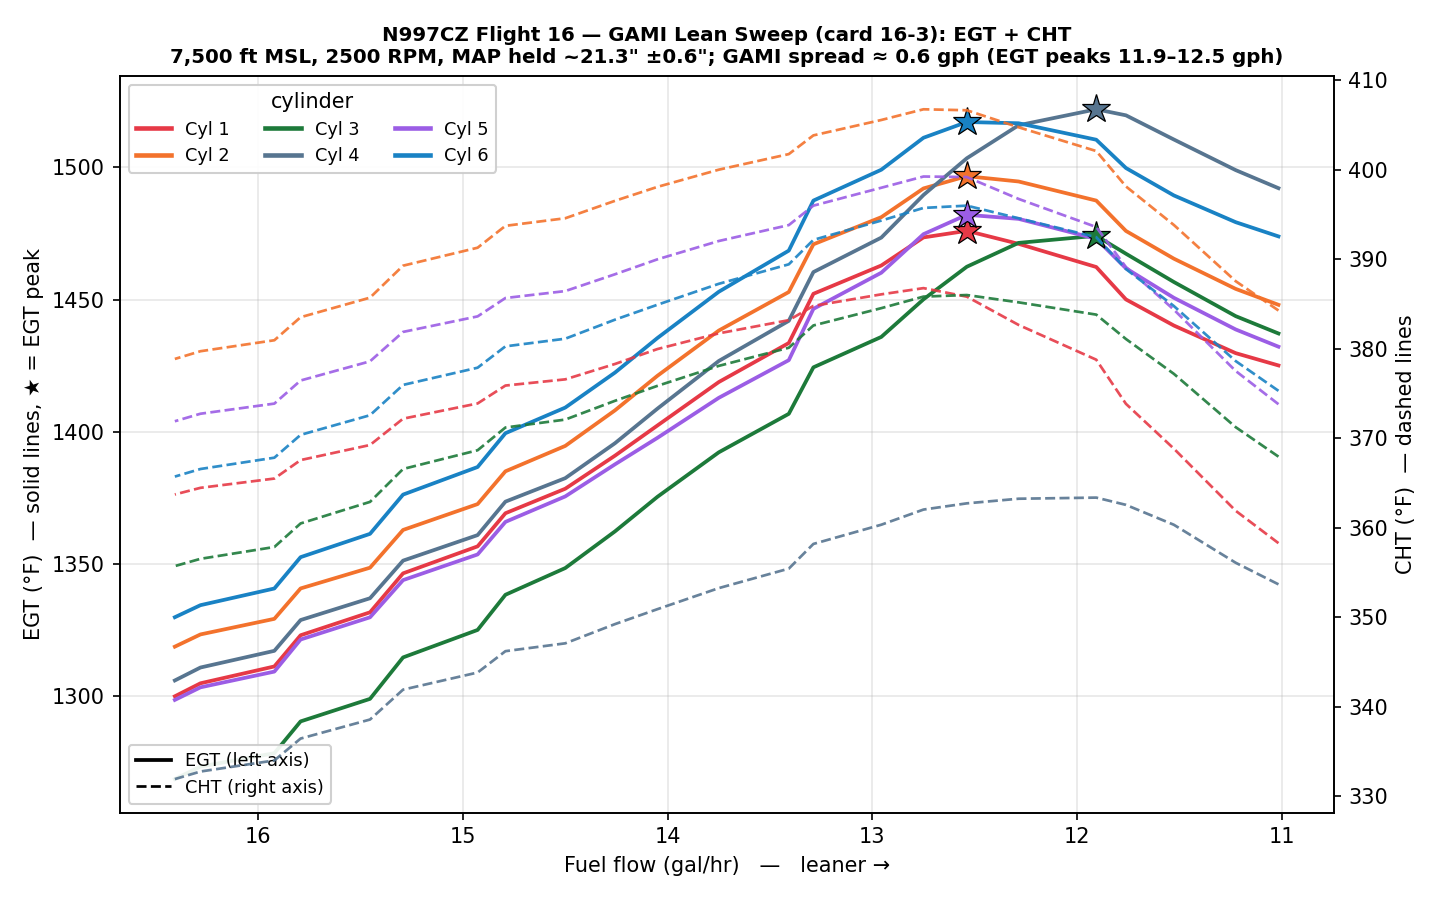
Flight 16 GAMI lean sweep — six EGTs (solid, left axis) rise, peak (★), and fall; CHTs (dashed, right axis) overlaid. GAMI spread ~0.6 gph
The result is a good one: a GAMI spread of about 0.6 gph. Cylinders 1, 2, 5, and 6 peak first (around 12.5 gph — they run slightly leaner), and Cylinders 3 and 4 peak last (around 11.9 gph — slightly richer). Anything under ~1 gph is generally considered well-matched and capable of smooth lean-of-peak operation, so this engine’s injectors are in good shape right out of the box.
The dashed lines on the chart are the cylinder head temperatures (right axis), and they tell their own reassuring story. As expected, each CHT peaks just slightly rich of its EGT peak, and the hottest any head got during the entire sweep was about 407 °F (Cylinder 2) — comfortably below limits the whole time, even at the richest, highest-EGT settings. Leaning this engine doesn’t cook it. (One honest note on method: the curves are read straight off the logged data; with a conventional left mag and the SDS electronic ignition on the right, the absolute EGT picture carries that timing asymmetry, but the relative peak ordering — which is what the spread measures — is robust.)
And here’s the bonus the sweep makes vivid: leaning buys efficiency far more cheaply than throttling back does. Hold the same ~21″ of manifold pressure the polar started at, and instead of closing the throttle, just lean the mixture — the airplane still trues about 163 knots on 13.3 gph, a tidy 12.3 nm/gal (and leaner still, up to ~14 nm/gal). Back on the speed-power polar it took ~18.7 gph of throttle to make that same ~163 knots, at just 9.0 nm/gal. Same speed, roughly a third less fuel. That’s the whole point of leaning, made concrete.
Here’s the sweep in the same form as the polar table above — but watch the Power column, because that’s the whole story. On the polar, economy only improved as power (and speed) came down. Here power holds at ~65% the entire time; leaning alone buys the efficiency, and the speed barely moves until the very lean end:
Fuel flow
Power
TAS
Economy
16.0 gph
64%
162 kt
10.2 nm/gal
15.0 gph
66%
163 kt
11.0 nm/gal
14.0 gph
66%
163 kt
11.6 nm/gal
13.3 gph
66%
163 kt
12.3 nm/gal
12.5 gph
65%
161 kt
13.0 nm/gal
11.5 gph
66%
157 kt
13.7 nm/gal
11.0 gph
65%
155 kt
14.0 nm/gal
(All held at ~21″ MAP and 7,500 ft — the same condition as the GAMI sweep above.)
Cooling and CO
Nothing dramatic, which is the goal in cruise. CHTs stayed comfortable — Cylinder 5 the hottest at 421 °F, everyone else lower, all well under limits. Cabin CO read essentially zero the whole flight. That’s roughly what you’d expect from a stabilized cruise with no sustained slow flight — this airplane’s CO ingress shows up in high-angle-of-attack work, which wasn’t on today’s card — but a flat zero earns an eyebrow rather than a victory lap: Flight 13 also read zero, yet the same detector logged a normal small reading on Flight 17 later the same day. Whether F16’s zero is genuinely clean air or a detector that simply wasn’t reading is still on the verify list.
Three Healthy Horizons
Here’s the quiet milestone. The overhauled second attitude unit (AHRS #2) was installed before this flight, so Flight 16 is the first time N997CZ has flown with both ADAHRS units overhauled. The verification was clean: through the whole flight, from takeoff roll to landing, the two units disagreed by less than a degree in roll, there were no re-aligns, and — for the first time in a long time — zero attitude or heading miscompare annunciations. After a long-running saga, the airplane finally has three attitude opinions that all agree. The full story is in the AHRS post.
After Shutdown
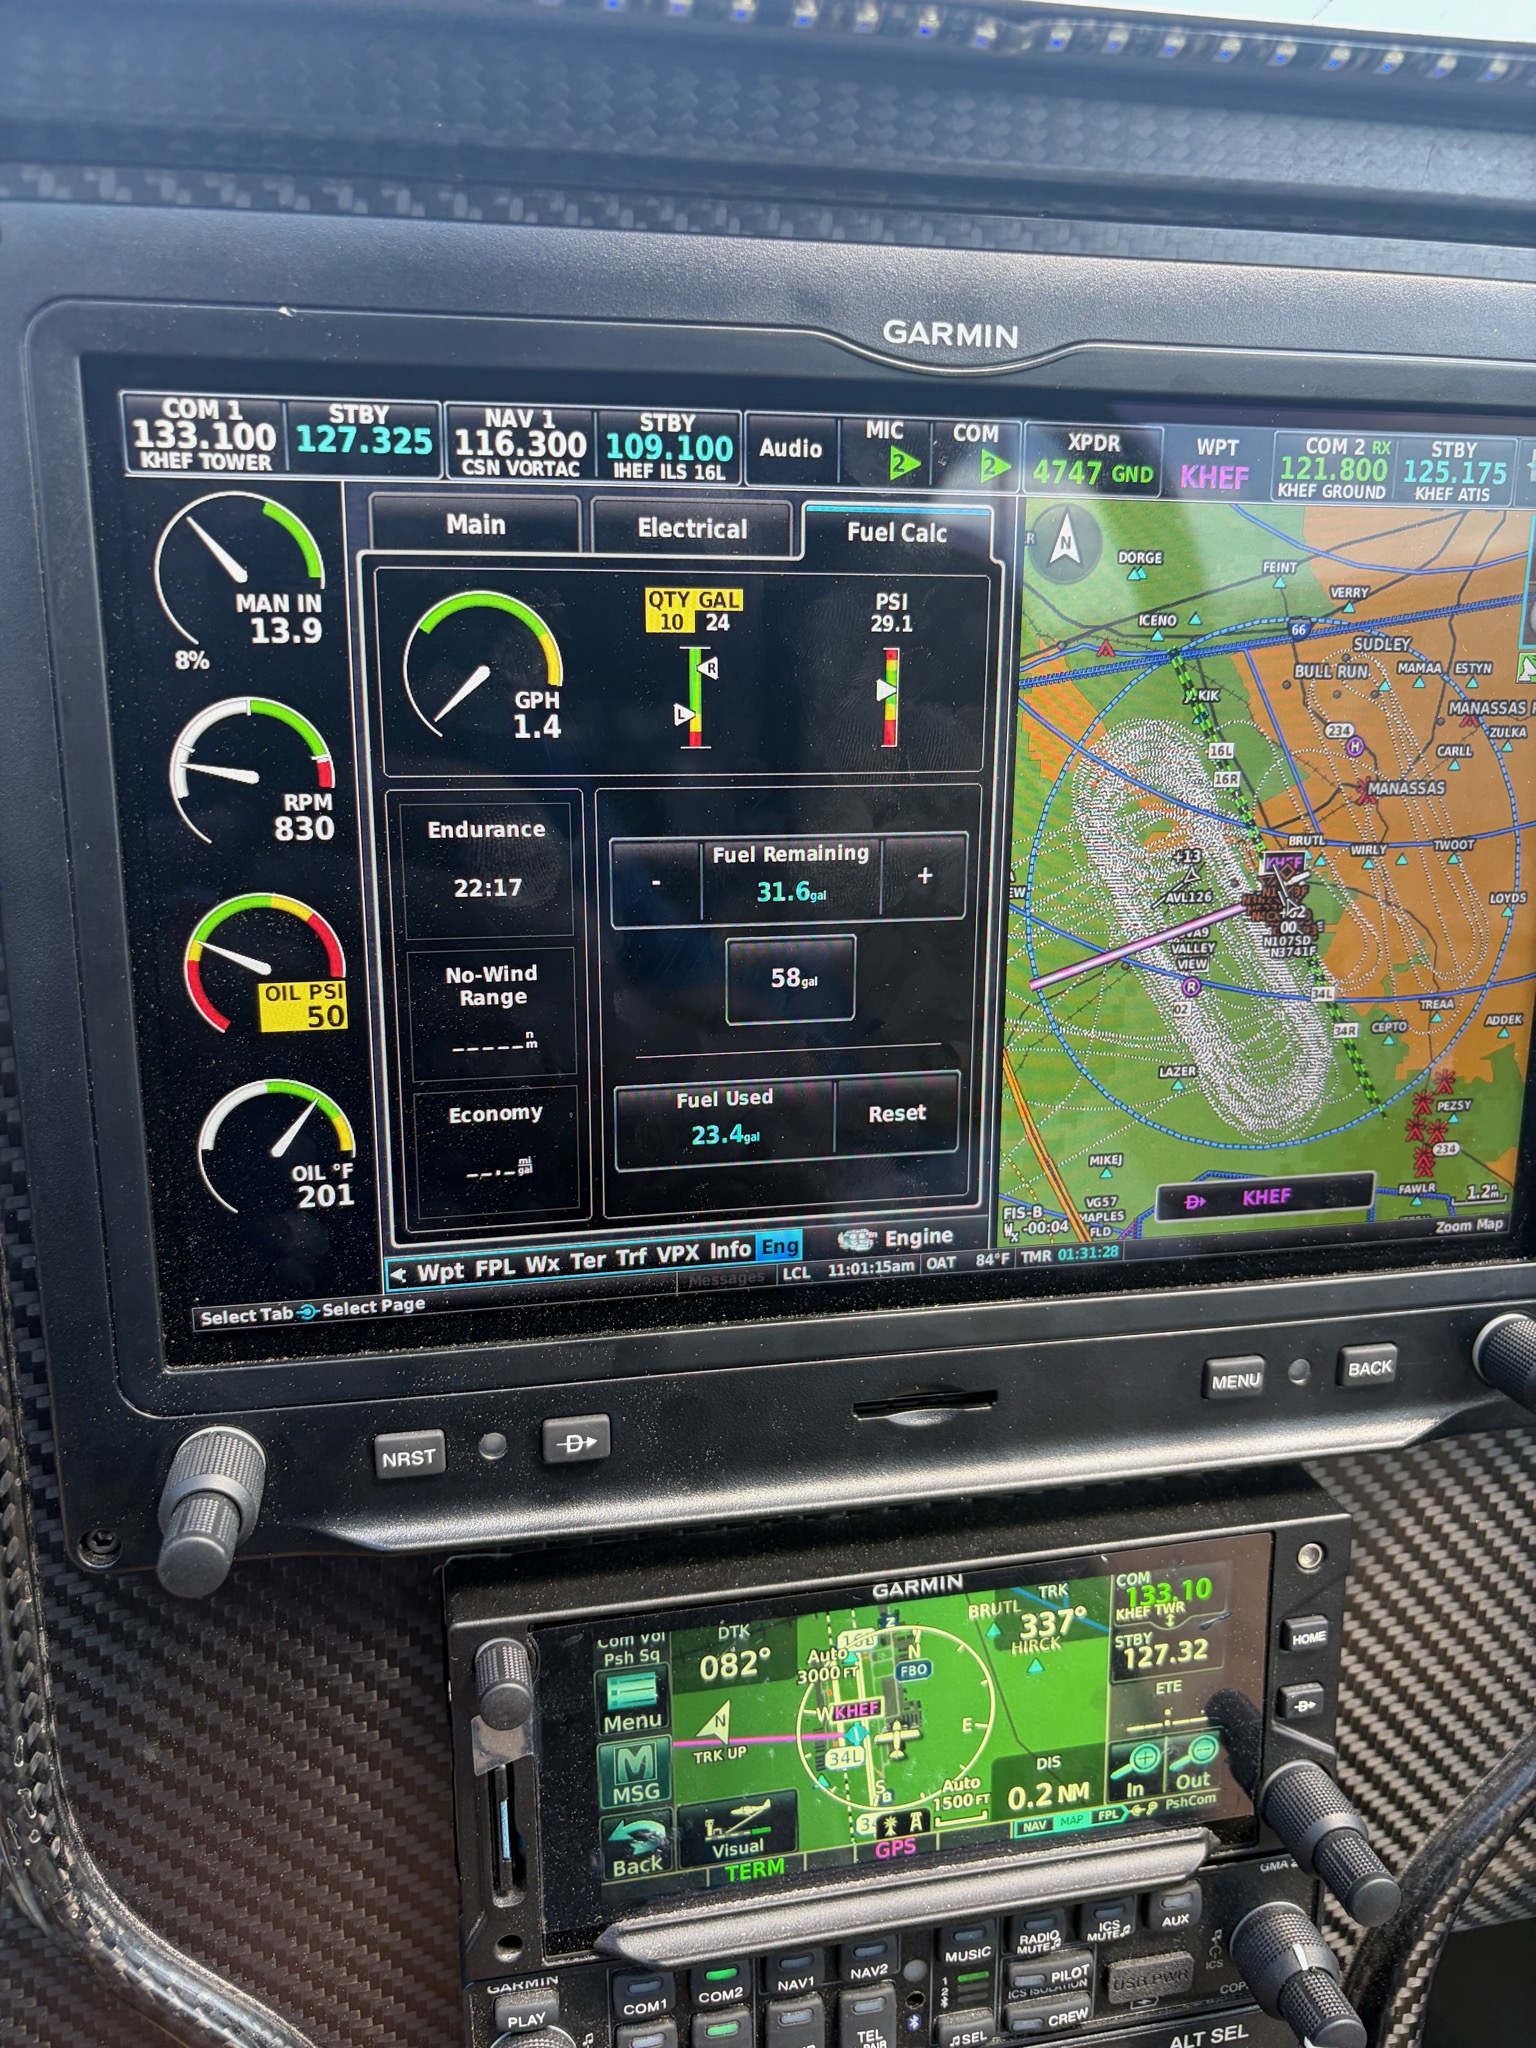
Two panel photos from the ramp after the flight — documentation of the final engine state, not in-flight readings:
G3X engine page after shutdown — the sortie’s fuel used and economy at a glanceG3X engine temperature page after shutdown — all six CHTs and EGTs, cooled down
Bottom Line
A clean set of cruise numbers (12+ nm/gal on the table), a tight ~0.6 gph GAMI spread that says the injectors are well-matched, cooling with margin to spare, and a verified-healthy attitude system. A productive morning’s worth of test cards. Next: the rest of the systems and performance cards.
If you’ve been following along since the early flights, you know this airplane has had a recurring character in its story: the tumbling artificial horizon. ATTITUDE and HEADING MISCOMPARE annunciations, deviation numbers pegged at their limits, an attitude display that would occasionally roll over and play dead during the takeoff roll or hard maneuvering. This is the post where that story gets its arc — how we isolated the problem with flight data, convinced Garmin to overhaul one attitude unit, proved the fix, and then used the same data to convince them about the second unit.
The Setup
N997CZ carries three independent attitude sources: two Garmin GSU 25C ADAHRS units (AHRS #1 and #2) behind the panel, and a G5 electronic standby. Three opinions about which way is up, continuously cross-compared — when they disagree, the system annunciates a miscompare and the pilot gets to wonder which box to believe.
From the first flights, the disagreements clustered in the high-vibration, high-acceleration regimes: the takeoff roll above all, plus stalls and slow flight. Two suspects emerged early: vibration (the prop was genuinely out of balance), and the attitude units themselves.
Fix One: Balance the Prop
The dynamic prop balance took vibration from 0.57 IPS down to 0.01 — a 50-fold reduction — and it helped every attitude source. Looking only at the big deviation excursions (reported deviation above 200%, takeoff roll through touchdown), all three sources improved markedly after the balance.
But it didn’t eliminate the problem. The large excursions kept coming, and they kept coming disproportionately from one box.
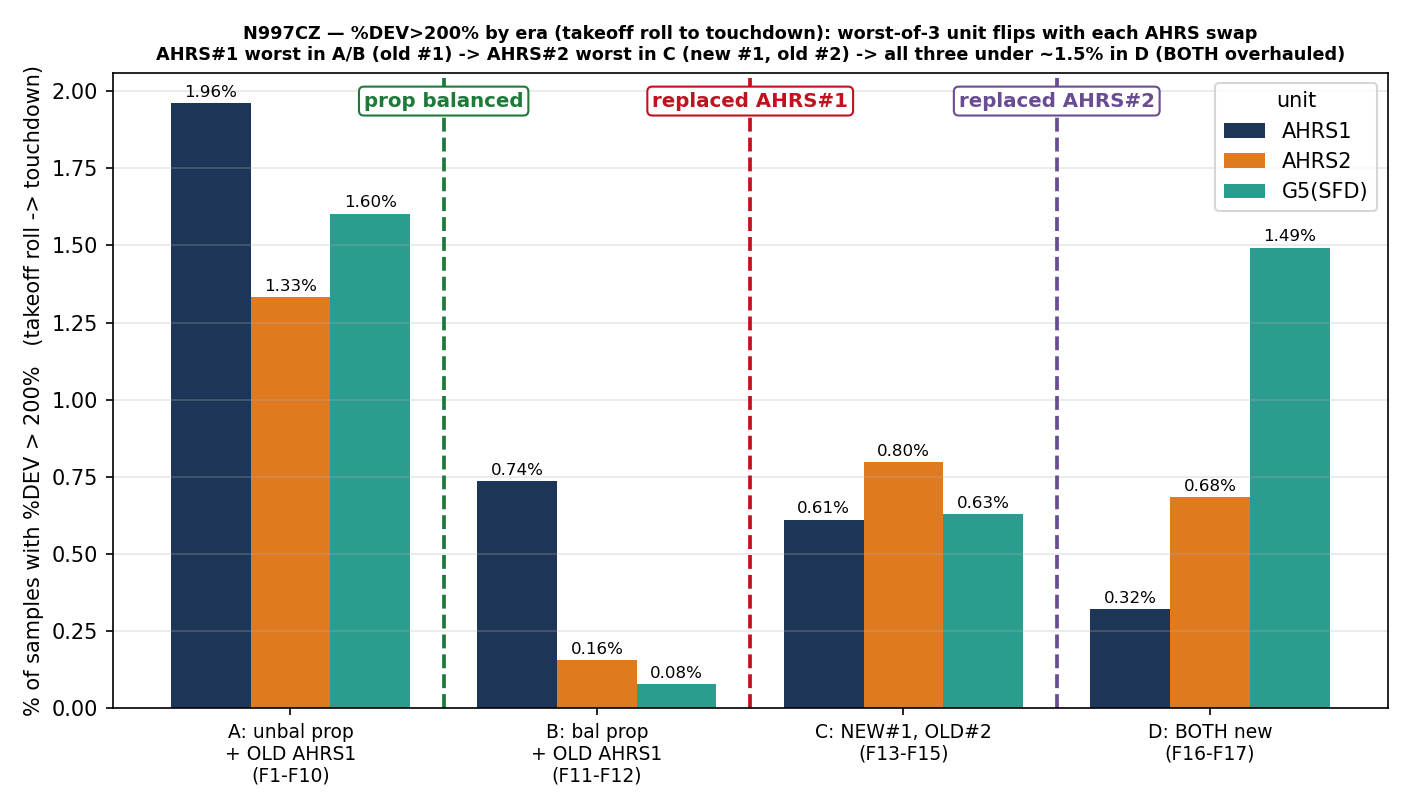
ADAHRS deviation by era — the worst unit flips from AHRS #1 to AHRS #2 at the swap
That’s the chart that tells the whole story, so let’s read it. Each group is an era: (A) original prop, original AHRS #1; (B) balanced prop, original AHRS #1; (C) balanced prop, new AHRS #1 with original #2; (D) both units overhauled — but we’re getting ahead of the story. The prop balance (A→B) drops everyone. But within every era, somebody is the outlier — and in eras A and B, it’s AHRS #1. Not just on average: AHRS #1 was the highest-deviation source on every single flight from 5 through 12. On Flight 12 it saved its best for last — in-flight re-aligns totaling almost two minutes, and a cross-source roll disagreement of roughly 136°.
Fix Two: Replace AHRS #1
Garmin agreed to overhaul AHRS #1, and the replacement unit went into the panel on June 6 — the same day as Flight 12’s fireworks. The before/after is about as clean as flight test data gets:
In-flight re-align events (“AHRS1 ALIGN”): 350 seconds total across Flights 5–12 → zero on Flights 13, 14, and 15.
Maximum cross-source roll disagreement: ~136° → under 10°.
Extreme deviation excursions (>500%): eliminated.
Attitude-horizon tumbles: Flight 13 was the first flight in the airplane’s life without one, and there hasn’t been one since.
Case closed on AHRS #1. Which is exactly what made the remaining data interesting.
The Plot Twist: The Baton Pass
Look at era C in the chart above. With the new AHRS #1 installed, the outlier didn’t disappear — it moved. AHRS #2, the original, never-serviced sister unit, became the highest-deviation source on every flight 13 through 15. The worst-of-three title passed from #1 to #2 on the exact flight the new unit went in.
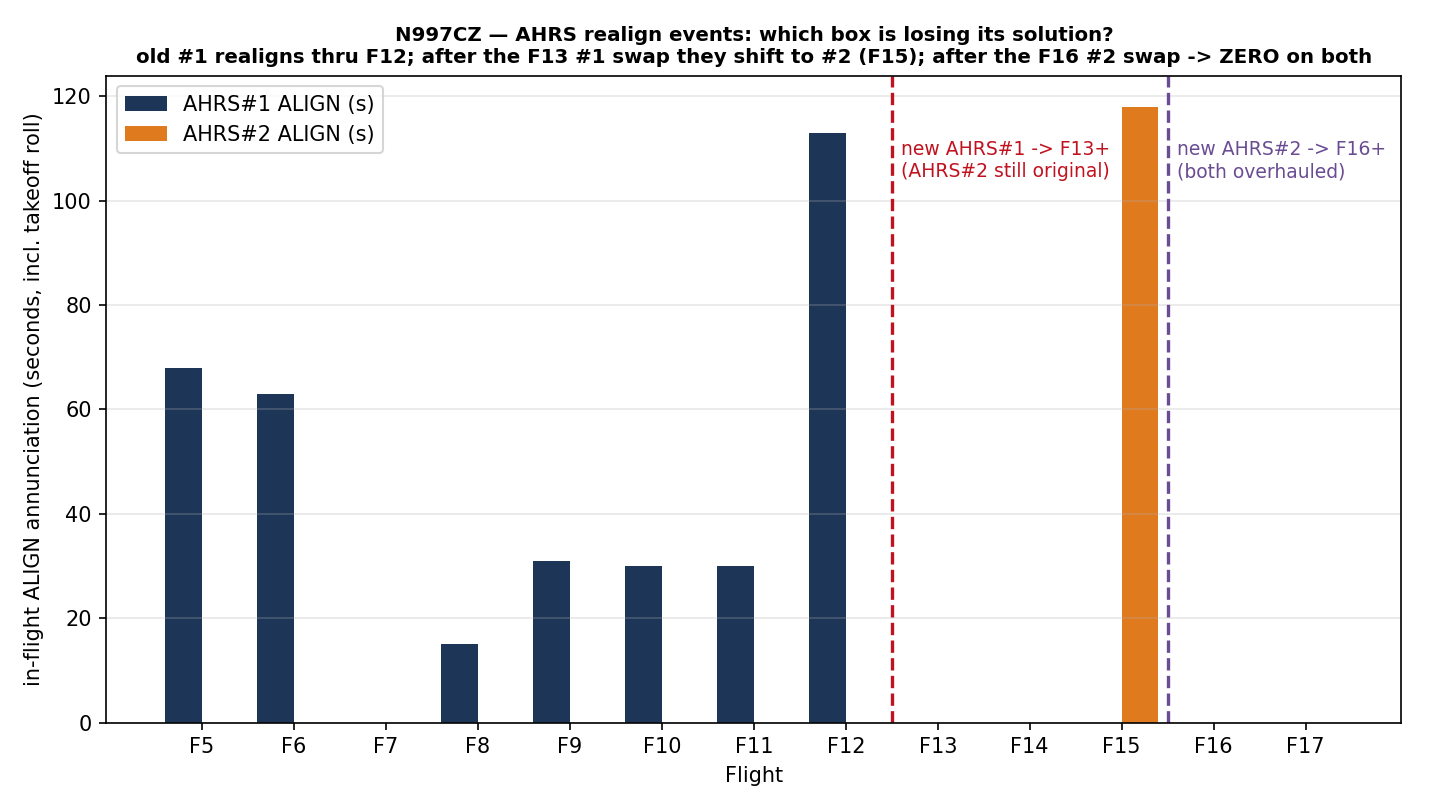
In-flight ADAHRS re-align events per flight — after the swap, the re-aligns shift to AHRS #2
Then Flight 15 produced the smoking gun. AHRS #2 — which had never logged an in-flight re-align in the airplane’s entire history — dropped its attitude solution and re-aligned for a cumulative 118 seconds, with the system annunciating “USING AHRS1” while the brand-new #1 carried the load. The roles from Flight 12 had exactly reversed.
Better still, from a diagnostic standpoint: the failure is reproducible on demand. It triggers in high angle-of-attack, full-power slow climbs — on Flight 15 it recurred in roughly eight separate events inside a single 30-minute window of climb-performance testing, all at a median of about 89 knots, nose up, full power. A fault you can demonstrate on command is a fault nobody has to take your word for.
Convincing Garmin, Round Two
All of the above went into a short data report to Garmin — the era comparison, the re-align timeline, the reproducibility recipe — with a simple argument: AHRS #2 now exhibits the same in-flight signature AHRS #1 exhibited before its overhaul fixed it; we respectfully request the same service. The analysis we sent Garmin — since updated with the post-replacement verification data — is here, for anyone fighting a similar battle: N997CZ GSU 25C ADAHRS Deviation Analysis (PDF).
Garmin agreed. The replacement AHRS #2 is in hand.
Fix Three: Replace AHRS #2 — and the Verification
Garmin’s overhauled AHRS #2 went into the panel after Flight 15. *Flights 16 and 17 (June 13) are the first this airplane has ever flown with both attitude units overhauled* — the verification flights I’d been waiting to write about.
The data did for #2 exactly what it did for #1. Measuring only the part of each flight that counts — from the start of the takeoff roll through touchdown, with the power-on/alignment window excluded — here is the before-and-after:
ATTITUDE / HEADING MISCOMPARE annunciation time: Flight 15 logged 346 seconds of attitude miscompare and 209 seconds of heading miscompare. Flights 16 and 17 each logged zero of both. These are the very annunciations that had survived the AHRS #1 overhaul — because #2 was still arguing — and they’re simply gone now.
AHRS #2 in-flight re-aligns: 118 seconds on Flight 15 → zero on Flights 16 and 17, with no “USING AHRS1” reversion. AHRS #1 stays at zero too. Both boxes now hold their solution from brake release to rollout.
Maximum cross-source roll disagreement: 0.8° on Flight 16, 3.0° on Flight 17 — against the ~136° this airplane once produced on Flight 12. No deviation tumbles on either unit.
That’s the whole arc closed. Look back at the re-align chart: the navy bars (AHRS #1) end at Flight 12, the lone orange bar (AHRS #2) stands on Flight 15, and after the second overhaul goes in at Flight 16 — nothing. Three healthy attitude opinions, for the first time in this airplane’s life.
Where It Stands
The two original cores — the unit that started it all (S/N 5Q2001016) and its sister (5Q2002262) — go back to Garmin per their return instructions, and that closes the books. Two RMAs, two overhauled units, and a flight-data trail that called the shot both times before the wrench ever came out.
The villain is retired. Onward to the rest of the Phase 1 card deck.
— with thanks to Garmin support for engaging with the data all the way through.
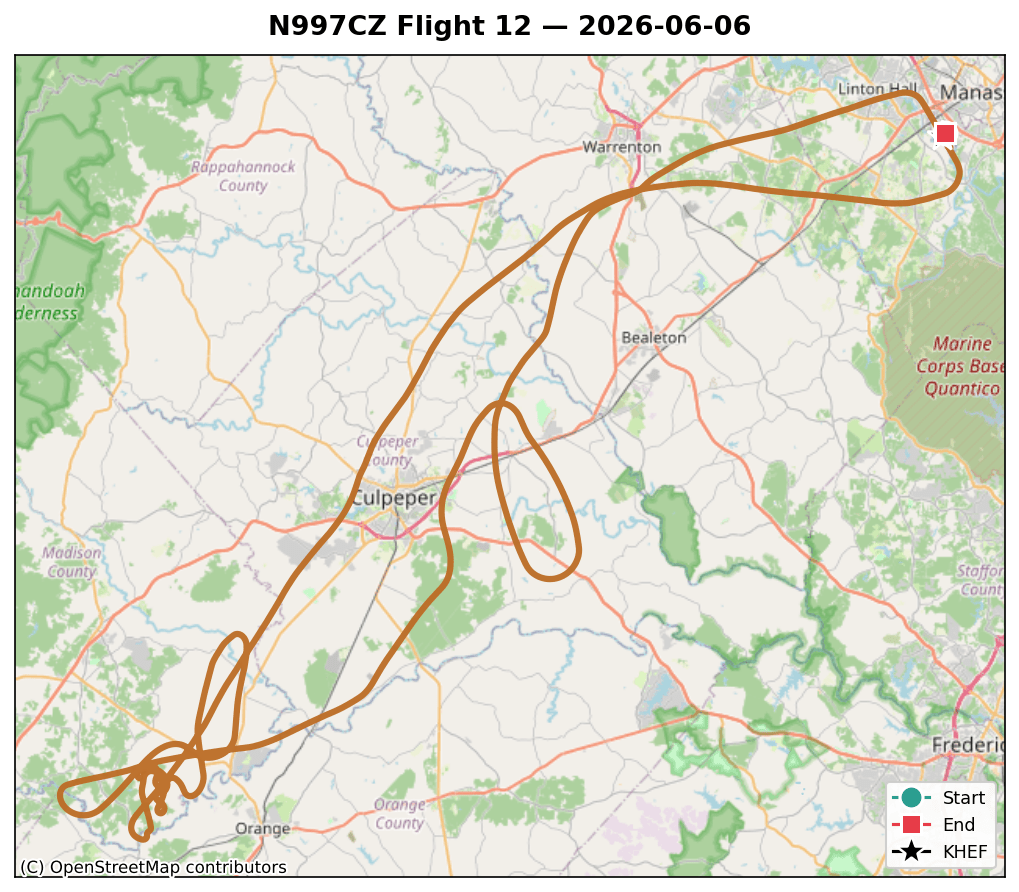
Ground track for Flight 12 over the Phase 1 test area.
Flight 11 was a marathon — two and a half hours of precision circles for the airspeed calibration. Flight 12, six days later, was the opposite kind of flight: shorter, higher, and slower. The plan was to start working through the stability test cards, and the headline act was a slow-flight series flown higher than this airplane had ever been.
The Numbers
Date
2026-06-06
Engine time
~1.5 hr
Distance
156.5 nm (GPS path)
Fuel used
18.5 gal (totalizer)
Engine hours
14.8 → 16.2
Max altitude
~9,090 ft MSL (9,535 ft GPS) — highest of the program (so far)
Cruise OAT
+58 °F (mild morning, ~13 °F warmer than F11)
Autopilot
~94% of airborne time (more on that below)
Config
7 qt oil; burn well under one tank, no tank switch
Climb High, Fly Slow
The idea behind doing slow flight way up high is simple: altitude is recovery margin. If the airplane is going to do something rude at high angle of attack, I’d rather it do it with 9,000 feet underneath me than 3,000.
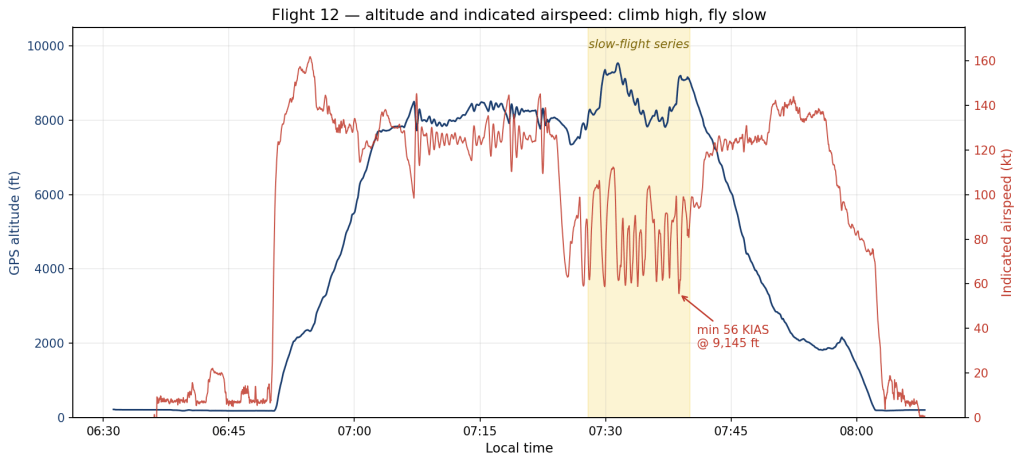
Altitude and indicated airspeed vs time — the shaded block is the slow-flight series at 9,100–9,500 ft.
The profile chart shows the shape of the flight: climb out of Manassas, work in the mid-8,000s, then push up to the program-high 9,090 ft MSL (9,535 ft GPS) and settle into about thirteen minutes of slow-flight work between 9,100 and 9,500 feet. The red trace tells the story — a string of deliberate decelerations, each one walked down slowly, held, and recovered, over and over. The slowest stabilized point was about 56 KIAS at 9,145 feet.
That block wasn’t all straight-ahead slow flight, either. Working down the stability card deck — the FT-12/FT-13 card set is here (PDF) — the points included longitudinal static-stability checks at 55% power (trim the airplane, displace 10 and then 20 knots either side of trim, and watch how it comes back), flaps-up power-off stalls banked both ways at 10°, 20°, and 30° of bank, and a set of power-on stalls at 55% power. The power-on stalls turned out to be the interesting ones — more on that next.
Remember from Flight 11 that the airspeed indicator reads a knot and a half or so low down at these speeds — so true calibrated speed at that 56-knot point was around 58, and true airspeed at that altitude meaningfully higher still. The margins were real, which is the whole point of doing this work upstairs.
The Autopilot Kept Tapping Out
One genuinely interesting system behavior surfaced during the slow-flight series: the G3X autopilot repeatedly dropped offline with a “Fail / Inertial miscompare” annunciation, then re-engaged — about four minutes of dropouts across seventy airborne minutes, and the trigger was specific: the power-on stalls. It wasn’t just the autopilot being cautious, either — the attitude horizon itself tumbled several times during those stalls. In the data, the disagreement between attitude sources reached roughly 136° of roll — the worst cross-source split of the entire program. Outside the high-AoA block the autopilot was rock solid; it flew about 94% of the airborne time.
“Inertial miscompare” doesn’t mean the system knows which attitude source is lying. Per the G3X installation manual, data from the two ADAHRS units is continuously cross-compared and a disagreement is simply annunciated — the system flags the mismatch and lets the pilot sort it out. (Interestingly, the G5 standby only joins the comparison if the system has degraded to a single ADAHRS, so there’s no three-way vote while both primary units are alive.) Figuring out which unit is actually bad happens one level down: each ADAHRS runs its own internal integrity monitoring, and a unit that loses confidence in its own solution drops it and re-aligns — at which point the system switches over to the survivor. Long-time readers will recognize this as the ADAHRS-deviation theme that’s been running since the first five flights — it gets provoked by exactly this kind of high-AoA, low-airspeed maneuvering. The decision coming out of this flight’s debrief: change out AHRS #1 and see what the data says. The replacement unit went into the panel that same day. That story deserves its own post.
Carbon Monoxide: Best Slow-Flight Result Yet
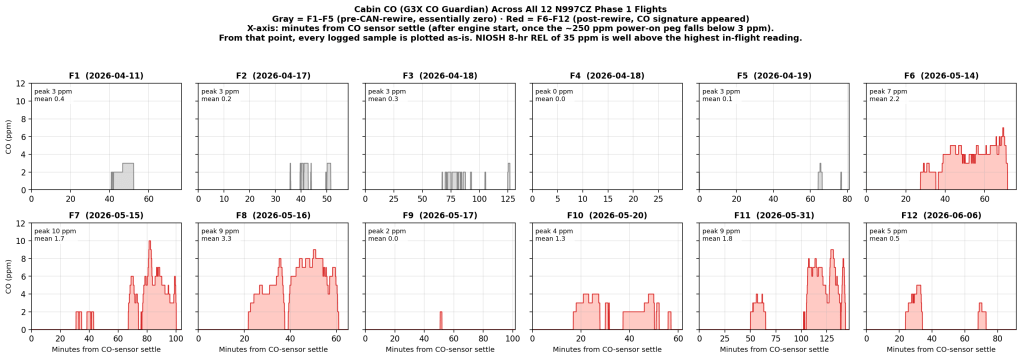
This one is encouraging. Every slow-flight-heavy flight since the CO detector went in has shown cabin CO in the 5–10 ppm range, consistent with the firewall heat-door leak theory. Flight 12 was the most slow-flight-intensive profile yet — and CO stayed benign: peak 5 ppm, mean 0.5.
Cabin CO across all twelve flights — Flight 12 is the cleanest slow-flight result since the detector went in.
Two honest caveats. First, the log shows a scary-looking 250 ppm spike — that’s the CO detector’s power-up warmup transient, recorded in the first ~50 seconds on the ground with the engine off, decaying steadily as the sensor warms. It’s a self-test artifact, not cabin air. (The trend script now auto-discards it.) Second, since I still haven’t flown the deliberate tape-the-heat-doors test, a quiet flight doesn’t tell me the leak is fixed — just that this profile, on this cool morning, didn’t pull much exhaust in. The isolation test stays on the list.
The Cylinder 5 Canary: Holding, Not Climbing
The air-dam saga continues, with a hopeful data point. Recap: before Flight 10 I removed the cooling air dam in front of cylinder 1, which fixed #1’s chronic heat but started costing cylinder 5 in the climb — its temperature-adjusted peak climb CHT marched 401 → 410 → 427 °F across Flights 9–11.
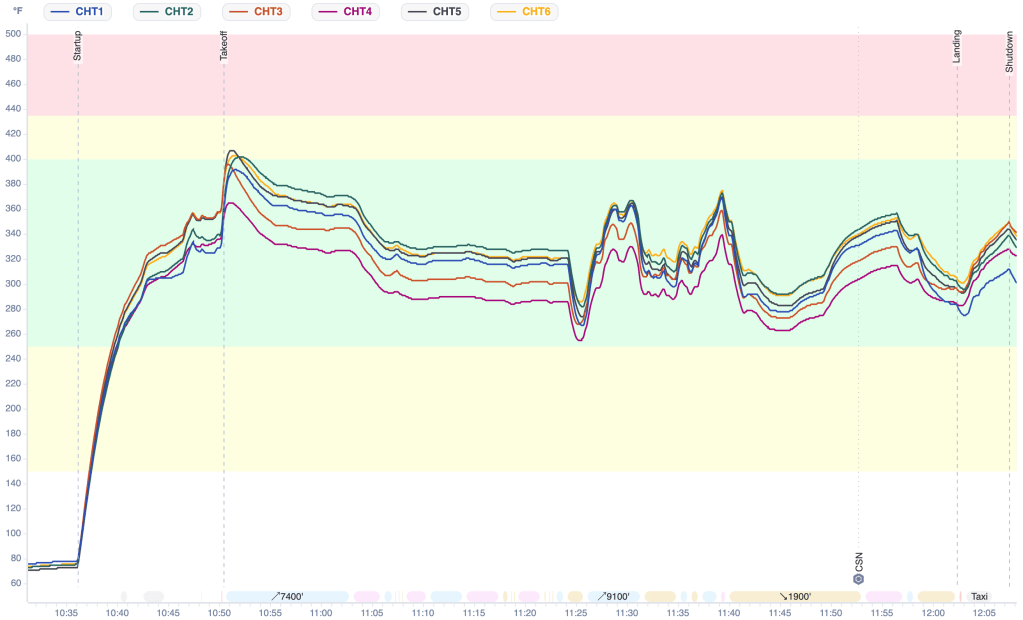
FlySto’s CHT chart for Flight 12 — all six cylinders (raw temps) with the comfort bands painted behind them.
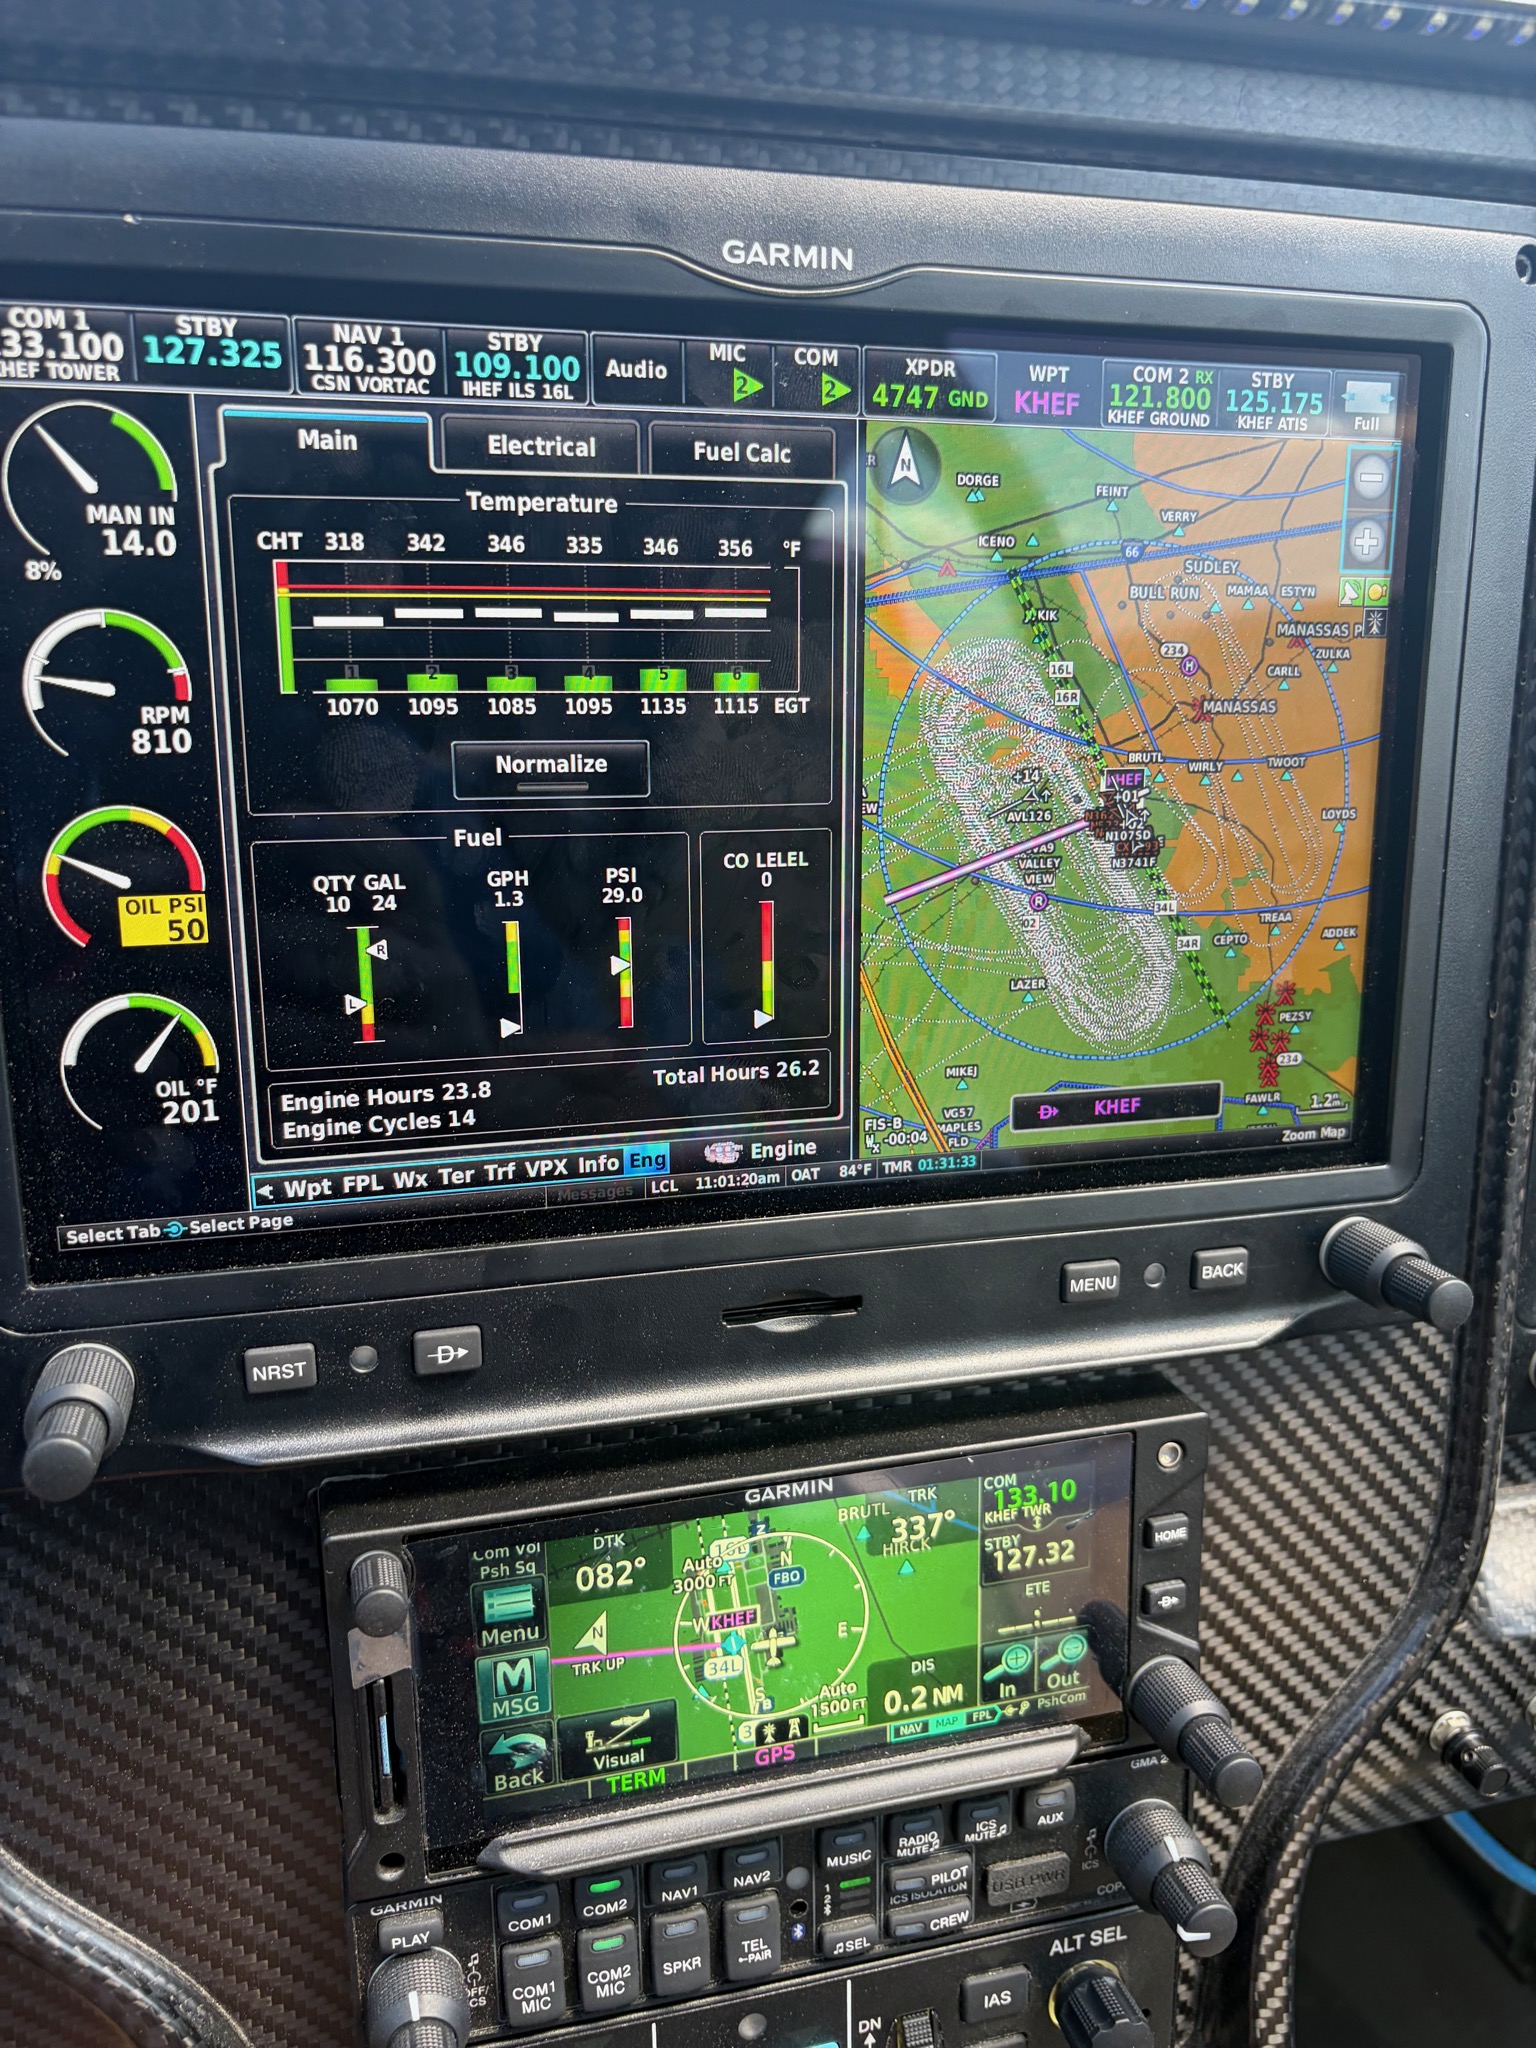
Here’s the whole flight at a glance, as FlySto renders it from the G3X log — all six cylinders, raw temperatures, with the comfort bands painted behind them. The climb-out spike just after takeoff is the hot moment of the flight, topping out around 407 °F, and everything spends the rest of the sortie comfortably in the green. You can even see the slow-flight series as that choppy stretch in the middle, and the brief dip to ~260 °F right before it — the power-off deceleration entries.
Flight 12: 408 °F. Still the hottest cylinder in the climb, but it fell back to roughly the Flight-10 level instead of continuing to rise — helped, no doubt, by climbing into cooler air up high. Meanwhile cylinder 1 keeps enjoying its freedom: coolest jug on the engine, with cruise temperatures (OAT-adjusted) down around 327 °F. Cruise CHTs across the board were the lowest of the program — the reward for flying high in cool air. Verdict: the canary is alive but still in the mine. Watching.
Fuel: The Totalizer Earns Its Keep Again
A small satisfying footnote. The totalizer said the flight burned 18.5 gallons; the fuel truck that topped the airplane off twenty minutes after shutdown delivered 18.30 gallons. That’s agreement to 0.2 gal, and it keeps the program-long truck-versus-totalizer reconciliation within a fraction of a gallon. The fuel-flow system has earned trust the fuel-quantity gauges haven’t (the right float is still stuck — see squawks).
Cruise mixture ran richer than Flight 11 — about 15.5 gph against 14.5 — mostly because I spent the flight flying maneuvers instead of babysitting the red lever.
Squawks
Flap position sensor broke again — the May 31 workaround (remounting the worn pot to ride the healthy end of its range) didn’t hold, and this time the failure ran the other way: it wouldn’t let the flaps come up. On Flight 11 the same sensor had refused to put them down, forcing a no-flap landing. Two flights, two opposite refusals — enough. The fix chosen: reconfigure the VP-X so the flap switch works as momentary — hold the switch and the flaps drive up or down, no listening to the position sensor at all. (Since completed, with Dan’s laptop hooked to the VP-X.) The replacement for the 20-year-old Ray Allen pot stays on the parts list.
VP-X pitch and roll trim speeds need to come down — trim runs too fast.
AHRS attitude tumble / inertial miscompare under the power-on stalls — see above; next step chosen: swap AHRS #1.
Right fuel-quantity float still stuck (known item; totalizer is the authority).
Heat-door CO isolation test still not flown — benign CO this flight is encouraging but inconclusive.
And two items came off the list before this flight, in a Friday repair session: the upside-down left magneto switch from the Flight 11 squawks, and the remaining flap close-out work.
Bottom Line
Flight 12 took the airplane higher than it had ever been and slower than it usually flies, in the same thirteen minutes. The slow-flight handling was honest, the CO behaved, the cylinder 5 canary stopped climbing, and the totalizer matched the fuel truck to a couple tenths. The one system that complained — the autopilot’s inertial miscompare under high AoA — is the same attitude-source thread this airplane has been tugging since flight one, and it was about to get a lot more attention.
If you’ve been following the N997CZ build journal, you know the first five flights have been a mix of exhilarating milestones and humbling detective work. Flight 1 was a dream. Flight 2 sent me home early with erratic oil temperature gauges. Flight 3 gave me two solid hours and flaps for the first time. Flight 4 found an alternator belt slipping. But threaded through all of them was something I kept noticing and not fully understanding: in every single flight, the PFD #1 artificial horizon has tumbled upside down at least once.
That’s not a nuisance — that’s a serious ADAHRS event. Once I started pulling the deviation data from all five flights and laying them side by side, the pattern became impossible to ignore. I posted the data to the Van’s Air Force build thread and the community response was immediate, deep, and directly useful. This post is about what the data shows, what the community has experienced, what Garmin tech support confirmed, and my current working theory: this is primarily a vibration problem — with CAN bus wiring issues thrown in as a secondary layer.
What Does “ADAHRS % Deviation” Actually Mean?
N997CZ actually carries three ADAHRS units, all integrated into the G3X system. The G3X Pilot’s Guide confirms that the G3X supports up to three ADAHRS sources, with the G5 functioning as a full participant in the cross-comparison and miscompare monitoring via CAN bus — not a standalone backup, but a third integrated ADAHRS. The G3X uses two GSU 25C units — ADAHRS #1 and ADAHRS #2 — plus the Garmin G5, all cross-checked against each other. Both GSU 25Cs are mounted on the sub-panel directly forward of PFD #1. The G5 sits in a separate location, which makes its deviation data a valuable third data point — if its profile looks different from the GSU 25s, it helps localize where the disturbance is worst. That data is being pulled and will be added in a follow-up.
Before diving into the charts, an honest caveat: Garmin has not publicly disclosed what % deviation actually measures internally. We asked. They didn’t specify. So everything below is interpreted with that uncertainty in mind. It could be a cross-check residual between the two GSU 25 units, or something internal to each unit — perhaps related to Kalman filter covariance, or how much raw IMU data agrees with the filter’s predicted state. Without Garmin’s definition, we can’t be certain.
Working assumption: % deviation is a proxy for disturbance severity — higher is worse, sustained high values indicate a real problem. Garmin tech support declined to specify what maximum acceptable values should be. The 999% hard pegs have not been confirmed as caused by CAN bus dropouts specifically. Garmin’s guidance: fix the CAN bus first, then re-evaluate what remains.
Hypothesis on the 999% spikes: These hard pegs likely occur during takeoff as RPM sweeps upward from idle. The rising forcing frequency sweeps through the natural resonant frequency of the ADAHRS mount — where vibration transmission into the sensor peaks. Once RPM stabilizes at cruise, the deviation drops to an elevated-but-lower baseline. This is consistent with classic mass-spring-damper resonance behavior and with community reports of problems being RPM- and power-setting-dependent.
Several things can drive this, in rough order of likelihood for a new RV-10: an unbalanced or un-clocked prop; GSU 25 mount resonance amplifying vibration at one sensor location; loose lower cowl hinge pins transmitting vibration into the firewall; and CAN bus dropouts causing the cross-check math to fail and peg at 999%.
Five Flights of Data
Blue = ADAHRS #1 | Teal/green = ADAHRS #2. A flat, quiet trace near zero is healthy. What you’ll see instead is large % deviation in both sensors from takeoff to touchdown across all five flights — sustained throughout every flight, not isolated spikes.
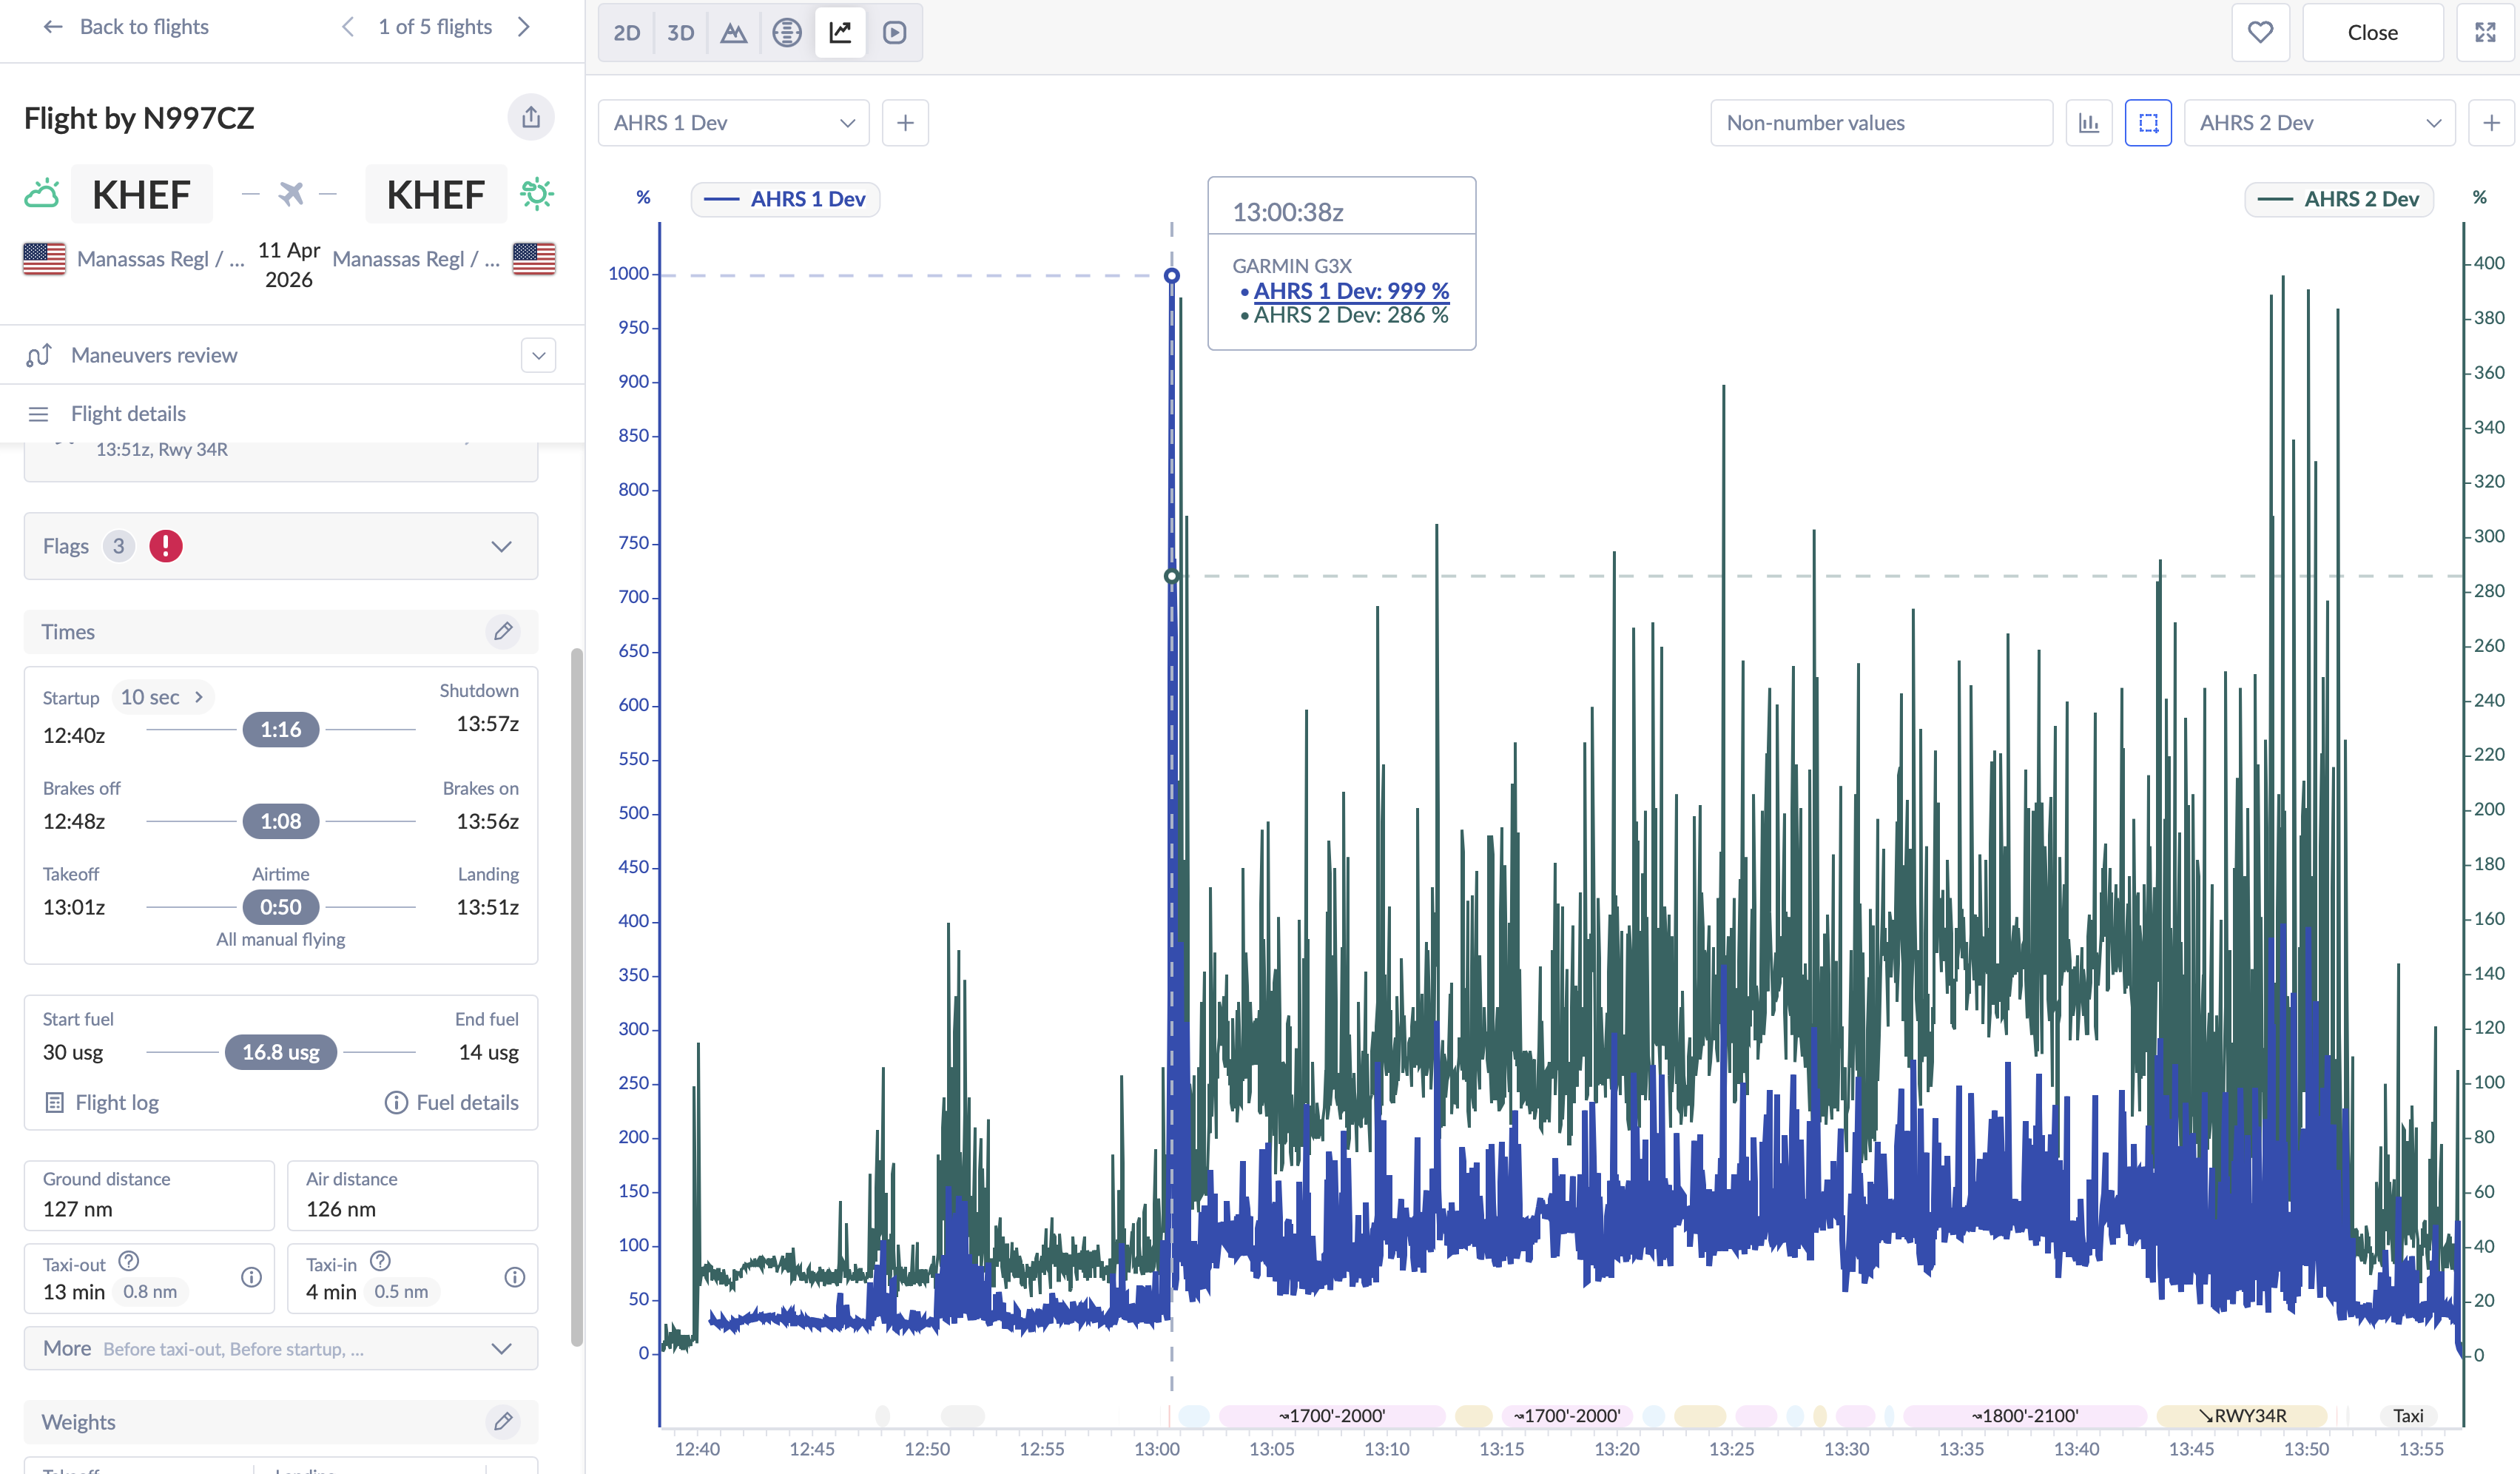
Flight 1 — April 11, 2026 (First Flight, 127 nm)
Flight 1: Large deviation in both units throughout. ADAHRS #2 (teal) consistently worse than #1 (blue), with a hard 999% peak at 13:00:38.
The very first flight and already there’s a clear problem. Both sensors show elevated deviation from shortly after takeoff through landing. ADAHRS #2 is consistently worse than #1, with a hard 999% peak around 13:00:38. The sustained asymmetry between the two units throughout the flight points to a physical difference in what each sensor location is experiencing. The horizon tumbled on this flight — PFD #1 only.
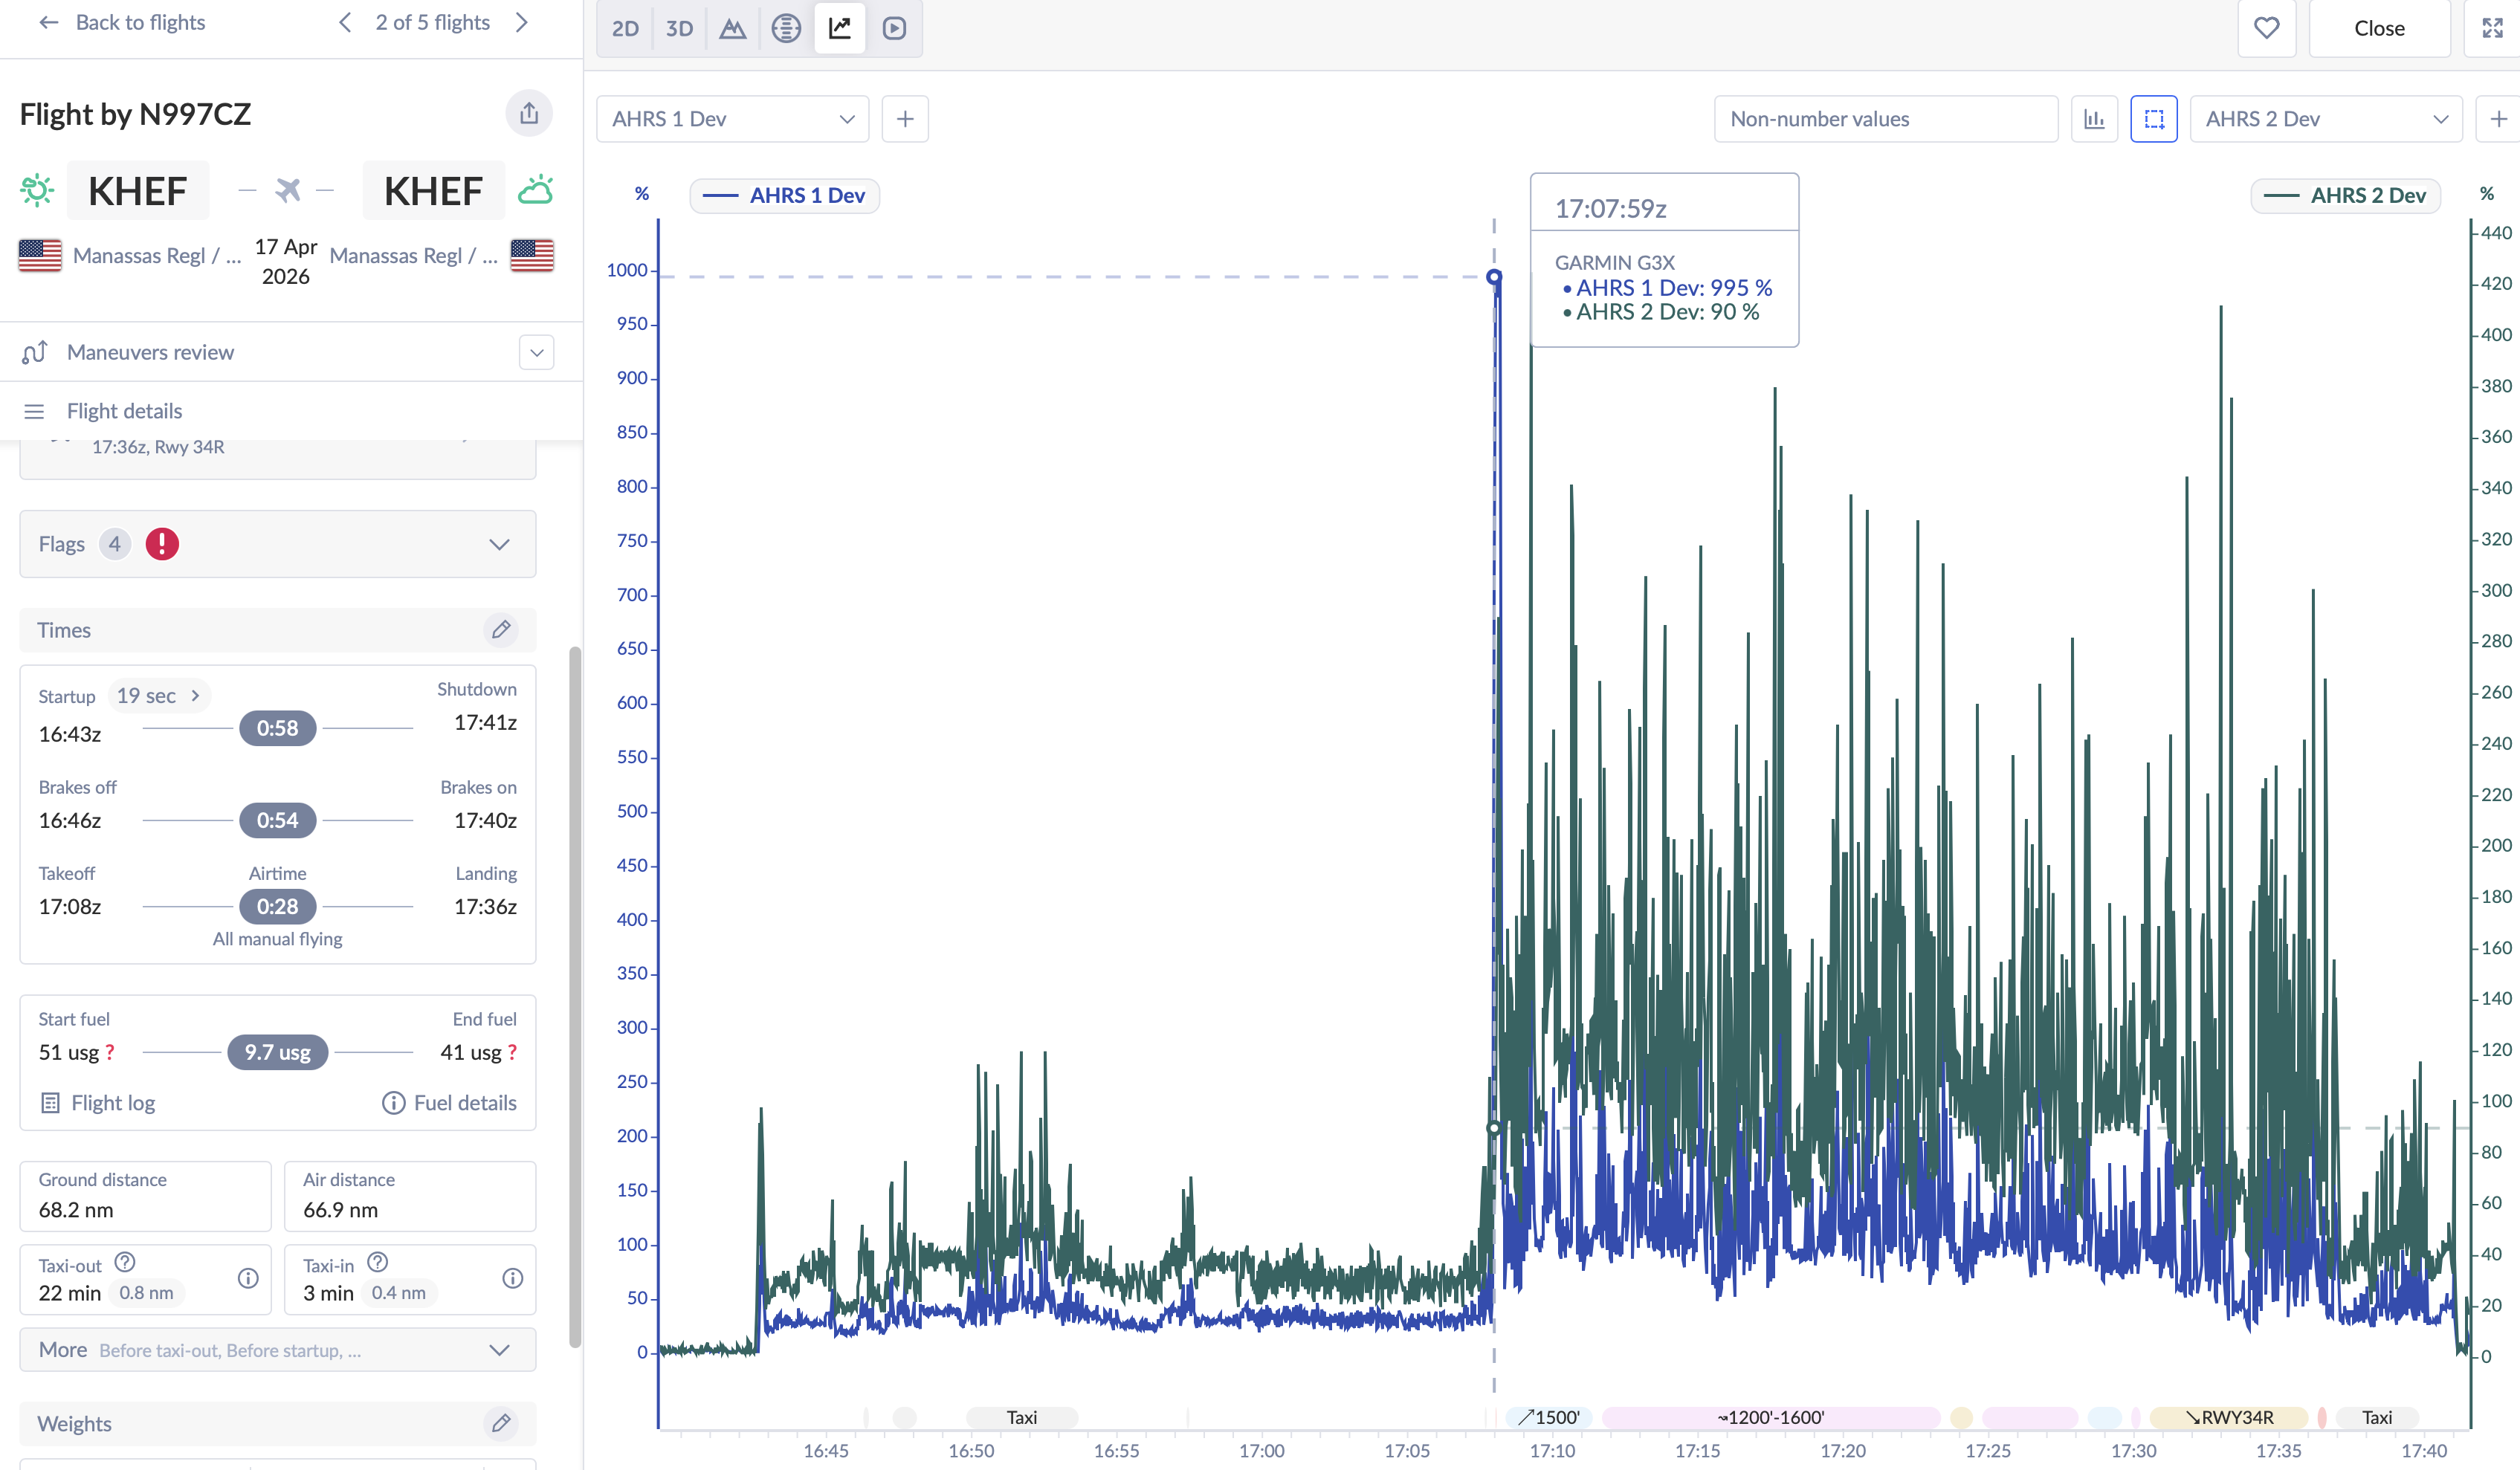
Flight 2 — April 17, 2026 (Abbreviated, 68 nm)
Flight 2: Same sustained pattern. ADAHRS #2 consistently higher than #1, with another 999% peak at 17:07:09.
Identical story to Flight 1. Large deviation in both sensors from takeoff to landing, #2 running consistently worse than #1. The repeatability across two flights makes it clear: this is not random noise. The horizon tumbled again.
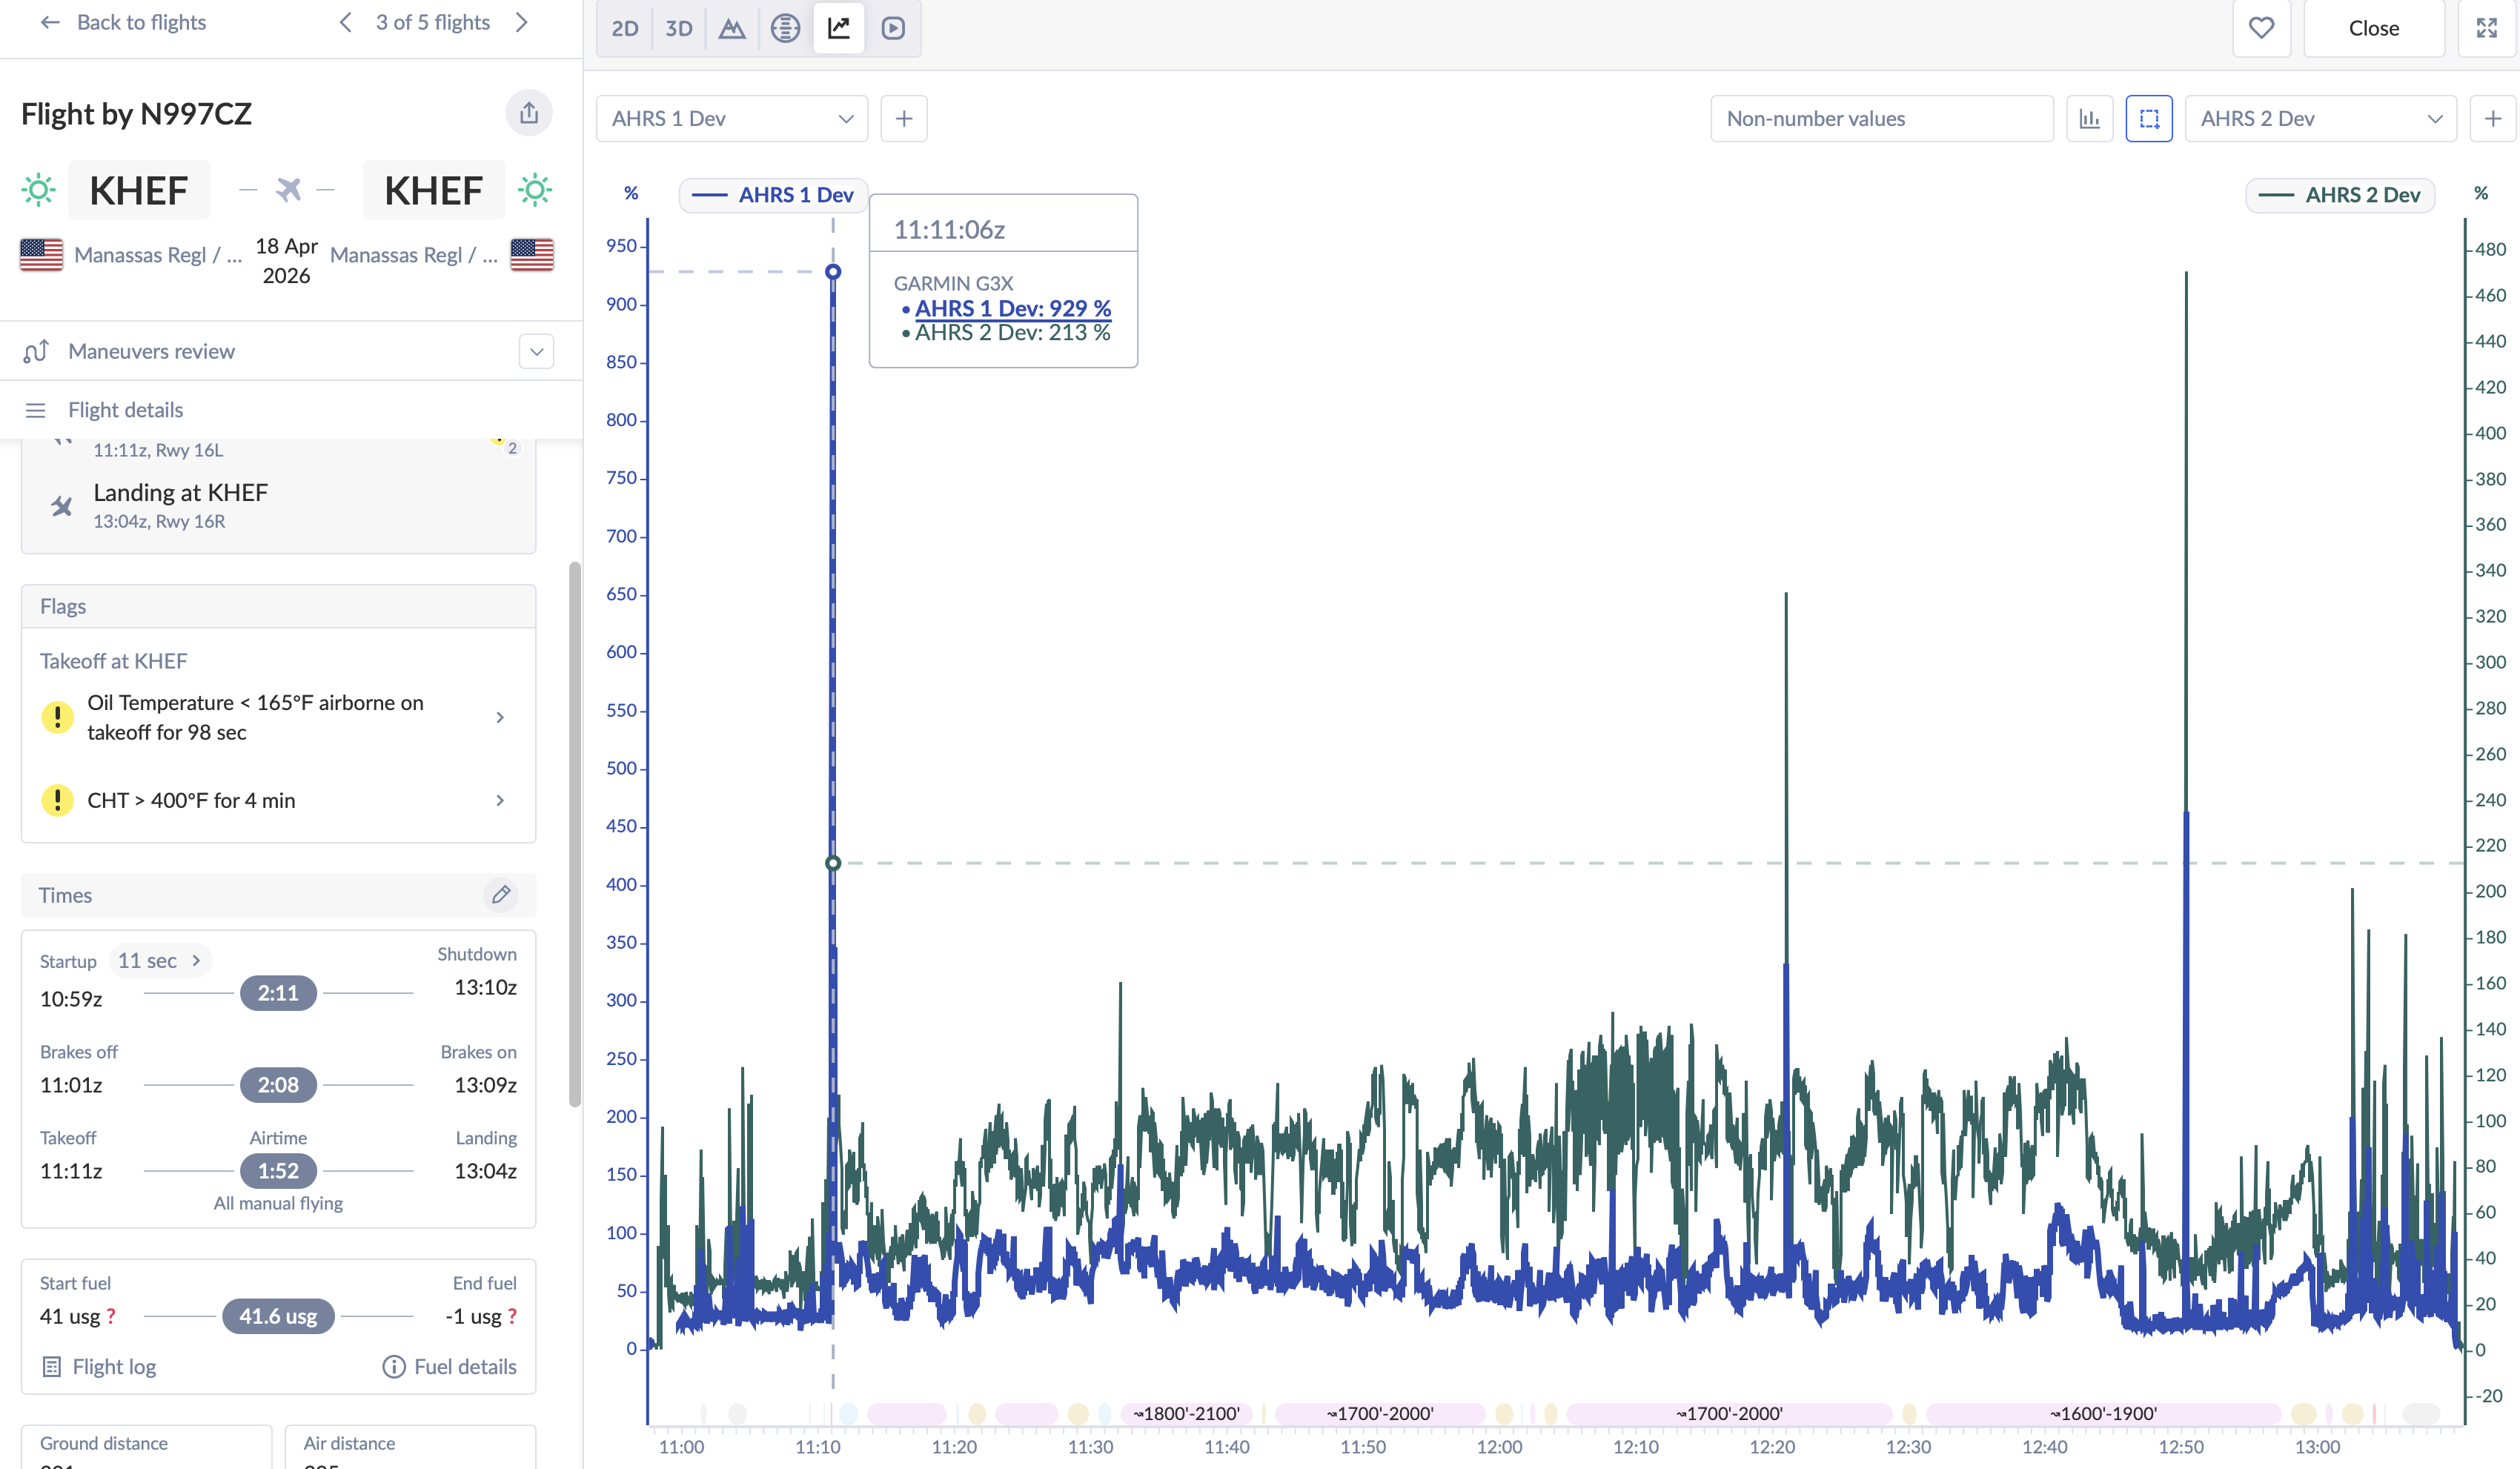
Flight 3 — April 18, 2026 (Two Hours West, Flaps First Time)
Flight 3: Both units elevated throughout. Notable concurrent peak at 11:13:06 — #1 at 229%, #2 at 233% simultaneously.
The two-hour flight shows the same sustained high deviation. What’s notable is a concurrent peak where both sensors reach similar values (229% and 233%) at the same moment — suggesting the disturbance is either broad enough to affect both locations equally, or the CAN bus dropouts confirmed by Garmin are contributing.
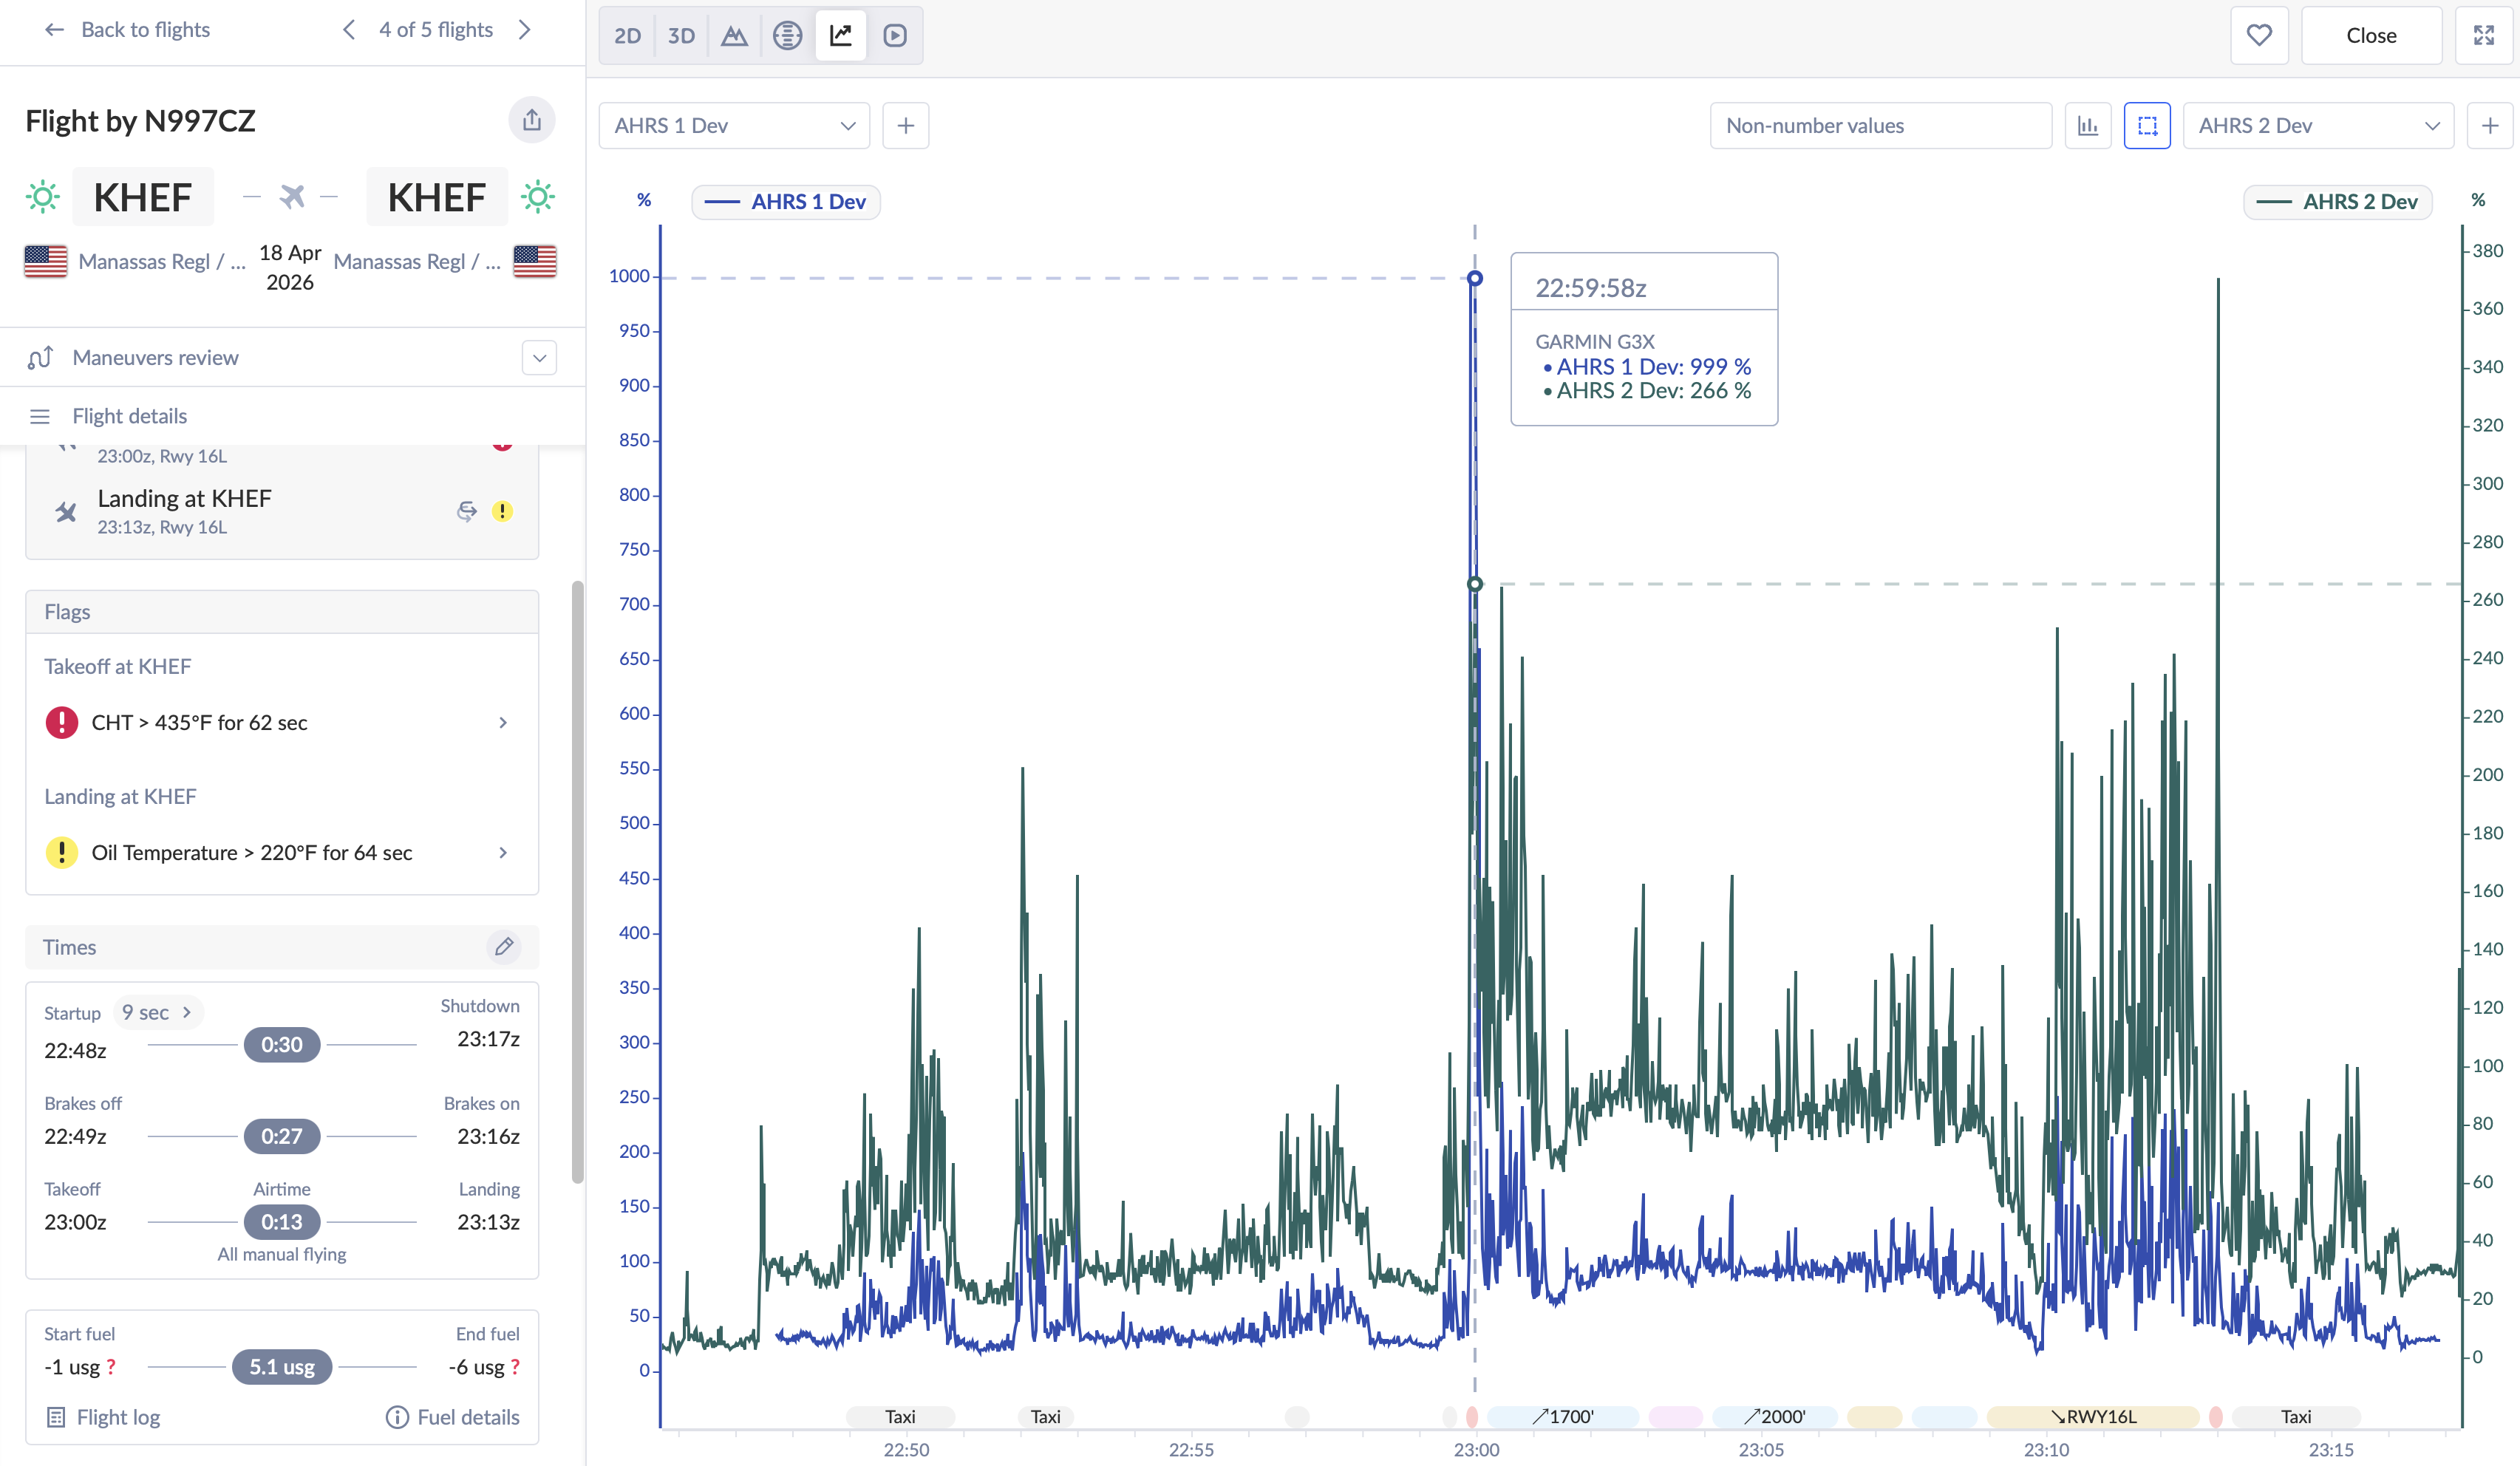
Flight 4 — April 18, 2026 (Alternator Belt Discovery)
Flight 4: Sustained deviation throughout, #2 again significantly worse than #1. Peak: #2 at 999%, #1 at 26% at the same timestamp.
Large deviation in both sensors across the whole flight, #2 running consistently worse again. Flight 4 was when we discovered the alternator belt was slipping, though the ADAHRS deviation pattern is consistent with every other flight.
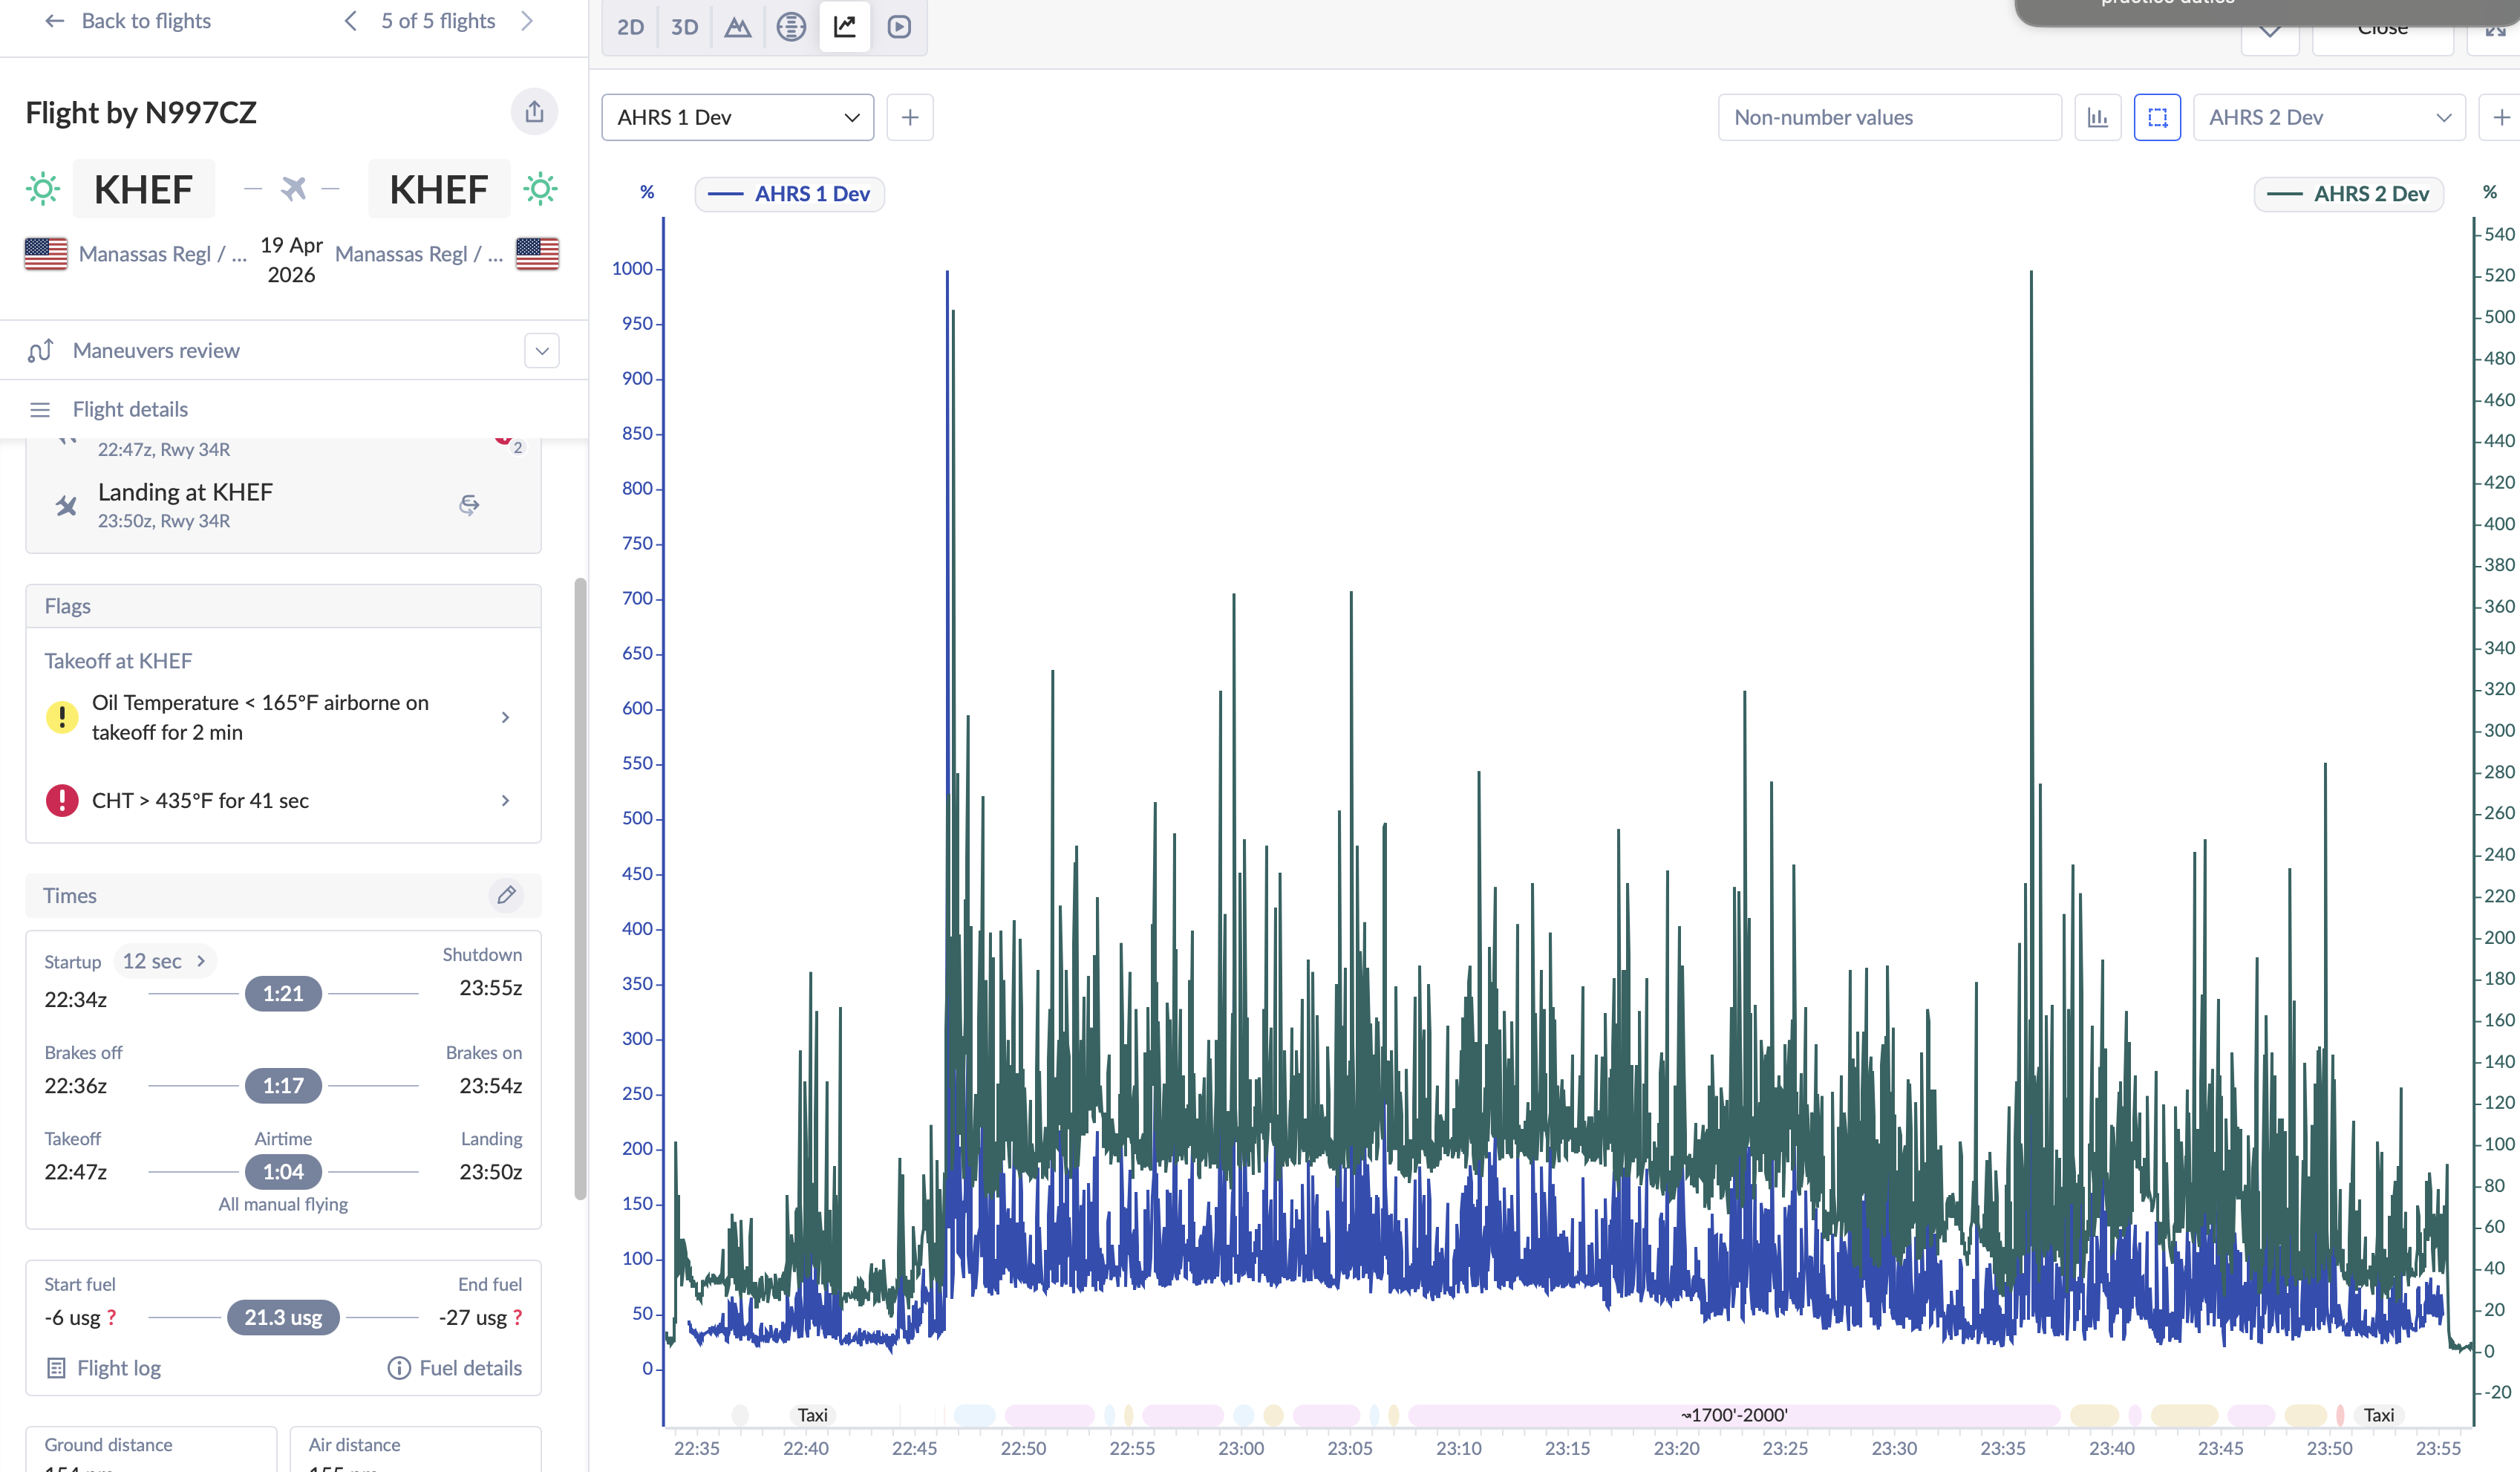
Flight 5 — April 19, 2026
Flight 5: Both units show large, sustained deviation throughout — consistent with every prior flight.
Both sensors show large sustained deviation from takeoff to landing, same as every prior flight. The consistent, high deviation across all five flights is itself the story: this is not a problem that comes and goes — it is present in every flight, start to finish.
Coming next — G5 data: The Garmin G5 is mounted in the main instrument panel, further aft than the two GSU 25Cs on the sub-panel. The sub-panel is tied directly to the firewall via a fore/aft rib, making it a near-direct receiver of engine vibration. The main panel is at the end of a longer structural path with more joints and compliance. If the G5’s deviation runs lower than the GSU 25s — which early recollection suggests — that would directly implicate the sub-panel’s structural coupling to the firewall. That data is being extracted and will be added in a follow-up.
What the Van’s Air Force Community Has Experienced
I posted the data to the N997CZ build thread on VAF and the response was both immediate and sobering: this is a well-known problem, and multiple experienced builders have been down this exact road.
The GSU 25 Mount Location Is the Central Issue
Both GSU 25s are mounted on the sub-panel in the upper-left corner — close to the display, accessible, tidy. But multiple builders reported this location is problematic on the RV-10, and several noted a frustrating catch: Garmin’s ground-based vibration test passes in essentially every position. The only meaningful test is in flight at full power.
The community consensus is that stiffening the sub-panel — adding 0.063 angle stock, doublers, or bracing — doesn’t reliably solve the problem. Making the bracket stiffer just makes it a better conductor of vibration rather than isolating it. Multiple builders who resolved the problem did so by relocating the GSU units entirely: some to the back of the GDU display (despite Garmin’s manual discouraging this), others to a remote aft mount.
The community’s blunt summary: ground vibration tests are a waste of time for diagnosing this. You can’t simulate full power and flight conditions on the ground, and the GSUs will pass the test in any position — then fail in flight. The only data that matters comes from the air.
The Cowling Hinge Pin Fix (An Unexpected One)
One builder shared a fix I wouldn’t have thought to look for: the standard Van’s lower cowl piano hinge vertical pins. Their ADAHRS problem persisted through a sub-panel stiffener and a GSU hardware swap under the Garmin service bulletin. The breakthrough came when someone noticed the lower cowl vertical pins allowed a tiny amount of flex — detectable by hand-pressing the sides of the cowl against the firewall. Replacing those pins with slightly oversized ones resolved the AHRS drift over 30+ hours of subsequent flying.
The diagnostic tell was clean: the ADAHRS ground test passed with the cowl off and failed with the cowl on. N997CZ already uses heavier-than-standard pins, but I’ll be checking the lower vertical pins specifically — it’s a low-cost check worth doing early.
Garmin Service Bulletin SB 2144 — Both My Units Are Affected
Garmin issued SB 2144 specifically addressing GSU 25 units susceptible to “acoustic noise energy” — their language for vibration-induced sensor degradation. The bulletin was traced back to COVID-era supply chain issues that resulted in different MEMS components being used in a production run of units. Both of my GSU 25Cs fall within the affected serial number range.
Some builders had both units replaced under SB 2144 and reported clean results. However, others found the hardware upgrade alone wasn’t sufficient — it took the cowl pin fix or a mount relocation on top of the new units. The SB appears to be a necessary step, but not necessarily sufficient on its own.
Van’s Service Bulletin SB-00028 — Rubber Isolators
Van’s issued SB-00028 (currently RV-12 specific) directing owners to assess ADAHRS performance and, where issues are found, install rubber isolators on the GSU mounts. This directly contradicts Garmin’s guidance to mount to “the stiffest part of the airframe.” The community notes the irony, and the flight experience of multiple builders suggests Van’s got it right.
The Stiff vs. Soft Mount Debate
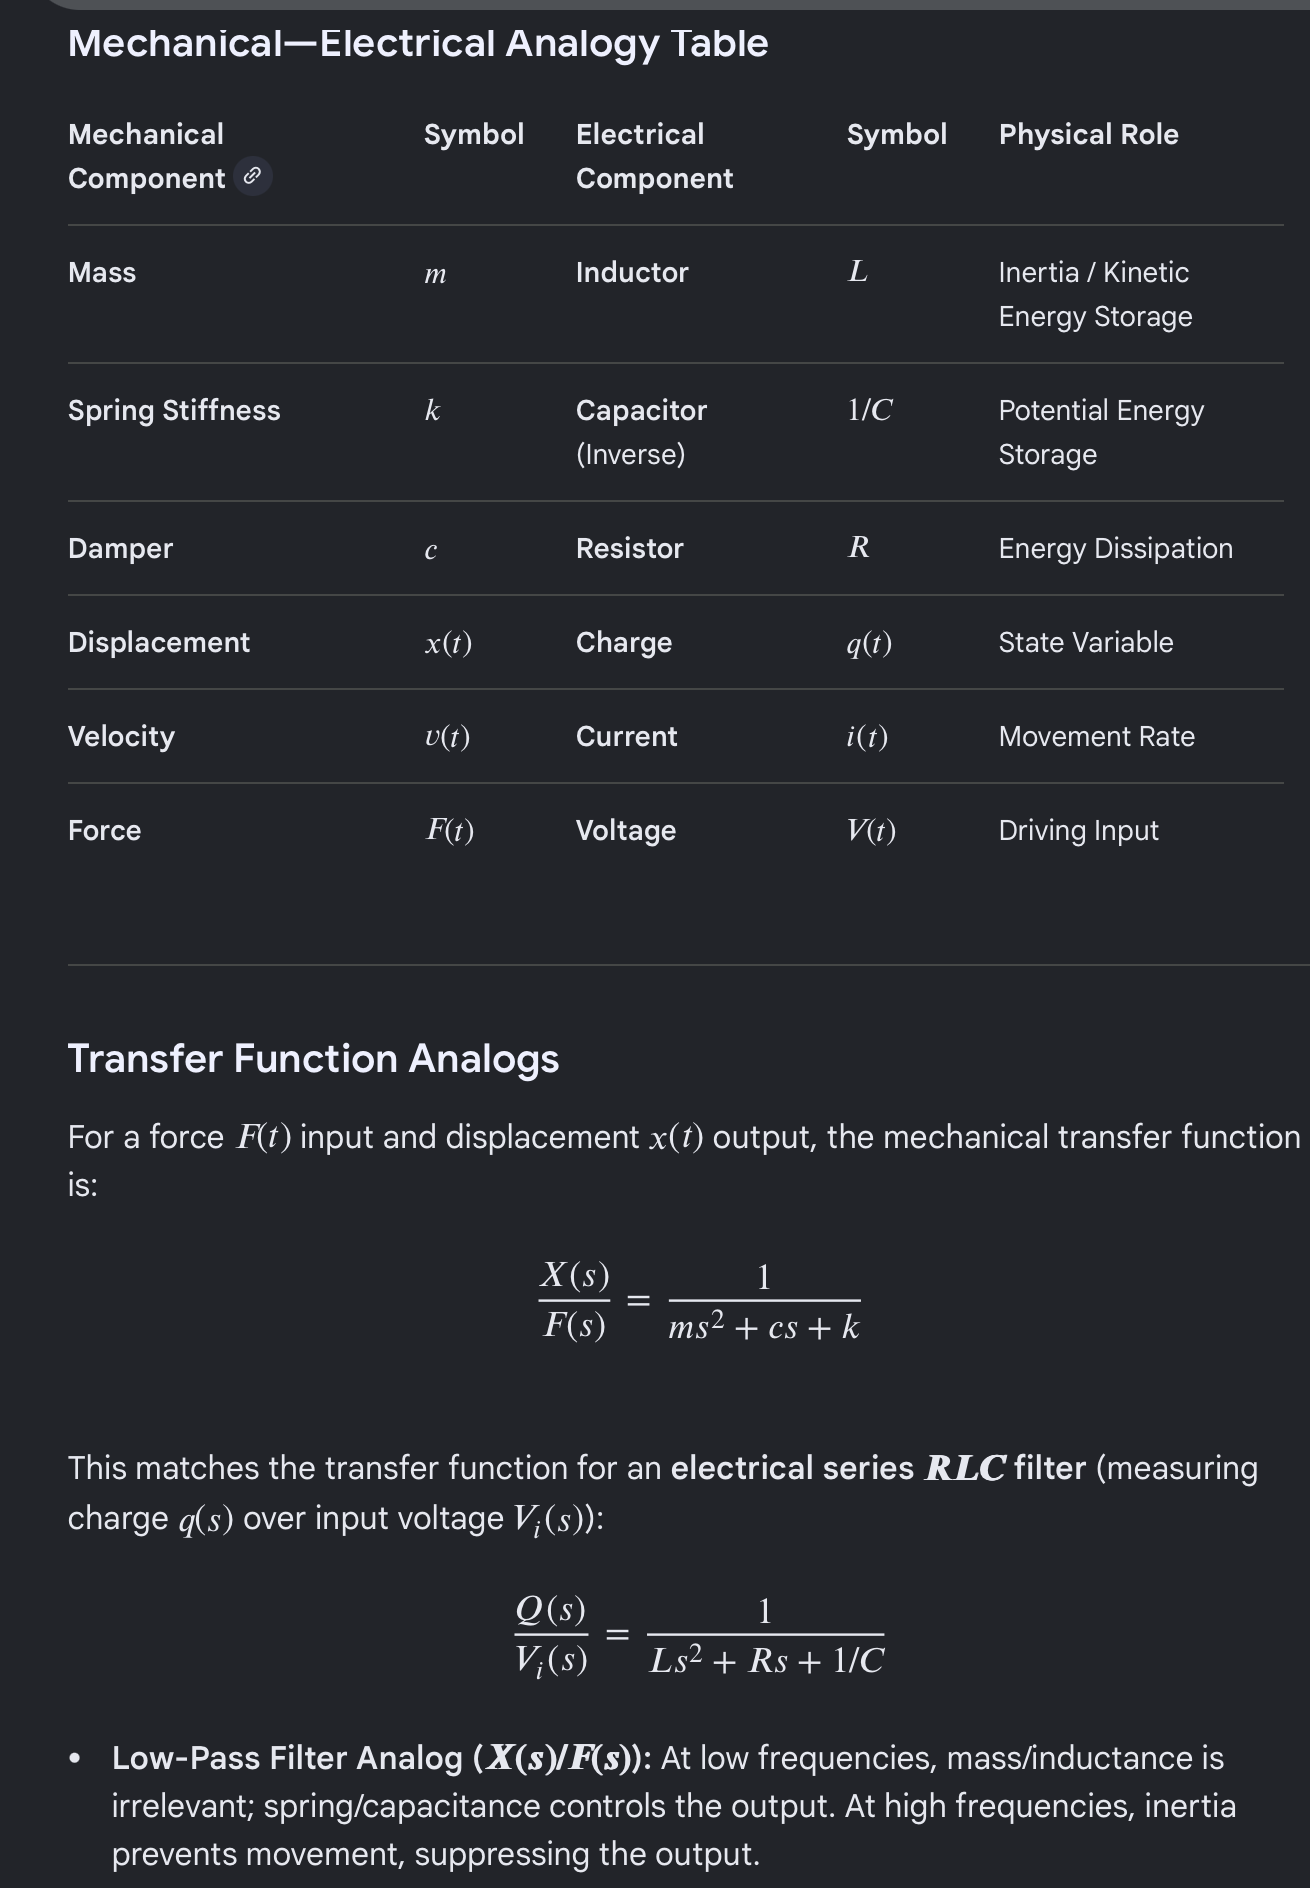
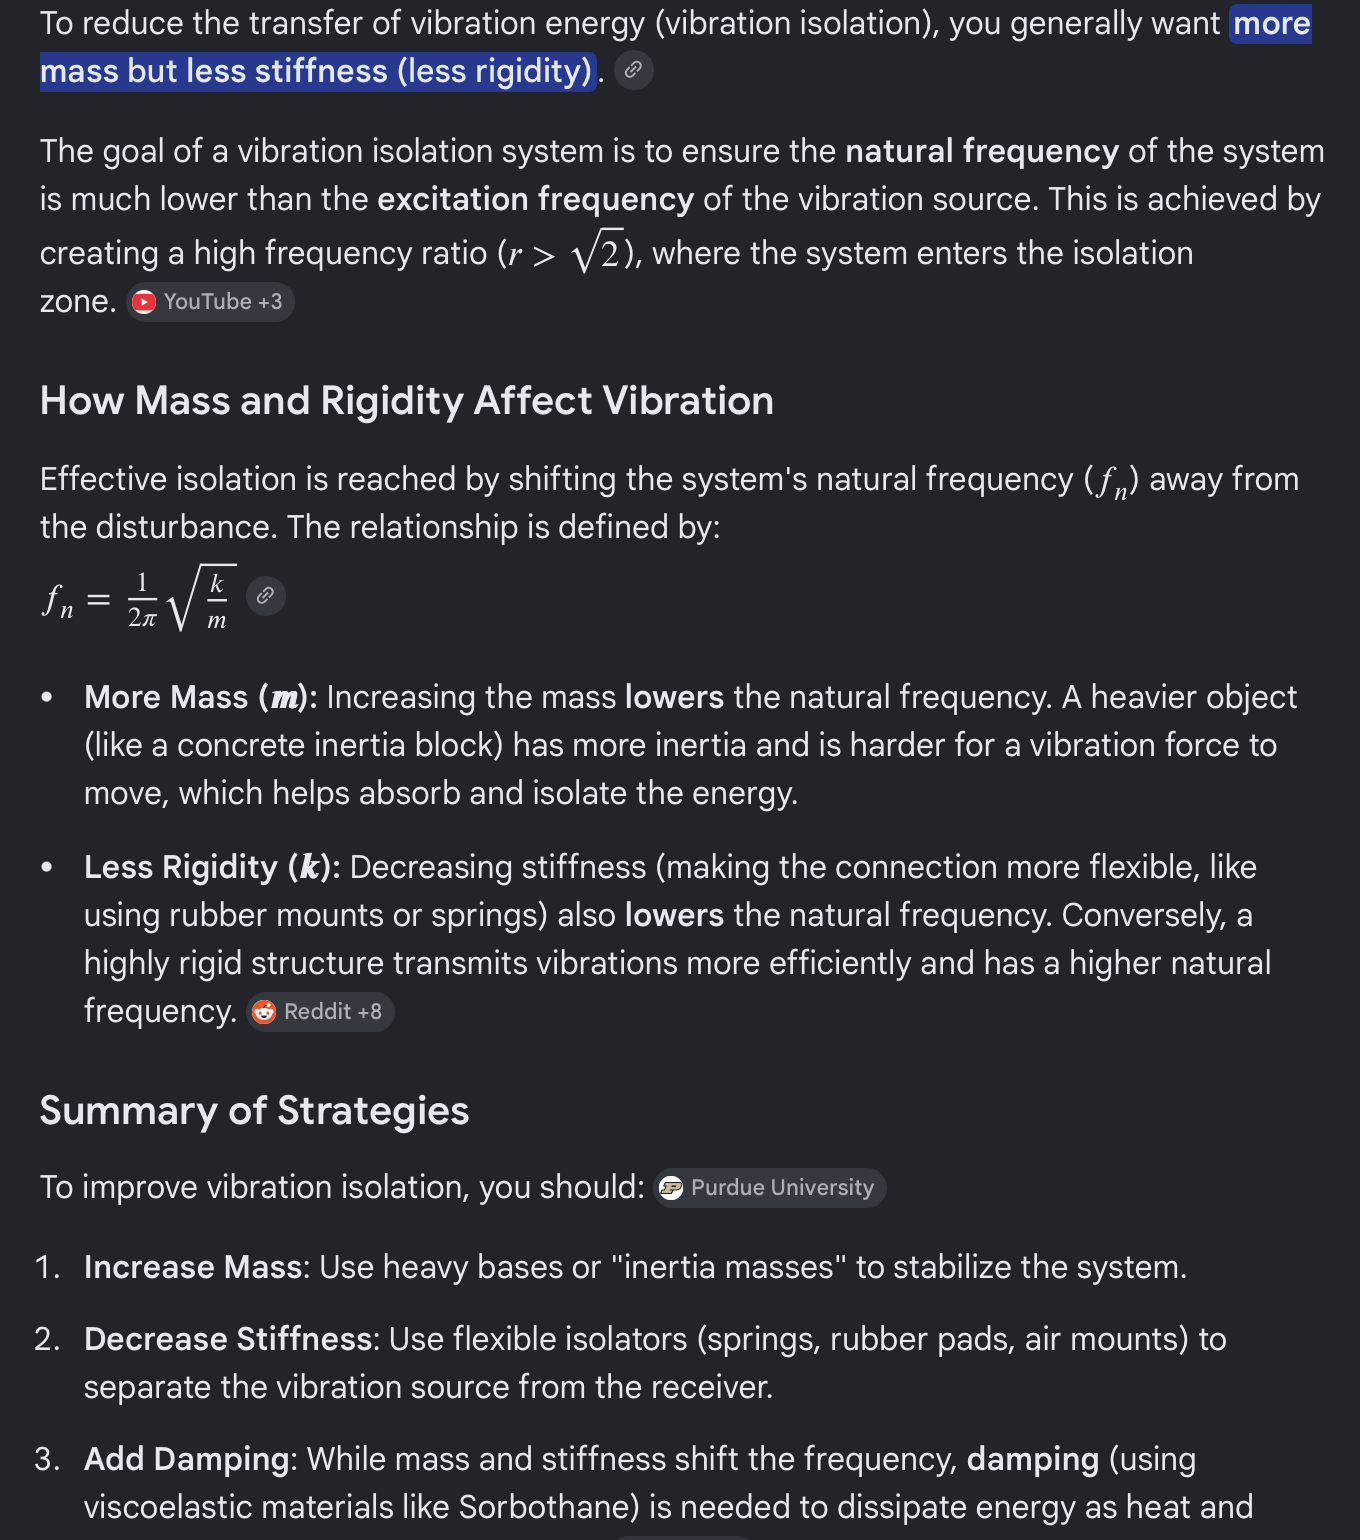
The intuition for stiff mounting is that it keeps the sensor stable relative to the airframe. But that logic breaks down when the airframe itself is vibrating: a stiff connection transmits vibration energy directly into the sensor. The natural frequency of a mounted system is fn = (1/2π) × √(k/m). You want fn well below the engine’s excitation frequencies — which means lower stiffness k and higher mass m. Soft rubber isolators reduce k; adding mass to the isolated platform reduces fn further.
A useful analogy: mechanical vibration systems map directly to RLC electrical circuits — mass to inductance, spring stiffness to 1/capacitance, damping to resistance. A low-pass filter attenuating high-frequency noise is doing the same job as a soft, heavy vibration isolator. The back-of-GDU solution likely works through both added mass and reduced stiffness in the mount path, arriving at isolation inadvertently.
Mechanical mass-spring-damper system and its RLC circuit electrical analog — the math is identical, so filter design intuition translates directly to mount design.Softer spring (lower k) and heavier mass (higher m) both push fn down — the goal is to get the resonant frequency well below the engine’s excitation band.
Even Aft Mounts May Need Additional Reinforcement
One builder who relocated to Van’s designated aft ADAHRS mount (behind the baggage compartment) still had significant vibration issues during Phase 1. The eventual solution was adding substantial metal reinforcement to the mount structure. Their full troubleshooting documentation is in a dedicated VAF thread: GSU-25 Remote Mount Vibration Issue — worth reading before deciding on a relocation strategy.
What Garmin Tech Support Confirmed
CAN Bus Dropouts Confirmed in Flights 1–3
Garmin confirmed intermittent CAN bus dropout signatures in the first three flight logs. What causes the 999% hard pegs specifically has not been established — the dropouts are a confirmed concurrent issue, but attributing those particular readings to the bus alone would be premature. Garmin’s guidance: fix the CAN bus first, get clean logs, then evaluate what vibration problems remain.
CAN Bus Length: ~87 Feet vs. 66-Foot Maximum
Garmin’s maximum recommended CAN bus length is 20 meters (66 feet). My estimate puts the total run in N997CZ at ~87 feet — about 21% over spec. Beyond that length, signal reflections and attenuation degrade bus integrity, especially with non-spec cable.
Wrong Wire: Standard Twisted Pair Instead of 120Ω Controlled-Impedance
The CAN bus requires 120Ω characteristic impedance. Standard aircraft twisted pair (~$1/ft) doesn’t reliably hit that spec, causing signal reflections that look like dropouts at the receiver. Garmin specifically recommends Carlisle IT P/N CAN24TST120(CIT) or GigaFlight P/N GF120-24CANB-1 (~$7/ft). Estimated rewire cost: $420–$560 in cable for a 60–80 ft run.
Two Problems, a Ranked Action Plan
Problem 1 — Fix First (per Garmin): CAN Bus. Wrong wire spec, over-length run, confirmed dropouts. Resolve this completely before evaluating what vibration problems remain.
Problem 2 — Address After CAN Bus Is Clean: Vibration. The tumbling horizon and escalating deviation pattern across five flights make it clear something is wrong — the clean-CAN-bus baseline will tell us how much of it is vibration.
Measure CAN bus run length precisely before ordering wire.
Rewire CAN bus with Carlisle IT CAN24TST120(CIT) or GigaFlight GF120-24CANB-1. Verify 120Ω termination at both ends.
Re-fly and pull fresh logs — establish a known-good CAN bus baseline.
Contact Garmin re: SB 2144 — both GSU 25Cs are in the affected serial number range.
Inspect lower cowl vertical hinge pins for any play. Replace with oversized pins if flex is detectable.
Evaluate GSU mount options — rubber isolators on current sub-panel location, or relocation to GDU back-panel or aft Van’s mount with reinforcement.
Post-fix flight test — five clean flights, deviation at baseline, horizon that stays put.
I’m cautiously optimistic that this is all solvable — the VAF community has collectively worked through every one of these failure modes, and there are clear paths forward. But I want to earn that optimism with data, not just a plan.
If you’ve dealt with ADAHRS deviation on your own build, or have experience with the SB 2144 units, I’d love to hear from you in the comments or over on the VAF thread. This community has already saved me multiple trips down dead ends and I’m grateful for every one of those replies.
N997CZ is a homebuilt experimental aircraft (Van’s RV-10). This post documents personal experience during Phase 1 flight testing. Nothing here constitutes maintenance or airworthiness advice. Consult your avionics manufacturer and A&P/IA for guidance specific to your aircraft.