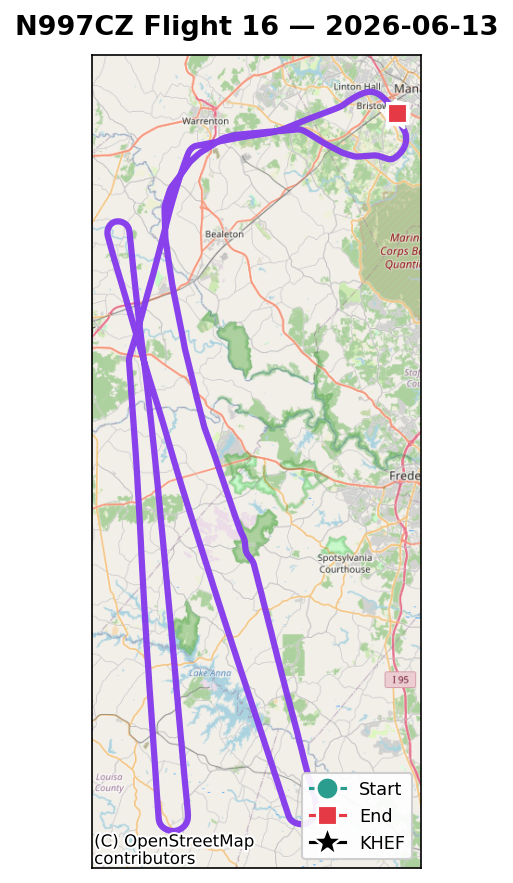
After the climb sortie, Flight 16 turned to the next block in the Phase 1 deck: cruise performance and leaning. Pick one altitude, hold it dead steady, and step through power and mixture settings, logging speed and fuel flow at each stabilized point. The ground track tells you what that looks like from above — long, patient straight legs instead of the racetracks and sawtooths of the maneuvering flights.
It was also quietly historic for a different reason: this was the first flight with both attitude units overhauled (more on that below).
The Numbers
| Date | 2026-06-13 (morning) |
| Engine time | ~1.7 hr |
| Engine hours | 22.2 → 23.9 |
| Test altitude | 7,500 ft MSL, 2500 RPM (density alt ~8,900 ft) |
| Max altitude | ~7,550 ft MSL (7,905 ft GPS) |
| Fuel used | 22.7 gal (totalizer) — matched the truck receipt (21.70 gal) to ~1 gal |
| Cards flown | 16-1 (cruise set-up), 16-2 (speed-power polar), 16-3 (mixture sweep) |
| Conditions | cool morning (cruise OAT +55 °F) |
📄 Test cards: Flight 16 test cards (PDF)
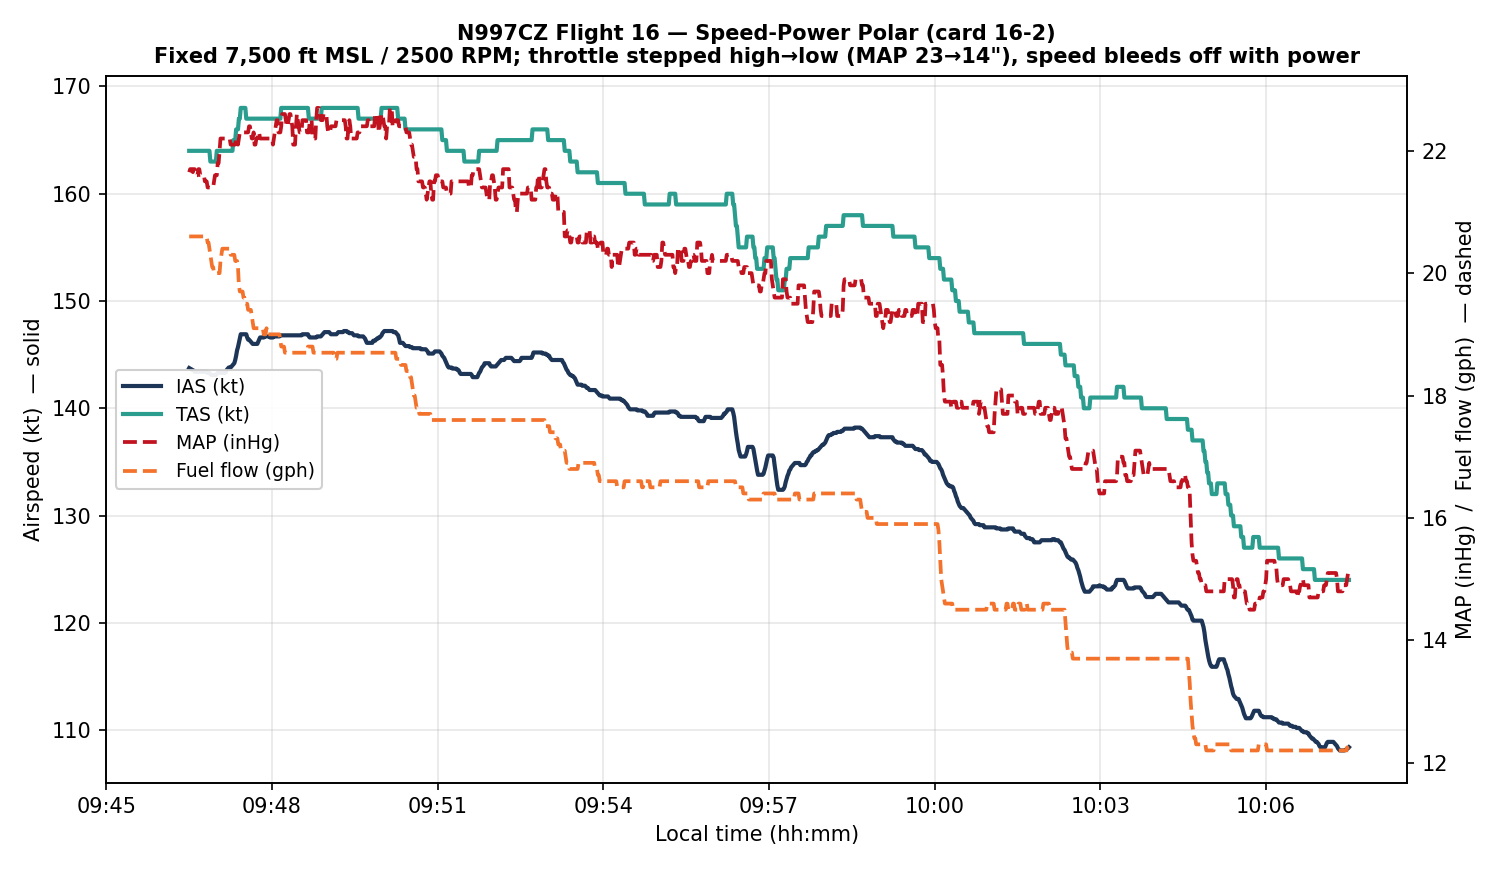
The Speed-Power Polar
The heart of the flight: hold 7,500 ft and 2500 RPM, then step the throttle down through a range of manifold pressure, letting the airplane stabilize at each setting. The stabilized points (power is the G3X’s own computed engine percentage):
| MAP | Power | Fuel flow | TAS | Economy |
|---|---|---|---|---|
| 22.5″ | 70% | 18.7 gph | 168 kt | 9.0 nm/gal |
| 21.5″ | 67% | 17.6 gph | 164 kt | 9.3 nm/gal |
| 20.5″ | 64% | 16.8 gph | 162 kt | 9.6 nm/gal |
| 19.3″ | 60% | 15.9 gph | 156 kt | 9.8 nm/gal |
| 17.9″ | 55% | 14.5 gph | 149 kt | 10.3 nm/gal |
| 16.9″ | 52% | 13.7 gph | 141 kt | 10.3 nm/gal |
| 14.8″ | 46% | 12.3 gph | 133 kt | 10.8 nm/gal |
It’s the classic trade, made concrete: near wide-open (~22.5″, 70% power, 18.7 gph) the airplane trues a brisk 168 knots but returns only 9.0 nm/gal; pull the throttle back toward 15″ (about 46% power) and you give up roughly 35 knots of true airspeed to gain about 20% in fuel economy — up past 10.8 nm/gal. At a fixed mixture, every extra knot of speed costs efficiency: the balance every cross-country pilot strikes.
Two caveats before anyone quotes these figures. This is not the airplane’s top speed. Every point was flown at a fixed 2,500 RPM — not the 2,700 the engine turns at full power — and at 7,500 ft with the mixture full rich, so even the 168-knot top row is leaving speed on the table compared to full throttle, full RPM, and a more efficient altitude. This is a controlled comparison, not a speed record. And it is not best economy. Full rich is the thirstiest way to make any given power; the real fuel savings come from leaning, which is exactly what the next card went after. Read the table for the shape of the power-speed-fuel trade at one condition, all else held equal — not for the best the airplane can do at either end.
Here’s the whole sequence as flown — throttle stepped down in stages at a fixed altitude, with the airspeed settling out at each new power setting:
The Lean Sweep (GAMI Spread)
Then the part I’d been looking forward to: card 16-3, the mixture sweep. Hold the airplane at 7,500 ft and 2500 RPM, leave the throttle alone (manifold pressure parked at ~21.3″, wandering maybe ¾ of an inch), and pull the mixture back slowly — about 16 down to 11 gph — while the G3X logs all six cylinders’ exhaust gas temperatures. Each cylinder’s EGT climbs to a peak and then falls; the fuel flow at which it peaks tells you how rich or lean that cylinder runs relative to the others. The spread between the first and last cylinder to peak is the GAMI spread — the headline number for how well your fuel injectors are matched.
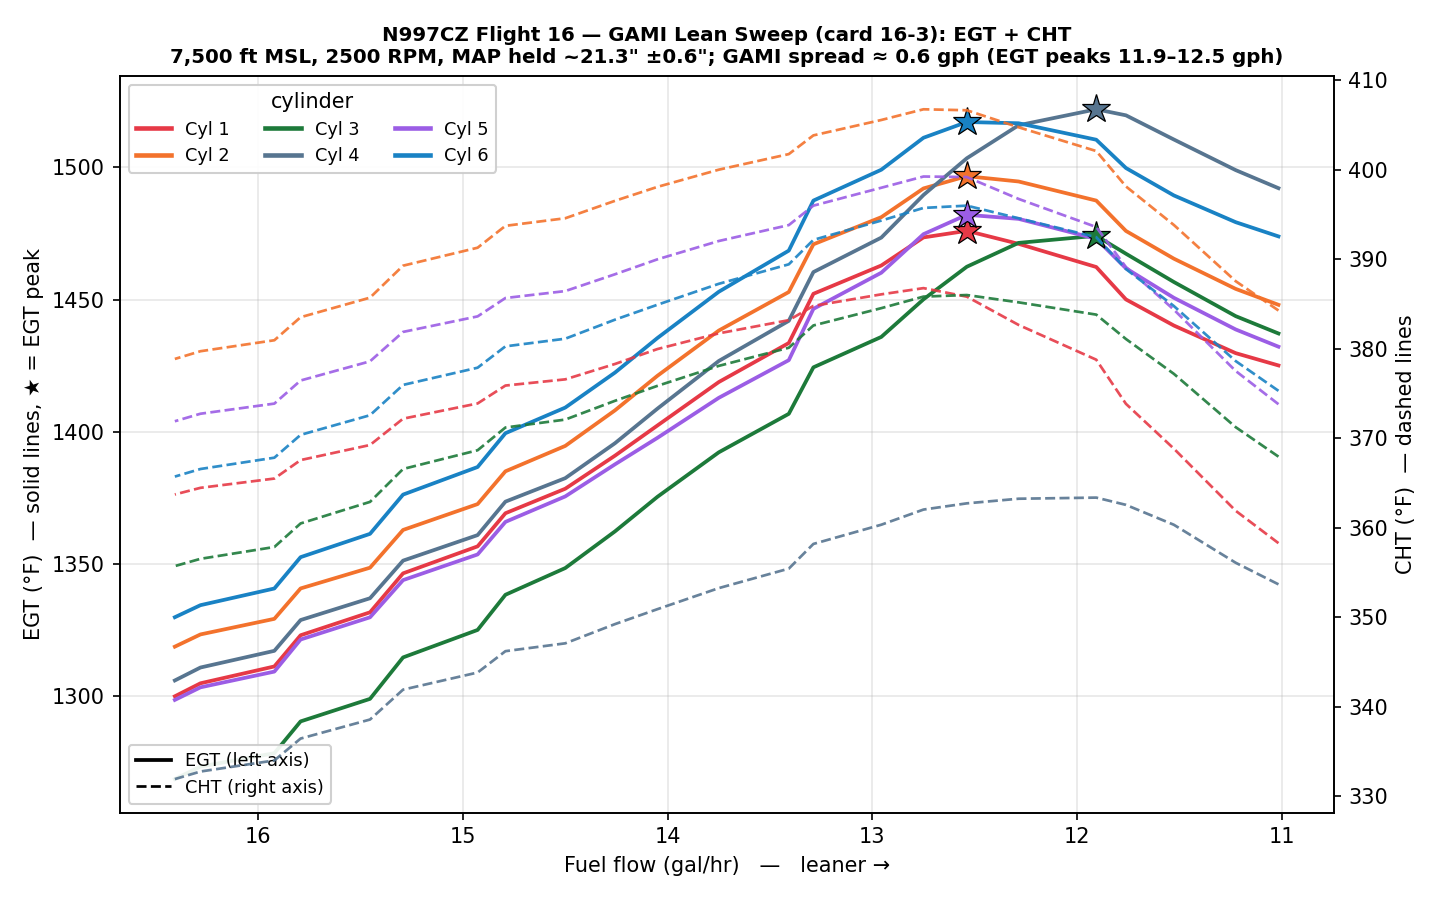
The result is a good one: a GAMI spread of about 0.6 gph. Cylinders 1, 2, 5, and 6 peak first (around 12.5 gph — they run slightly leaner), and Cylinders 3 and 4 peak last (around 11.9 gph — slightly richer). Anything under ~1 gph is generally considered well-matched and capable of smooth lean-of-peak operation, so this engine’s injectors are in good shape right out of the box.
The dashed lines on the chart are the cylinder head temperatures (right axis), and they tell their own reassuring story. As expected, each CHT peaks just slightly rich of its EGT peak, and the hottest any head got during the entire sweep was about 407 °F (Cylinder 2) — comfortably below limits the whole time, even at the richest, highest-EGT settings. Leaning this engine doesn’t cook it. (One honest note on method: the curves are read straight off the logged data; with a conventional left mag and the SDS electronic ignition on the right, the absolute EGT picture carries that timing asymmetry, but the relative peak ordering — which is what the spread measures — is robust.)
And here’s the bonus the sweep makes vivid: leaning buys efficiency far more cheaply than throttling back does. Hold the same ~21″ of manifold pressure the polar started at, and instead of closing the throttle, just lean the mixture — the airplane still trues about 163 knots on 13.3 gph, a tidy 12.3 nm/gal (and leaner still, up to ~14 nm/gal). Back on the speed-power polar it took ~18.7 gph of throttle to make that same ~163 knots, at just 9.0 nm/gal. Same speed, roughly a third less fuel. That’s the whole point of leaning, made concrete.
Here’s the sweep in the same form as the polar table above — but watch the Power column, because that’s the whole story. On the polar, economy only improved as power (and speed) came down. Here power holds at ~65% the entire time; leaning alone buys the efficiency, and the speed barely moves until the very lean end:
| Fuel flow | Power | TAS | Economy |
|---|---|---|---|
| 16.0 gph | 64% | 162 kt | 10.2 nm/gal |
| 15.0 gph | 66% | 163 kt | 11.0 nm/gal |
| 14.0 gph | 66% | 163 kt | 11.6 nm/gal |
| 13.3 gph | 66% | 163 kt | 12.3 nm/gal |
| 12.5 gph | 65% | 161 kt | 13.0 nm/gal |
| 11.5 gph | 66% | 157 kt | 13.7 nm/gal |
| 11.0 gph | 65% | 155 kt | 14.0 nm/gal |
(All held at ~21″ MAP and 7,500 ft — the same condition as the GAMI sweep above.)
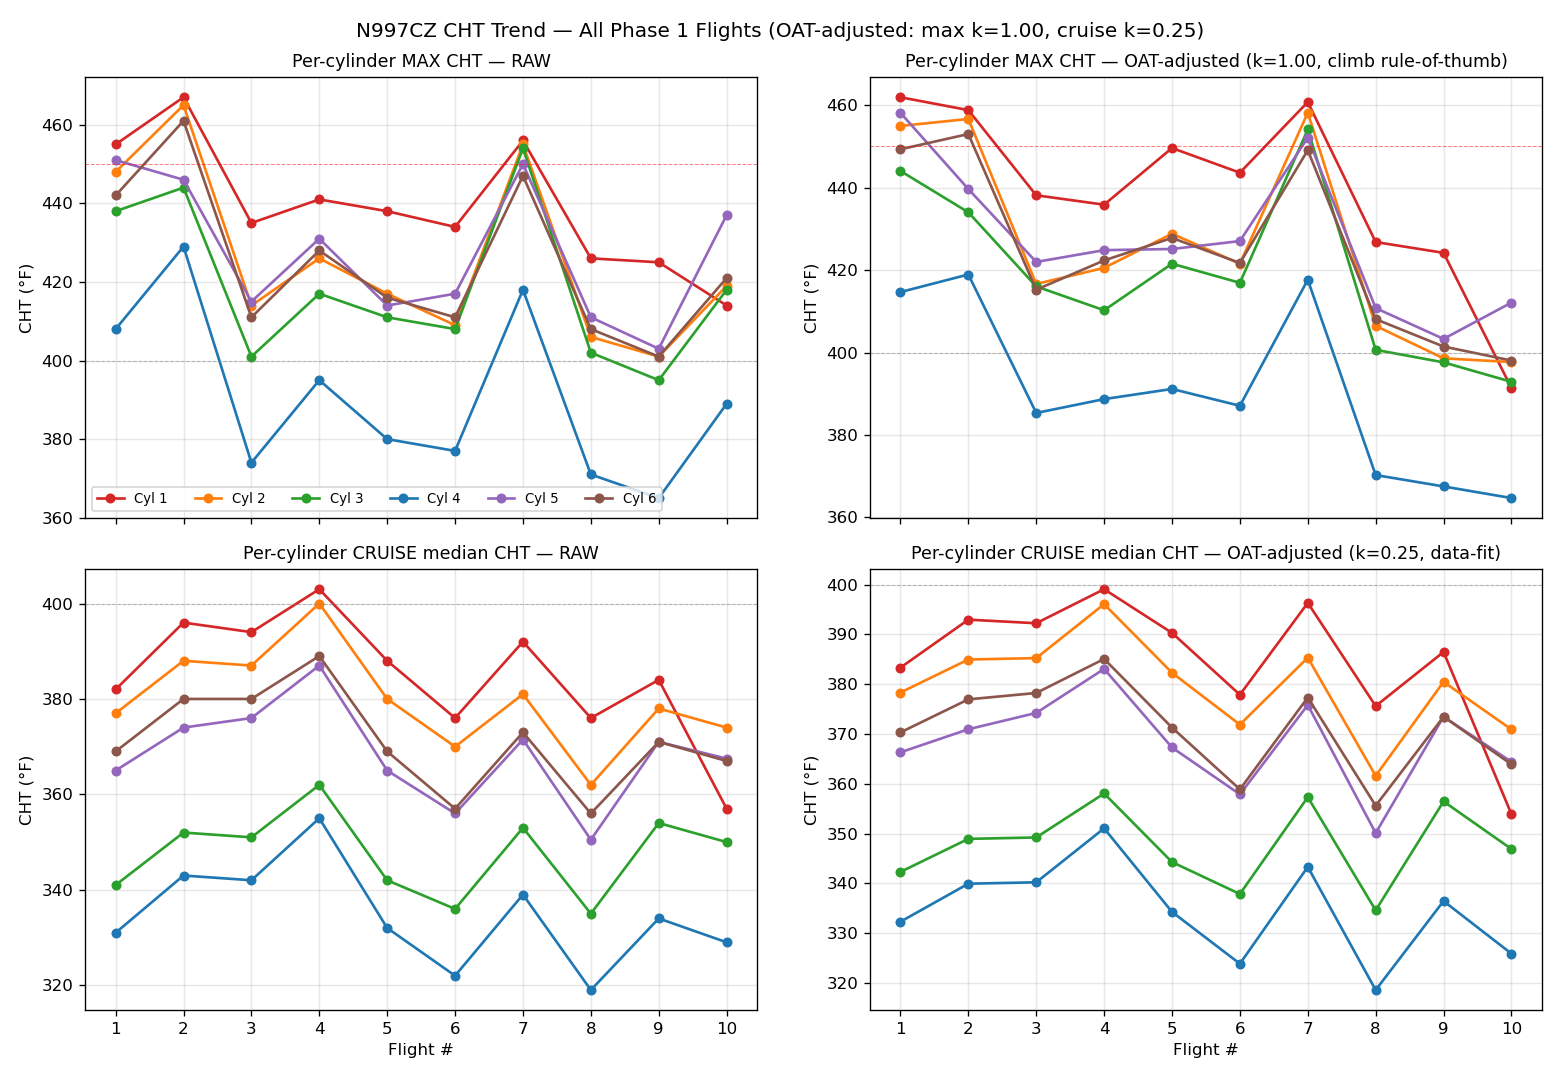
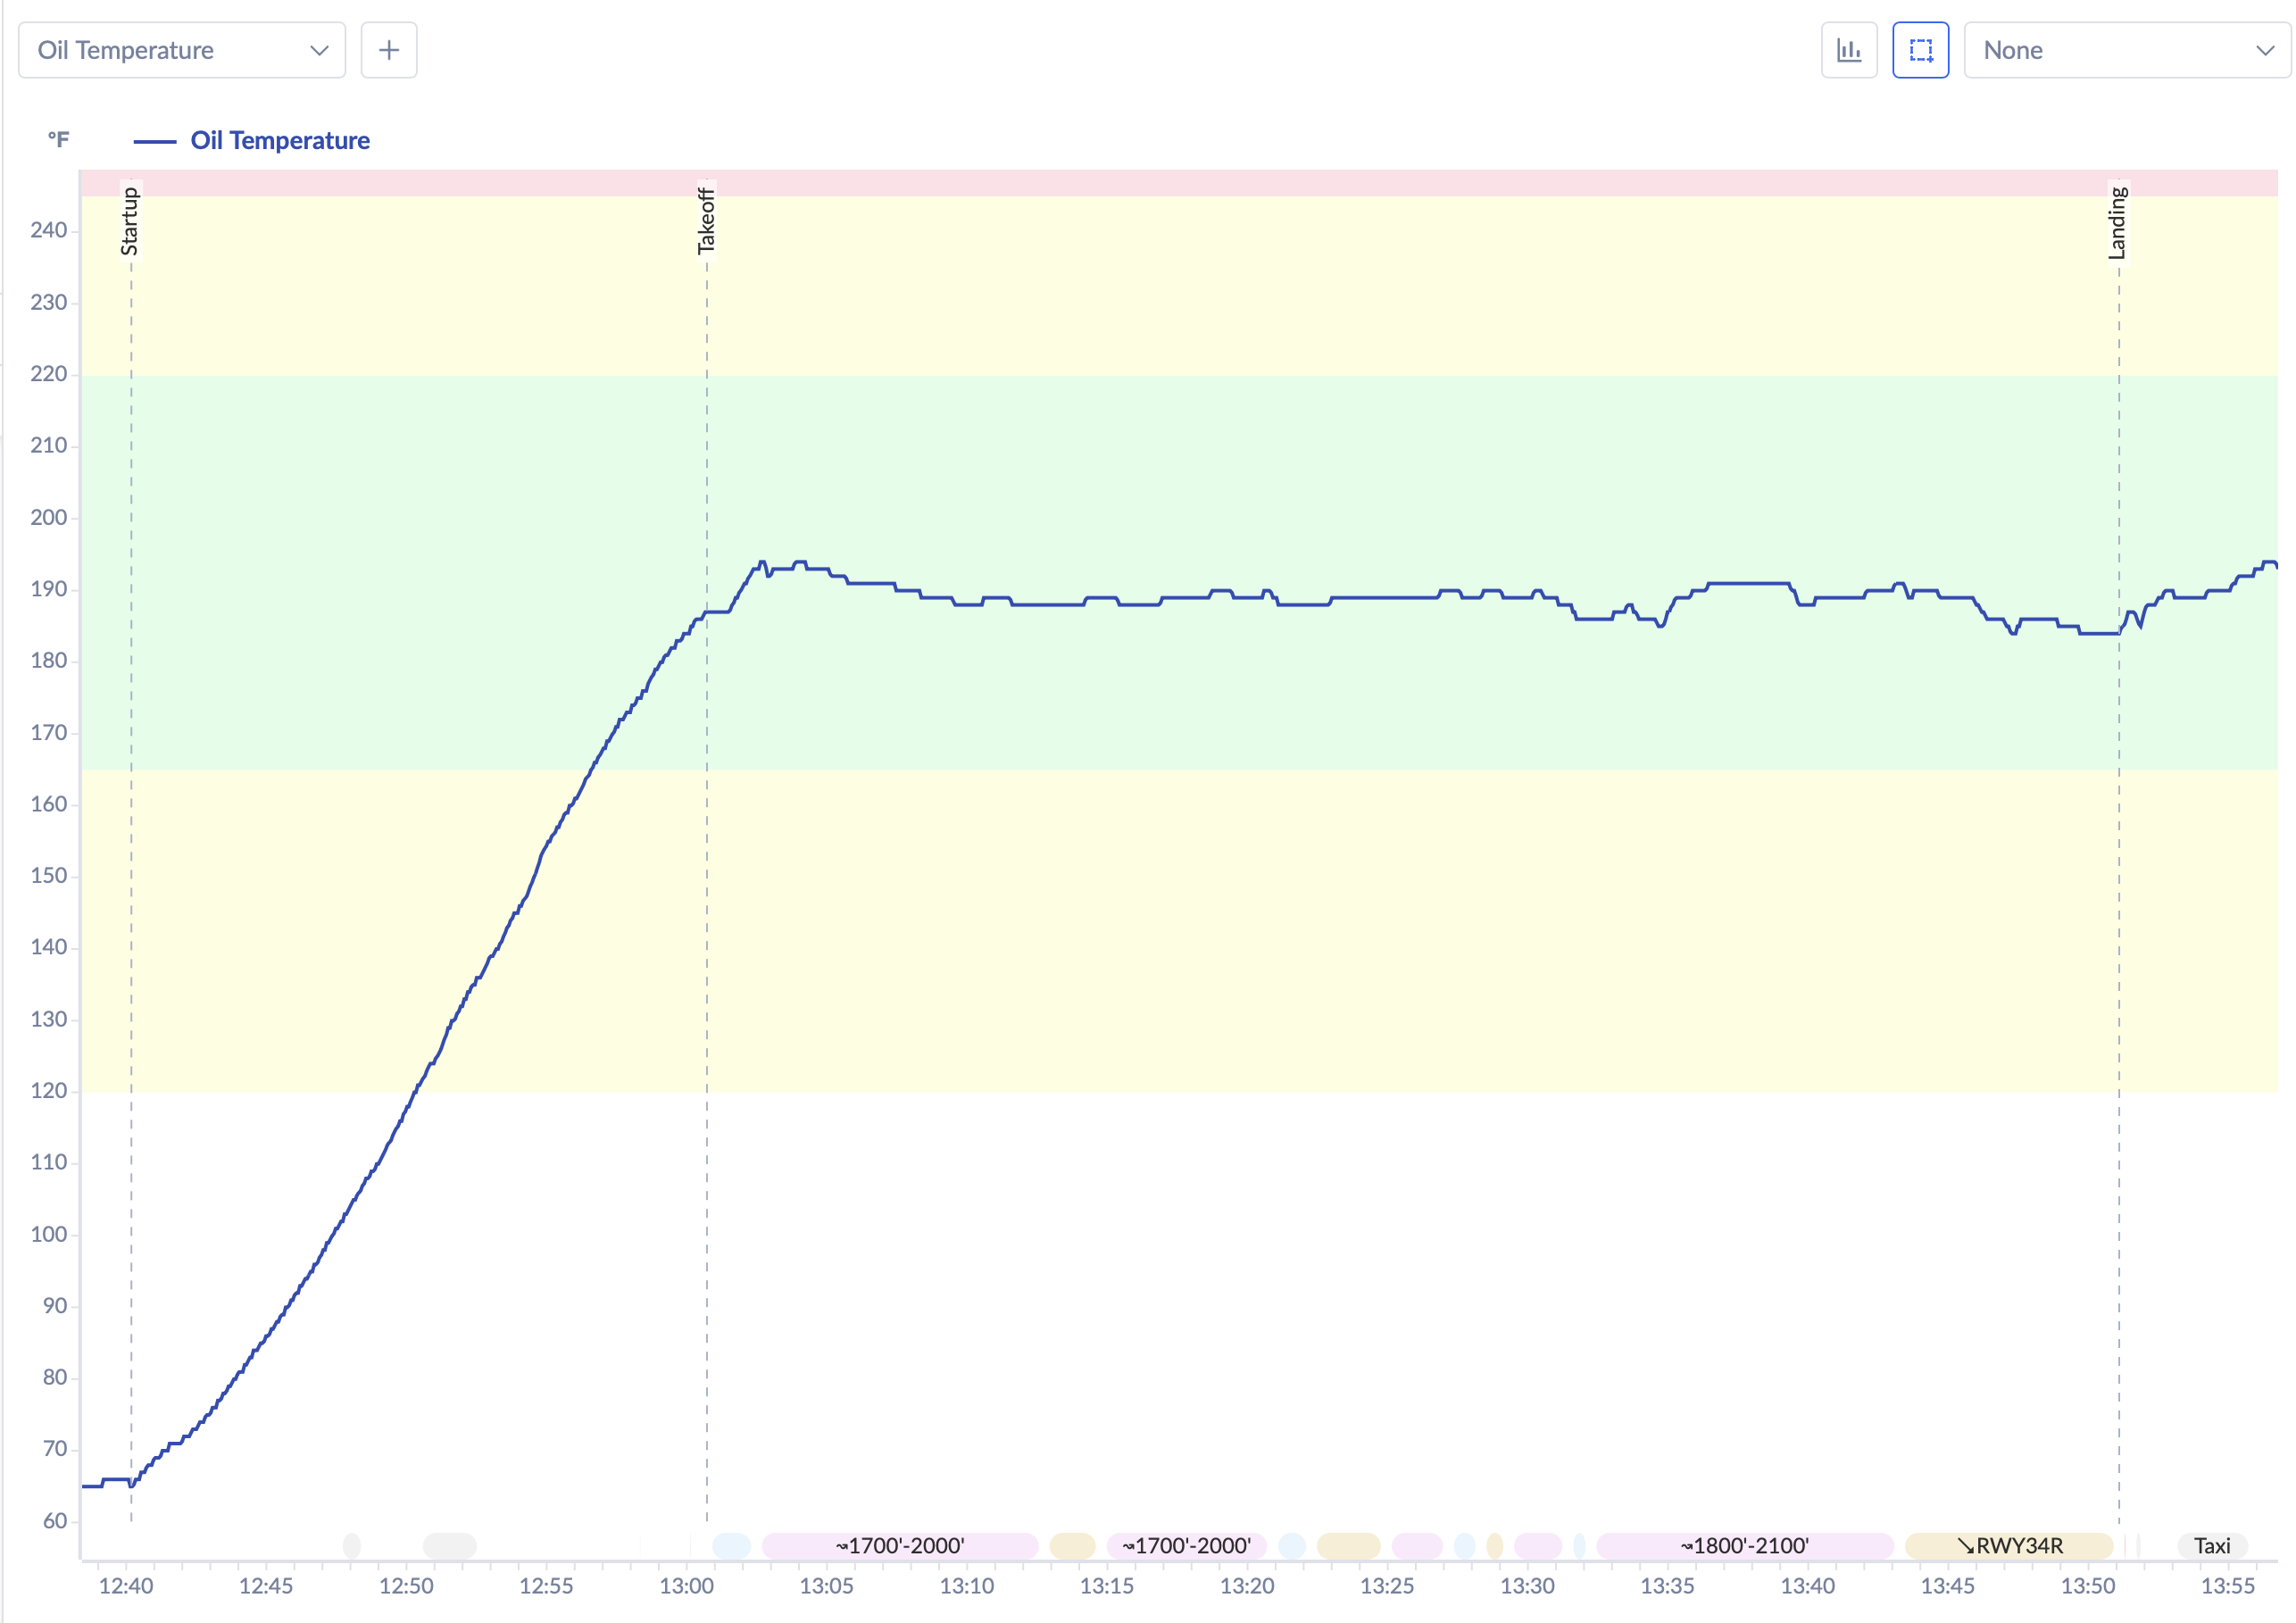
Cooling and CO
Nothing dramatic, which is the goal in cruise. CHTs stayed comfortable — Cylinder 5 the hottest at 421 °F, everyone else lower, all well under limits. Cabin CO read essentially zero the whole flight. That’s roughly what you’d expect from a stabilized cruise with no sustained slow flight — this airplane’s CO ingress shows up in high-angle-of-attack work, which wasn’t on today’s card — but a flat zero earns an eyebrow rather than a victory lap: Flight 13 also read zero, yet the same detector logged a normal small reading on Flight 17 later the same day. Whether F16’s zero is genuinely clean air or a detector that simply wasn’t reading is still on the verify list.
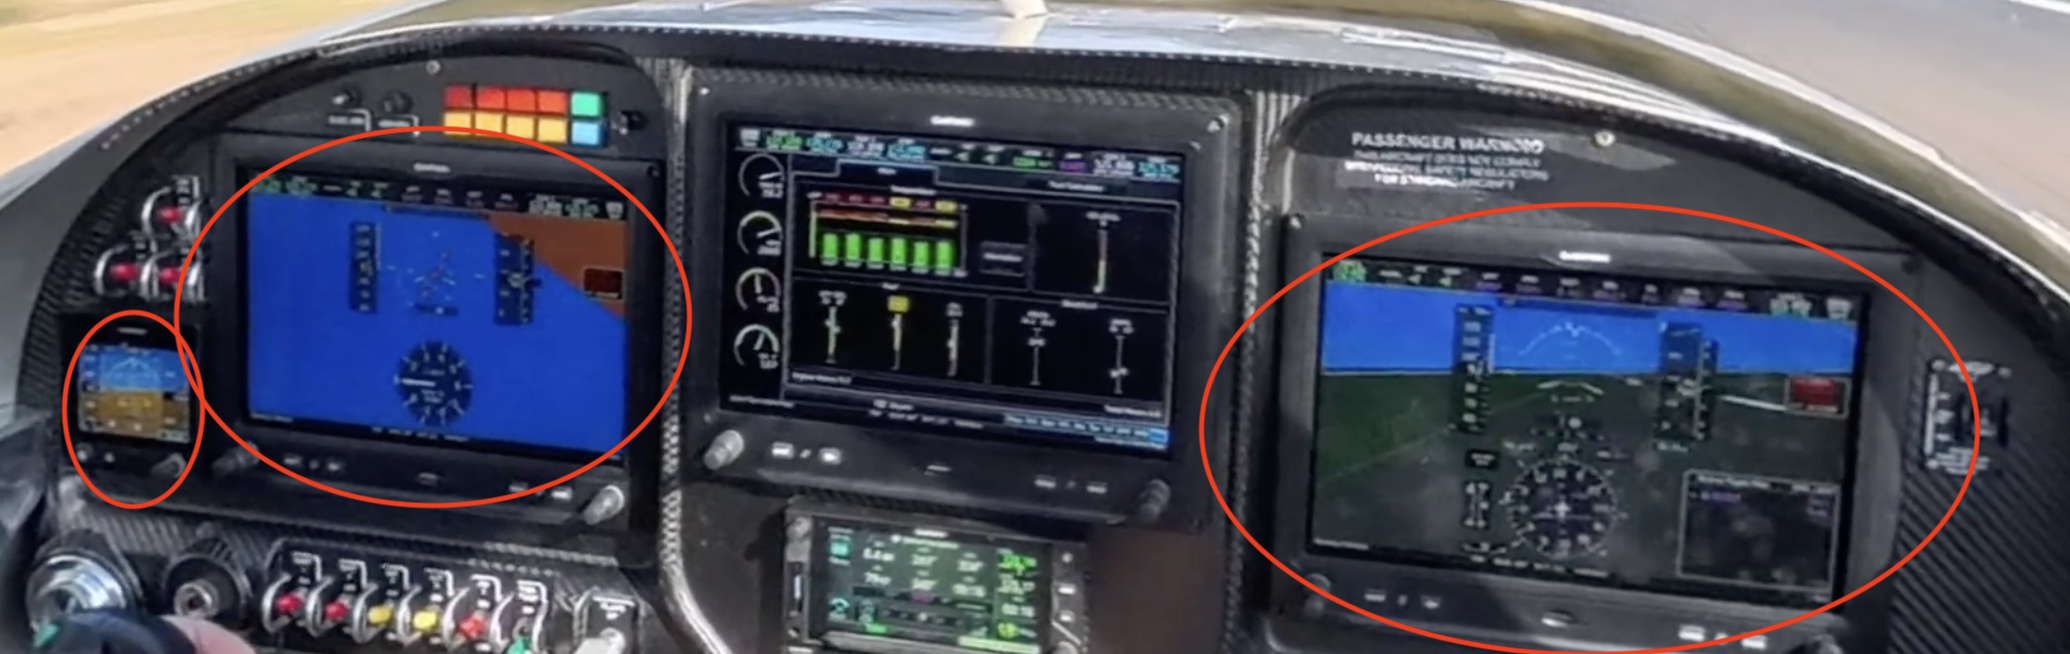
Three Healthy Horizons
Here’s the quiet milestone. The overhauled second attitude unit (AHRS #2) was installed before this flight, so Flight 16 is the first time N997CZ has flown with both ADAHRS units overhauled. The verification was clean: through the whole flight, from takeoff roll to landing, the two units disagreed by less than a degree in roll, there were no re-aligns, and — for the first time in a long time — zero attitude or heading miscompare annunciations. After a long-running saga, the airplane finally has three attitude opinions that all agree. The full story is in the AHRS post.
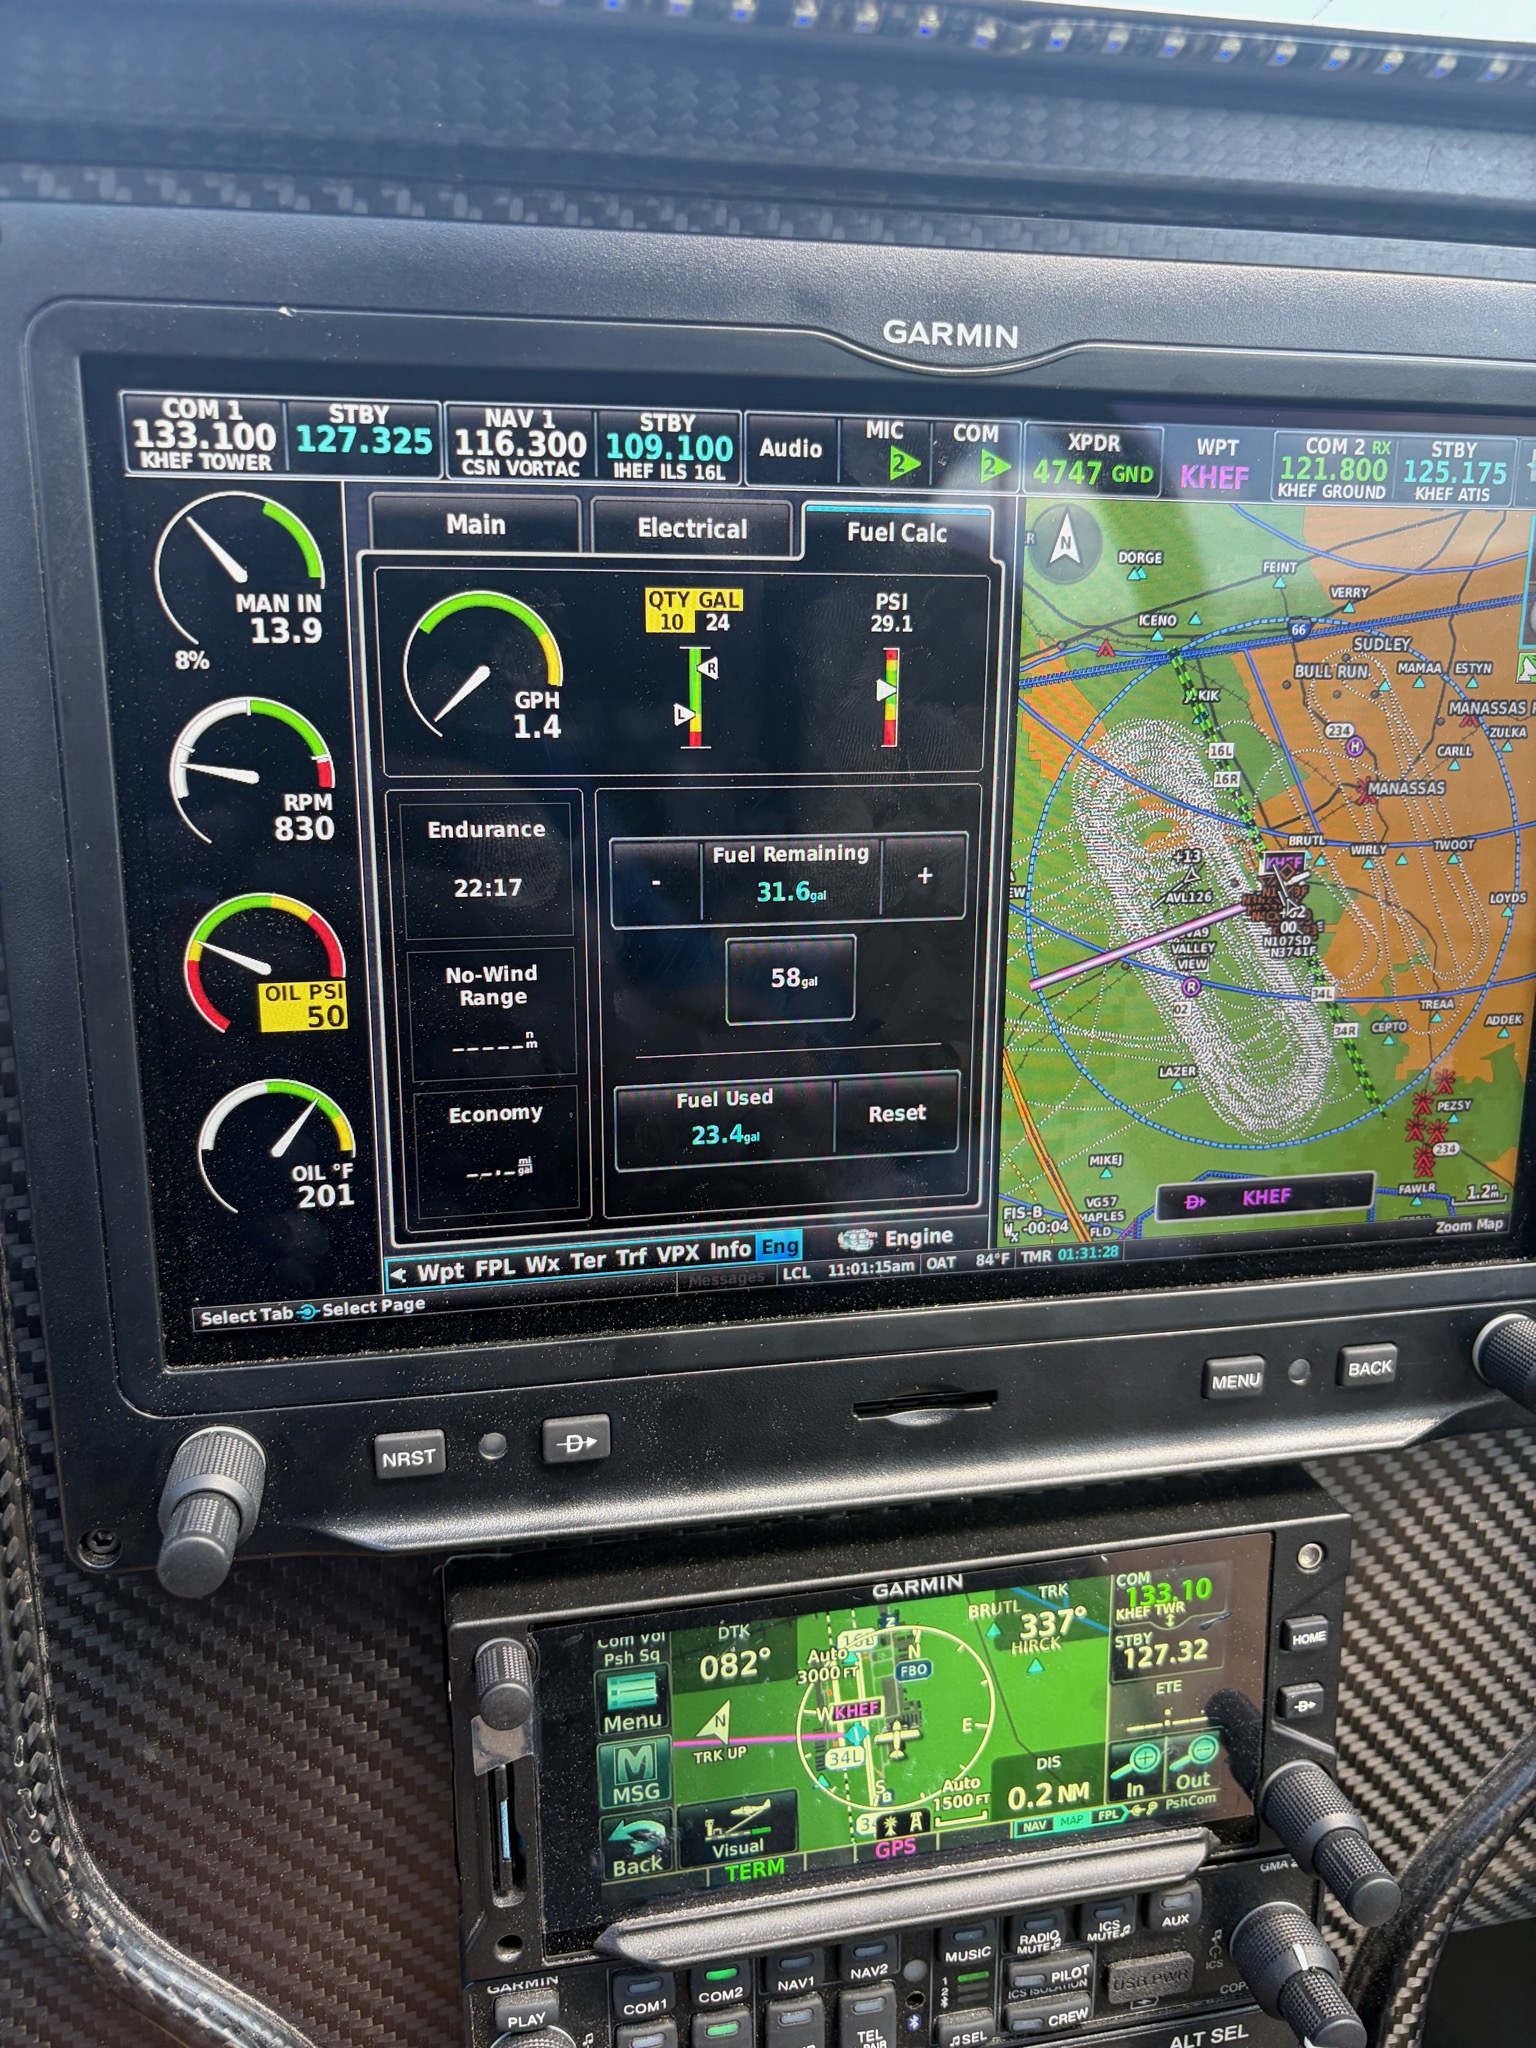
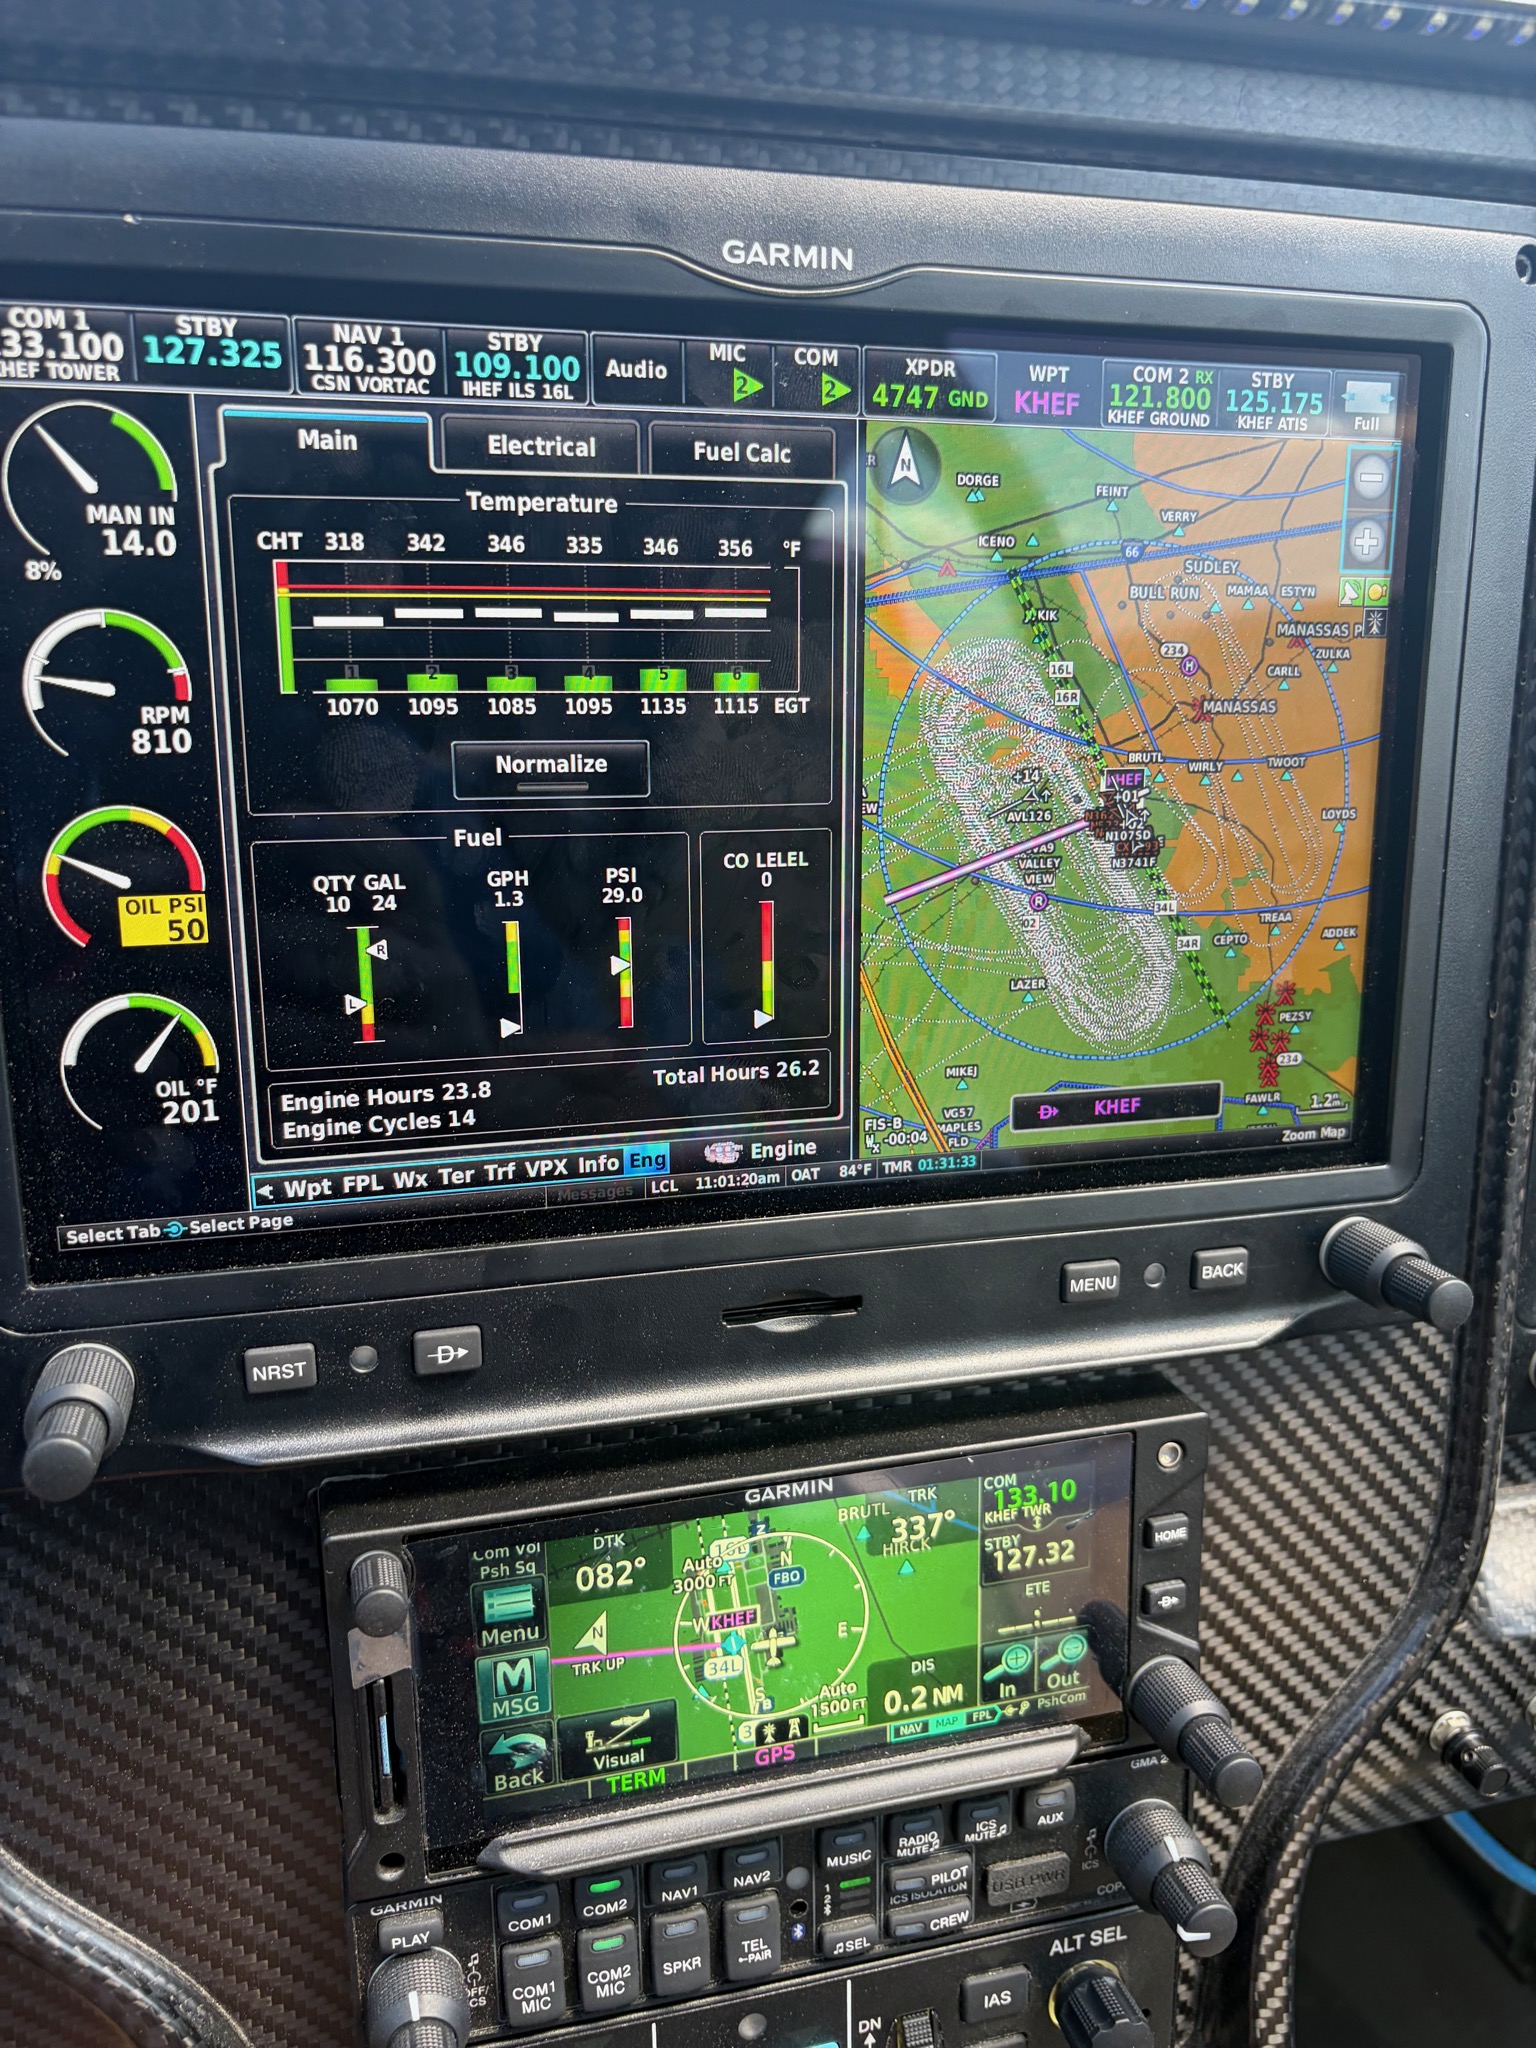
After Shutdown
Two panel photos from the ramp after the flight — documentation of the final engine state, not in-flight readings:
Bottom Line
A clean set of cruise numbers (12+ nm/gal on the table), a tight ~0.6 gph GAMI spread that says the injectors are well-matched, cooling with margin to spare, and a verified-healthy attitude system. A productive morning’s worth of test cards. Next: the rest of the systems and performance cards.
— Jim