N997CZ — Flight 11: A Multi-Speed Airspeed Calibration

Ground track for N997CZ Flight 11 over the Phase 1 test area, with the DAR-approved pentagon boundary (KFRR–KHEF–KXSA–KFVX–KSHD) and landing airports marked, on OpenStreetMap tiles
Ground track for Flight 11 over the Phase 1 test area, with the DAR-approved pentagon boundary and landing airports marked.

Most of the flights so far have been about finding problems — a CHT that ran hot, an ADAHRS that wouldn’t behave, carbon monoxide where there shouldn’t be any. Flight 11 was different. This one had a single, deliberate job: figure out how honest the airspeed indicator actually is, across the whole speed range, in one sortie.

It turned into the longest flight on the airplane so far, and it produced the cleanest dataset I’ve collected yet. It also made me go back and admit I’d gotten an earlier piece of analysis wrong. More on that below.


The Numbers

Date2026-05-31
Engine time~2.5 hr (longest flight to date)
Distance285.6 nm (GPS path)
Fuel used30.4 gal (totalizer)
Engine hours12.4 → 14.9 hr
Cruise altitude~6,500 ft
Cruise OAT+45.5 °F (cool morning)
Autopilot~64% of the flight
Configflaps up throughout — including, it turned out, the landing; 7 qt oil

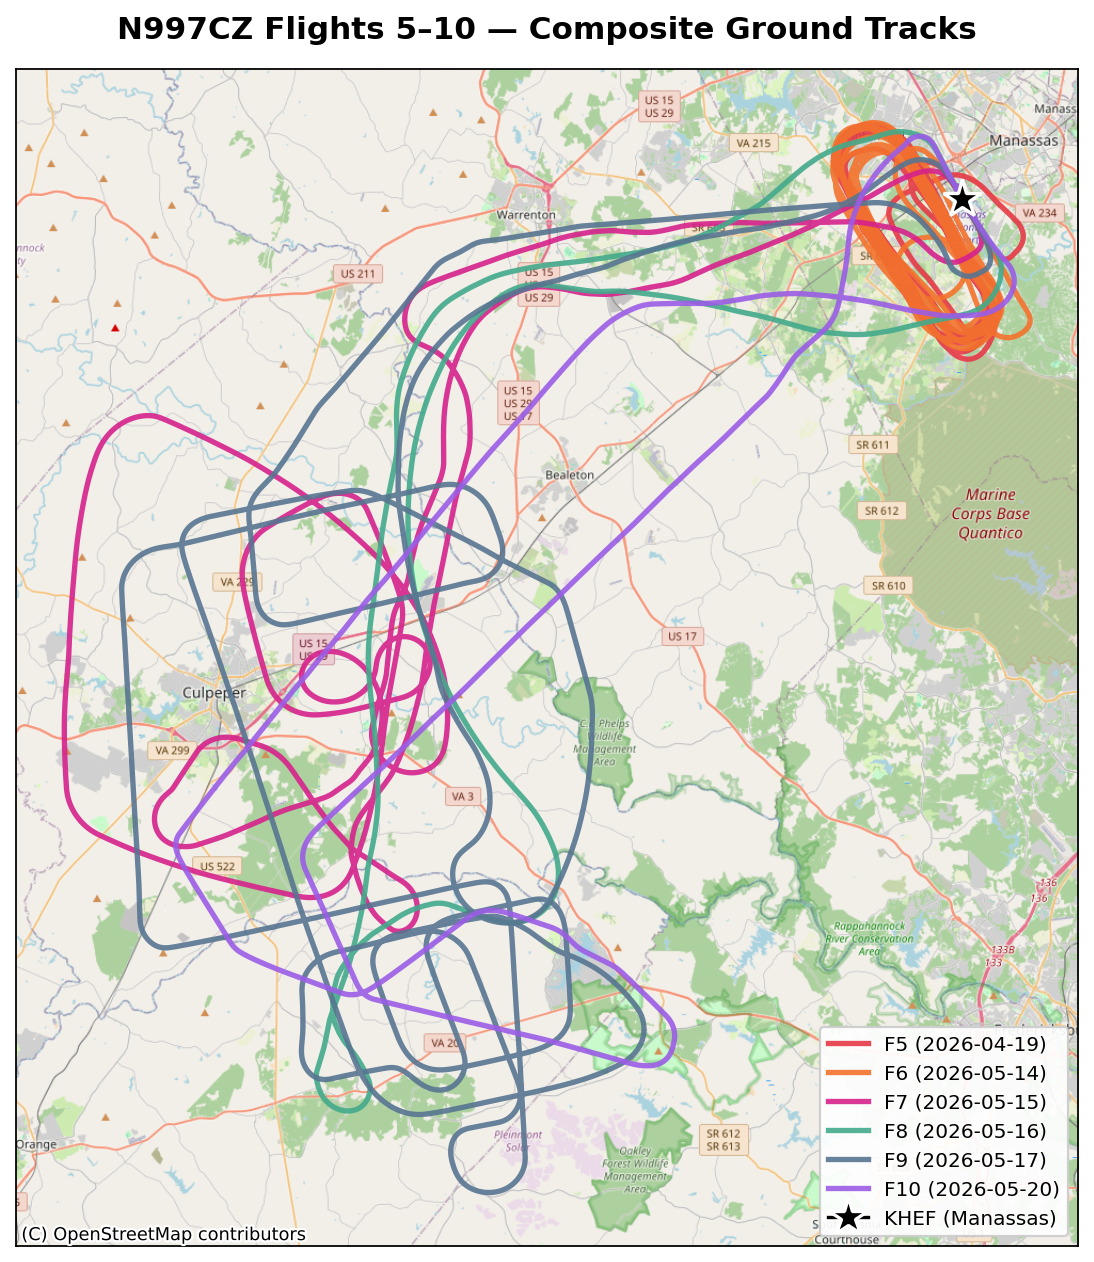
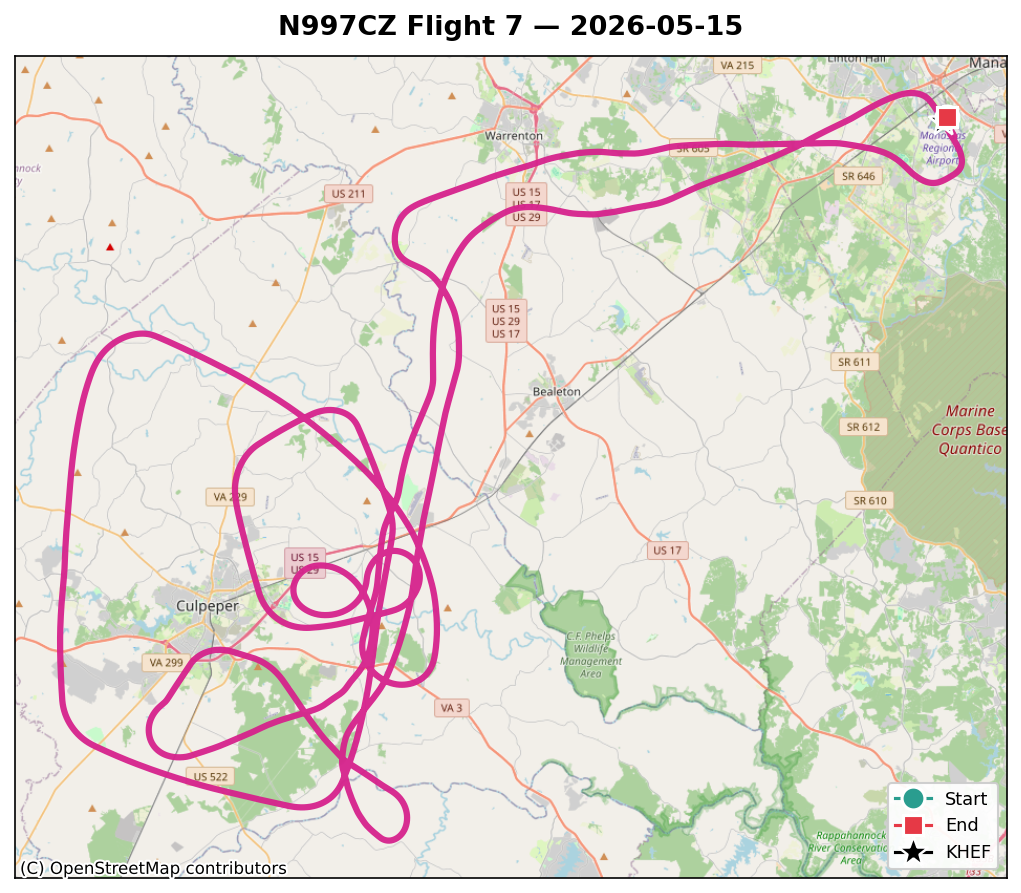
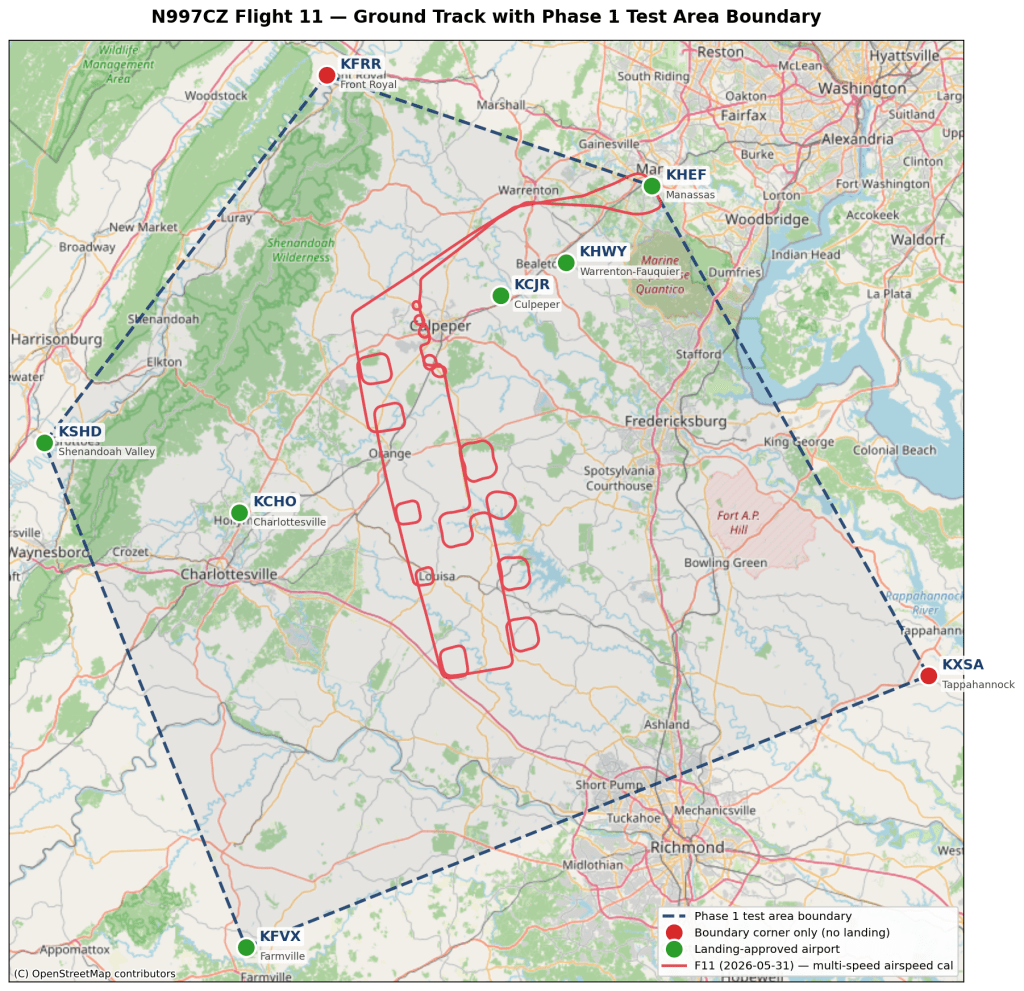
Thirty-plus gallons through the totalizer is more than one tank holds (30 gal/side), so this was a mid-flight tank-switch flight — only the second one in the program. Everything stayed comfortably inside the test-area boundary you can see in the opening image; the cluster of little boxes and circles southwest of Culpeper, up around Louisa, is where all the calibration work happened.


The Purpose: Why Fly Circles at Eleven Different Speeds

The airspeed indicator shows IAS — indicated airspeed, the raw pitot-static reading. What you actually want for performance numbers is CAS (calibrated airspeed, with the airframe’s position error removed) and ultimately TAS (true airspeed). The gap between IAS and CAS — the position error — depends on where the static port sits, how the air flows around the fuselage, and it often changes with speed. A system that’s nearly perfect at cruise can be a few knots off in slow flight, which is exactly where you care most.

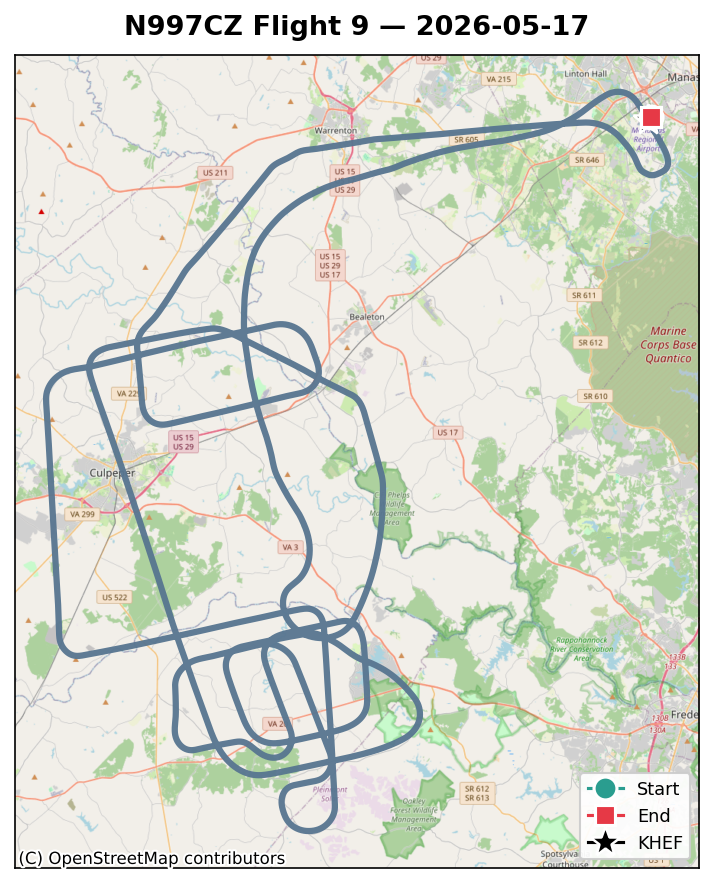
My two earlier calibration points (Flights 7 and 9) were both stuck around 145–148 KIAS, because that’s just where the airplane happened to be when I had clean data. Flight 11 was the flight to fix that — to deliberately hold a series of different indicated airspeeds, all the way from cruise down to near stall, and measure the error at each one.

How I flew it. The trick to measuring true airspeed without a calibrated airspeed reference is to let GPS do the work. If you fly a full 360° at a constant indicated airspeed, your GPS ground-velocity vectors trace out a circle: the radius of that circle is your true airspeed, and the center is the wind. No compass, no assumptions — just geometry.

So I flew a stack of constant-IAS loops at ~6,500 feet:

  • First half — autopilot, heading bug walked around the cardinals, stepping down: 154, 139, 119, 98, 94 KIAS.
  • Second half — autopilot again, stepping back up: 130, 138, 144, 150, 155 KIAS.
  • Then, hand-flown — the autopilot won’t hold below about 95 knots, so I clicked it off and flew the slow ones by hand: 89, 82, 75, 71, and 66 KIAS.
Flight 11 chopped into constant-IAS segments, ground track colored by airspeed, with the transitions between segments in gray
Flight 11 chopped into constant-IAS segments — ground track colored by airspeed, transitions in gray.

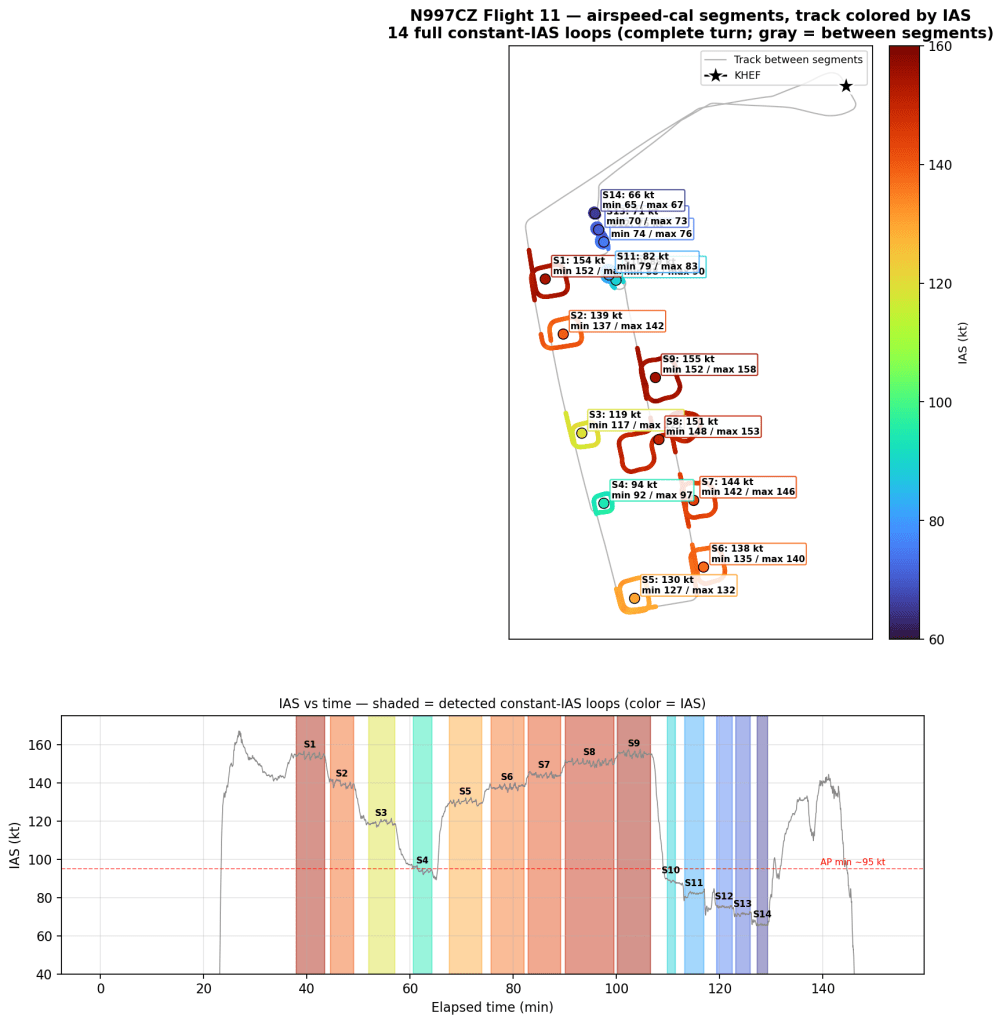
After the flight, the data-reduction problem was just chopping that long log into the individual stabilized-airspeed loops — fourteen of them, from 66 to 155 KIAS — and trimming each one down to the clean, full-circle, constant-speed portion. Then each loop gets its own GPS circle fit.


The Airspeed Results

Here’s the headline, and it’s not what I expected: the airspeed indicator reads low. The airplane is genuinely flying a couple knots faster than the dial shows — a little at slow speed, and about three knots at cruise.

Airspeed-system position error vs IAS for Flight 11, with the recomputed Flights 7 and 9 points, from the GPS circle wind solve
Position error vs IAS for Flight 11, with the recomputed Flights 7 and 9 points.

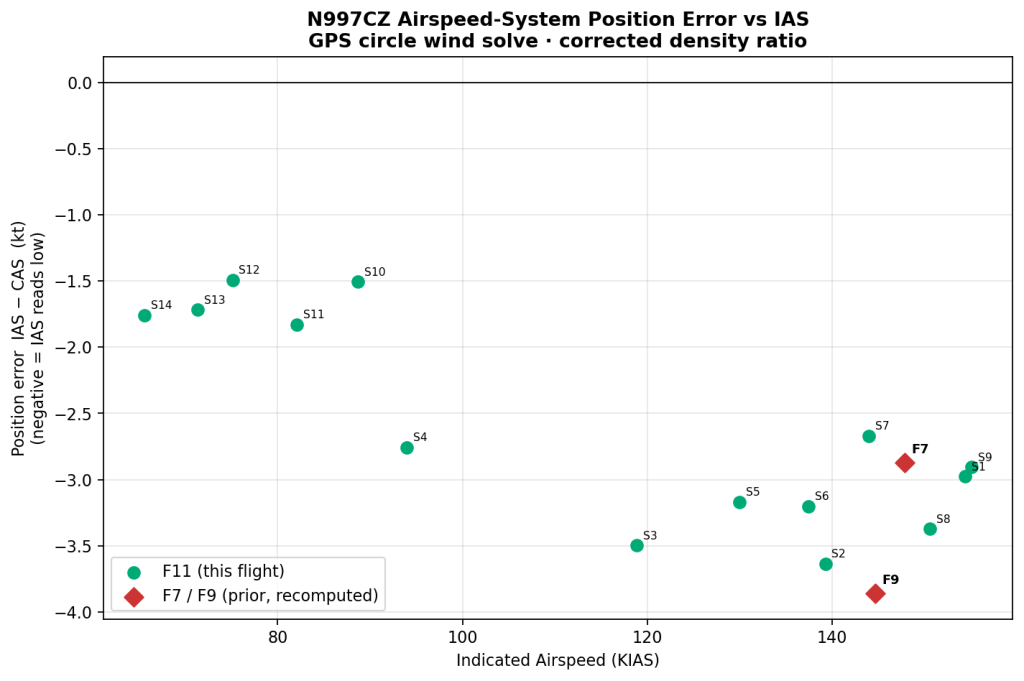
Position error (IAS minus the GPS-derived calibrated airspeed) at each tested speed:

IAS (kt)Position error (kt)Reads…
66−1.8low
71−1.7low
75−1.5low
82−1.8low
89−1.5low
94−2.8low
119−3.5low
130−3.2low
138−3.2low
144−2.7low
150−3.4low
154/155−3.0 / −2.9low

So roughly −1.5 to −1.8 kt down in the slow-flight band, growing to about −3 kt in cruise. The circle fits were tight — RMS residuals of 0.4 to 1.6 knots — and the wind solution came out consistent across every single loop (8–14 kt out of the northwest), which is a nice internal sanity check: if the loops were sloppy, the winds wouldn’t agree.

Practically, this is good-news-bad-news. It means your true cruise and climb speeds are a hair better than the panel suggests. It also means that on final approach, when the indicator says 80, you’re really doing about 81–82 — worth knowing, not alarming.

The part where I was wrong

When I wrote up Flights 7 and 9, I concluded the pitot-static system was “essentially clean — basically zero position error in cruise.” That was wrong, and the error was mine.

Converting GPS true airspeed back to calibrated airspeed requires the air density ratio, and the formula I’d used computed it incorrectly — it was effectively using the pressure ratio at standard temperature instead of the actual density ratio. I caught it while setting up Flight 11’s analysis, checked the corrected formula against the standard-atmosphere tables (it matches exactly now), and reran everything.

With the fix, those two old cruise points come out to about −2.9 and −3.9 kt — right in line with Flight 11’s cruise cluster. And it resolved a puzzle that had been bugging me: previously the indicator looked perfect but the G3X-computed true airspeed read 3–4 knots low, which made no physical sense — they should move together. With the corrected density ratio they do move together, because there’s just one error: the static system reads a little low, and that propagates into both the indicated and the computed-true airspeed. One bug, two symptoms.

Can I just fix it in the avionics?

Short answer: no. I went looking for a place in the G3X to enter an IAS-to-CAS correction and checked the installation manual to be sure. The G3X Touch has a “Zero-Airspeed Calibration” (a zero-point/sensor-noise step), but no facility to load a position-error curve. So this ~2–3 kt isn’t something I can dial out in the box — it’s a known characteristic of the airframe, to be handled with awareness and maybe a small placard. CAS ≈ IAS + ~2–3 kt in cruise. Done.


Also On This Flight

A calibration sortie is a long time at altitude, so a few other threads picked up data along the way:

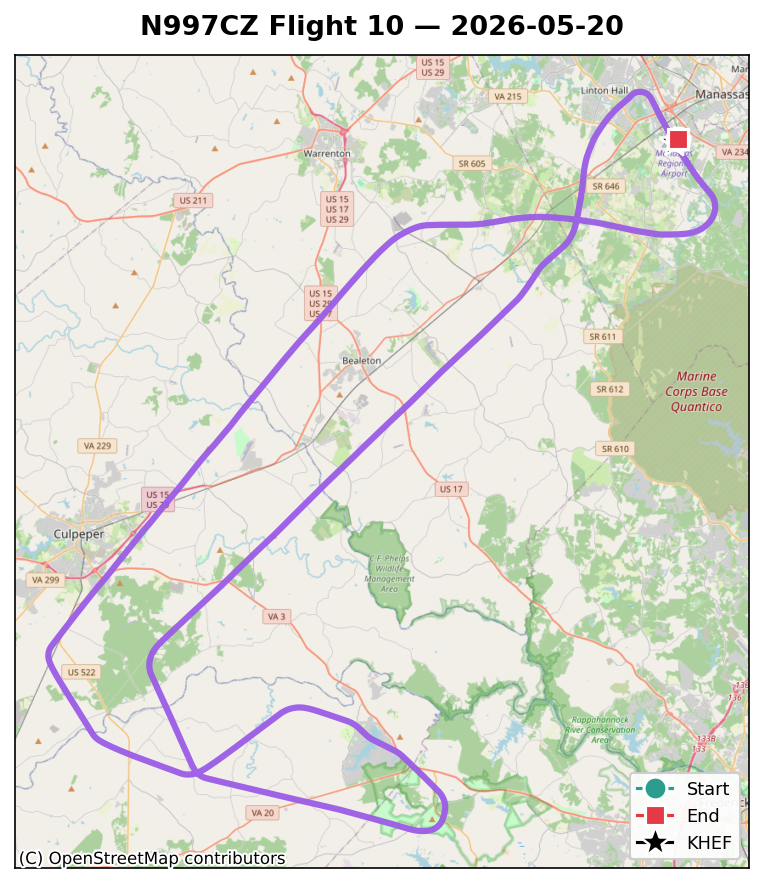
  • Cylinder cooling. Before Flight 10 I removed the cooling air dam in front of cylinder 1, which cooled #1 nicely but looked like it might be starving cylinder 5 (the rearmost on that bank) of climb cooling. Flight 11 confirmed it: temperature-adjusted, the peak climb CHT on #5 has now climbed 401 → 410 → 427 °F over the last three flights, and #5 is now the hottest cylinder in the climb. Cruise is unaffected — it’s purely a climb-cooling cost. That’s a watch item.
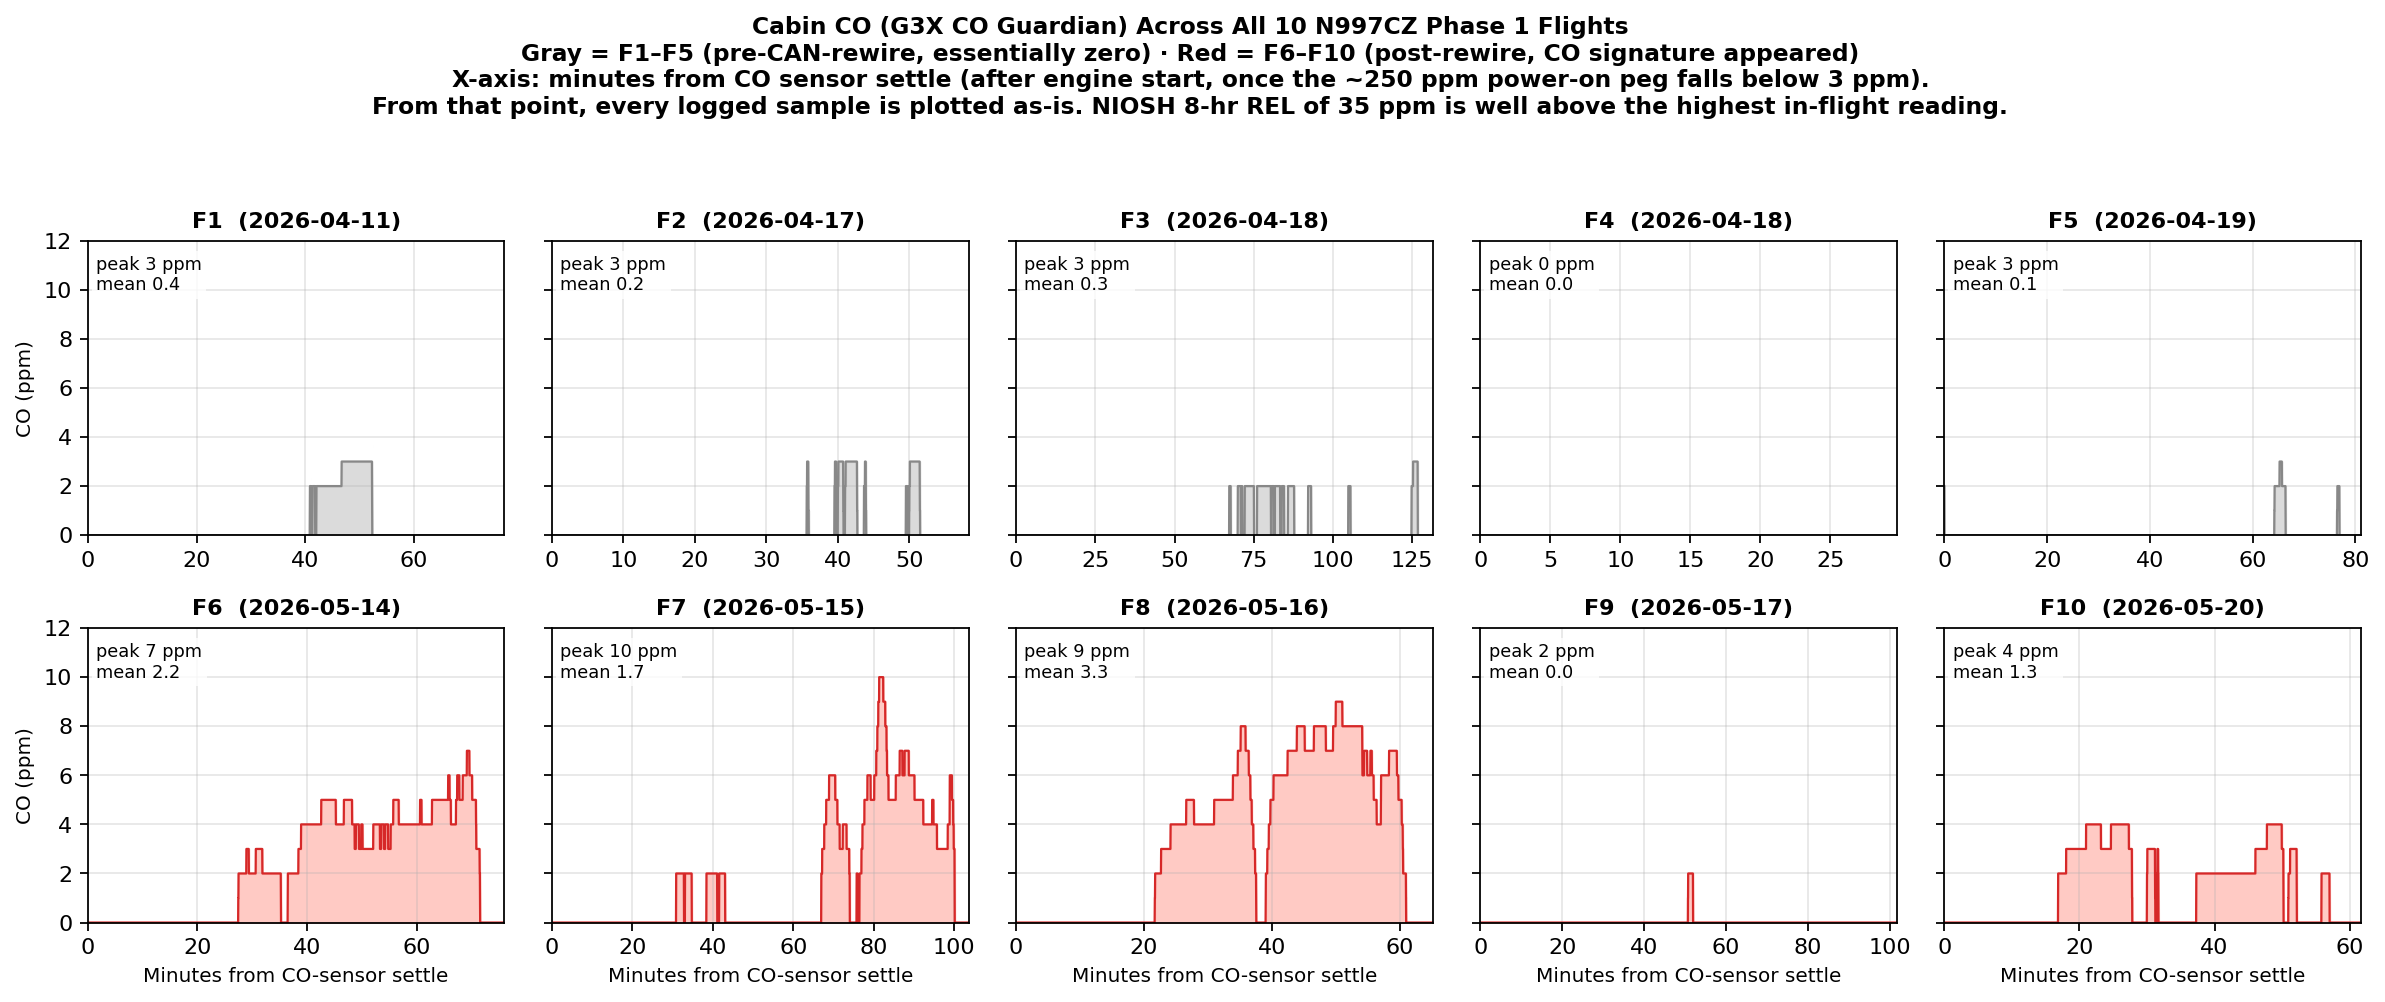
  • Carbon monoxide. Still there. Peak ~9 ppm, showing up during the slow-flight portions, consistent with the firewall heat-door leak I’ve been chasing. The tape-the-heat-doors test still hasn’t been flown.
  • Mixture. This was the leanest cruise yet (~14.5 gph), continuing to lean out as I dial in the engine.
  • Autopilot. I bumped up both the roll and pitch servo max-torque settings in flight to firm up how it tracks — useful while flying precise boxes.

A No-Flap Finale

The flight ended with an unplanned test point. Coming home, when I selected flaps for landing, nothing came down: the flap position sensor had gone haywire in a way that made the VP-X — which drives the flaps based on that sensor’s feedback — refuse to run them. I only pieced that together late in the landing sequence, around the base-to-final turn, which is a poor place to start troubleshooting. There were two good outs available: the VP-X allows manual flap control from an on-screen override on the MFD, and a go-around was on the table the whole time. With the runway made and the airplane stable, I took the third option — keep flying the clean airplane I’d been flying all morning and make a no-flap landing. It was a non-event: carry a few extra knots, use a little more runway, and move the troubleshooting to the ground, where it belongs.

The diagnosis: the Ray Allen POS-12 flap position sensor — a 20-plus-year-old hand-me-down from our RV-7 — has a potentiometer worn out at one end of its range. I remounted it to ride on the healthy end of its travel, which brought it back to life for now, but a sensor that old and probably full of dust has earned retirement: a replacement went straight onto the parts list. (Spoiler from the squawk file: this story isn’t over.)

Squawks

  • Flap position sensor failed in flight — see “A No-Flap Finale” above. It didn’t touch the calibration data (the whole profile was flown flaps-up), but it did decide how the flight ended. Replacement sensor on the parts list.
  • Left magneto switch is installed upside down.
  • Fixed before the flight: a loose bolt on the left flap (a mechanical item, separate from the indication problem above).

Bottom Line

Flight 11 was the airplane’s longest flight, its cleanest dataset, and the one that finally mapped airspeed error across the whole envelope: the indicator reads about a knot and a half low slow, about three knots low at cruise, and there’s nothing to fix in the avionics — just something to know. It also cost me a little humility, since getting there meant finding a mistake in my own earlier math — and a no-flap landing, courtesy of a worn-out sensor. That’s flight test: the airplane keeps you honest, and so does the arithmetic.

Engine time after Flight 11: 14.9 hours.

N997CZ — Flights 5 Through 10: A Catch-Up Post

Composite ground tracks for N997CZ Flights 5 through 10, color-coded by flight, on OpenStreetMap tiles
Composite ground tracks for N997CZ Flights 5 through 10 — KHEF marked with a star, each flight color-coded.

I owe the blog about six flights. Some of that is because I’ve been heads-down on the actual flying, some because every flight in this stretch turned up at least one new thing worth investigating, and some because the bigger investigations — the CAN bus rewire, the AHRS situation, the CHT data — kept demanding their own dedicated posts.

So rather than try to retroactively write six separate Flight N posts, here’s a single catch-up running from Flight 5 through Flight 10, hitting the headline from each. The dedicated deep-dive posts cover the analysis side; this is the chronology.


The Numbers

FltDateFlt hrsCyclesFuel (gal)Dist (nm)Total hrs
52026-04-191.4421.3155.36.0
62026-05-141.3519.1149.17.4
72026-05-151.7619.4169.38.9
82026-05-161.1712.096.69.8
92026-05-171.7823.3230.111.4
102026-05-201.0811.7104.212.4

Eight engine hours of additional flight time across six flights. About 900 nautical miles flown. ~107 gallons burned. From ~6 engine hours coming into this batch to ~12.4 out of it. Phase 1 on this airplane is a flight-test-card program, not a fixed-hours one — we work through the required test cards rather than counting down to a hard hours limit — but the experimental Lycoming IO-540 with the SDS electronic ignition would put a 40-hour floor on Phase 1 even if we were counting hours. So 12.4 engine hours is early in the program, not midway.


Flight 5 — April 19. The Last Flight of “Phase 1A.”

1.4 engine hours · 21.3 gal · 155 nm.

Ground track for Flight 5 — local pattern work near KHEF
Flight 5 — local pattern work near KHEF.

Flight 5 was a per-cylinder CHT survey at altitude — methodical, mostly uneventful, and the last flight in what I now think of as Phase 1A: the batch of early flights that locked in the questions we’d spend the next month answering. I used roughly 13 gallons out of the left tank and landed needing a top-up — a fine reminder that I needed to start trusting the totalizer more and the gauges less.

The other thing F5 made clear was that the ADAHRS deviation problem was real and reproducible, not a Flight 1 fluke. PFD #1 tumbled on the takeoff roll, percentage-deviation values were spiking high, and the pattern matched the four flights before it. Time to stop flying and start fixing.


The Maintenance Gap — April 19 to May 14

Twenty-five days on the ground for what turned out to be three separate jobs:

  • CAN bus rewire — completed May 13. The Garmin G3X harness was both over-length (~96.5 ft total vs Garmin’s 66 ft max) and built with the wrong wire (standard aircraft shielded twisted pair instead of 120 Ω spec cable). New harness: 57.7 ft of Carlisle IT CAN24TST120(CIT). Full writeup is here.
  • Dynamic prop balance — went from 0.57 IPS down to 0.01 IPS. That’s a ~57× reduction. The engine cowl is now noticeably calmer in the air.
  • Left fuel-gauge float reoriented — the left tank gauge had been reading frozen high since first fueling. Root cause turned out to be the float-arm wire positioning the float too close to the tank’s interior ribs / baffle, where it would get physically stuck. The 2025 Van’s plans update shows a different way to bend the float-arm wire that orients the float more laterally and gives it more clearance to move up and down. Implementing that new bend pattern appears to have fixed it — the left gauge now tracks correctly through the readable band. (Full write-up to follow in a future post.) The right-side gauge is still stuck up (same root cause suspected, same fix likely needed), still on the to-do list.

Three problems addressed, one bench-flight worth of confidence restored, and we were back at the runway.


Flight 6 — May 14. First Flight Back, and a Surprise.

1.3 engine hours · 19.1 gal · 149 nm.

Ground track for Flight 6 — low, slow shakedown around KHEF after the CAN-bus rewire
Flight 6 — low, slow shakedown after the CAN-bus rewire.

F6 was deliberately a low, slow shakedown — peak ~2,070 ft, just enough to verify everything still worked after a month of wrenching. The CAN bus data was immediately, dramatically clean (zero protocol errors across the whole flight; pre-rewire flights had several hundred Bus-Off events apiece). That part was a win.

The surprise was carbon monoxide. The G3X CO Guardian had read essentially zero on every one of Flights 1 through 5. On Flight 6, with nothing changed about the engine, exhaust, or cabin sealing other than the avionics rewire, cabin CO peaked at about 7 ppm. Not alarming in absolute terms — the working alarm threshold is around 35 ppm — but a new signature that hadn’t been there before. The leading suspect, which I’ll come back to in a future post, is the firewall heat doors not seating fully closed.

For context on what those PPM numbers mean as the values climb on later flights, here’s the standard CO exposure scale:

Carbon monoxide symptoms by PPM level — NIOSH-based exposure thresholds
CO symptoms by PPM level (image courtesy TFT Pneumatic).

And here’s what the G3X CO Guardian actually measured in the cabin across all ten flights:

Cabin CO across all 10 N997CZ Phase 1 flights — F1–F5 essentially zero (gray), F6–F10 showing the new CO signature (red). NIOSH 35 ppm REL is well above any reading shown.
Cabin CO across all 10 N997CZ flights. Gray = F1–F5 (pre-CAN-rewire, essentially zero). Red = F6–F10 (post-rewire, CO signature appeared). NIOSH 35 ppm REL is well above any reading shown.

The story the chart tells: nothing on F1 through F5 (a few 1–3 ppm blips, mean below 0.5), then a clear new pattern starting at F6, peaking at 10 ppm on F7 during the slow-flight stalls and at 9 ppm on F8 with the wing roots taped. F9 looks essentially clean — but it was a benign autopilot-tuning profile. F10 is back to small numbers under a short, more aggressive profile.


Flight 7 — May 15. Out of the Pattern. First Stalls. First Airspeed Cal.

1.7 engine hours · 19.4 gal · 169 nm.

Ground track for Flight 7 — first push west toward Casanova / Culpeper for the stall series
Flight 7 — first push west toward the Casanova / Culpeper practice area.

Flight 7 was the first time I really left the immediate KHEF area. Climbed to about 8,800 ft west of the field and ran a clean-configuration stall series at light forward CG: about 1 kt per second deceleration, minimum airspeed ~58 KIAS before heavy buffet, no clean nose break yet. Wing roots were still bare (the wing-root grommet seal had been a contender for the CO source at this point) and cabin CO peaked at 10 ppm during the slow-flight portion of the flight — confirming that whatever was leaking was somehow correlated with high angle of attack or low airspeed, not just temperature.

Flight 7 also gave me a clean airspeed-calibration dataset I hadn’t planned on. Over about 22 minutes at ~7,000 ft and ~148 KIAS, I’d flown a mix of straightish legs and curving legs while working other test cards — not a single deliberate 360° turn, just a happy combination of headings that, taken together, ended up giving the GPS ground-speed vector enough azimuth coverage to support the GPS circle method. With 1,336 samples spread across the full compass and a circle-fit RMS of 2.4 kt, the result said the pitot-static system is essentially clean in cruise — position error +0.9 kt at ~148 KIAS. One cal point in the books; more to come at other airspeeds.


Flight 8 — May 16. Aggressive Stalls, and the Autopilot Wants to Dive.

1.1 engine hours · 12.0 gal · 97 nm.

Ground track for Flight 8 — back to the practice area for deeper stalls and the first AP engagement
Flight 8 — back to the practice area for deeper stalls and the first autopilot engagement.

I went back up to ~8,500 ft on F8 with more aggressive intentions: deeper stalls, more flap deployment, slower minimum airspeeds. Minimum logged IAS was 45.9 kt at about 7,900 ft, which is well into the “we’re not in the certified envelope anymore” territory and exactly what Phase 1 is for. Wing roots were taped on this flight to test the wing-root-as-CO-source theory.

Cabin CO peaked at 9 ppm anyway — actually with the highest mean CO reading of any flight to date. Wing roots, ruled out. The leading edge of the diagnosis shifted to the firewall heat doors. (More to come in a dedicated CO post; the investigation is still active.)

And then there was the autopilot. First time I engaged the AP in this airplane, it commanded a nose dive. Pitch channel sense was reversed — the AP was simply trying to hold pitch level, but with the servo direction wired backwards every correction it made was the wrong one, so it just kept pushing the nose over into a dive. We disengaged immediately, hand-flew the rest of the flight, and changed the G3X pitch servo direction from “normal” to “reversed” on the ground after landing. Configuration error, not a hardware failure, but a useful reminder of why we test these things at altitude before relying on them.


Flight 9 — May 17. Autopilot Tuning. And a Visit From an Old Friend.

1.7 engine hours · 23.3 gal · 230 nm.

Ground track for Flight 9 — autopilot tuning west of Casanova / Culpeper, with the Harry T and Bob H air-to-air rendezvous
Flight 9 — autopilot tuning west of Casanova / Culpeper. Includes the air-to-air rendezvous.

F9 was an autopilot tuning flight: 1.7 hours, max GPS altitude ~9,100 ft, mostly hand-flown to get up to altitude and then about 60% of the cruise samples on the autopilot. Confirmed the pitch-reversal fix from F8 — the AP now correctly climbs when it wants to climb. Worked the roll gain from 0.5 up to 0.7 and back to a settled 0.6, with the roll servo max torque bumped from 15% to about 40%. Roll axis is now tracking well; pitch tuning is up next.

The fun part of F9 was the air-to-air. Harry T and Bob H (Bob’s Cessna N8EM, “8 Echo Mike”) took off about 15 minutes behind me and joined up in the practice area west of Casanova / Culpeper. I worked at about 8,500 ft, they worked at about 3,000 ft, and we relayed live updates on the AP tuning progress on the air-to-air “fingers” frequency, 123.45 MHz. Visual contact. First time flying N997CZ alongside Bob’s airplane. The kind of flight where the data takes a backseat to the smile.

Two data-related notes from F9: cabin CO was essentially zero for the whole flight (the profile was too benign for the AoA-correlated leak signature to express itself, but worth logging). And the 11 autopilot-stabilized wings-level legs at ~8,500 ft / ~145 KIAS that came out of the tuning work happened to produce a perfect second airspeed-calibration data point: position error +0.5 kt, matching the F7 GPS-circle result almost exactly. Two cal points, two methods, two days apart — the pitot-static system is clean in cruise.

Full airspeed-calibration writeup — methodology (constant-IAS GPS circle, multi-leg wind triangle), per-leg data tables, and the F7/F9 cross-validation — is available as a PDF download below.

F9 was also the first confirmed mid-flight tank switch. Post-flight refueling receipt was 22.1 gal vs totalizer 23.3 gal (1.2 gal / 5% — within fuel-flow calibration tolerance), with the right tank taking about 8–9 gallons. Working tank split for this flight: ~13.5 L / ~8.5 R.


Flight 10 — May 20. The First Configuration Change.

1.0 engine hours · 11.7 gal · 104 nm.

Ground track for Flight 10 — air-dam-removal test, max GPS altitude ~11,080 ft
Flight 10 — air-dam-removal test. Max GPS altitude ~11,080 ft, a new high for N997CZ.

F10 was the first deliberate configuration change to the airframe since the maintenance gap. The Cyl 1 front air dam was removed before the flight to see whether more cooling air would lower Cyl 1’s persistently-hottest CHTs (and at what cost to the cylinders downstream of it). About an hour of engine time, max GPS altitude ~11,080 ft (a new high for this airplane), warm day with cruise OAT around 71 °F.

I’ll be honest: I didn’t check the weather before this one. It was a beautiful blue-sky day with a few white puffballs of fair-weather cumulus, and I was preoccupied with the air-dam mod. Departing Manassas to the west I could see some thunderstorm activity well to the north — at the time it looked like it was on the far side of Dulles, possibly out near Leesburg, and based on that I felt comfortable climbing west and away from it to do the test profile.

Up at 10,000–11,000 ft and turned around looking back east, the situation had changed. The storm had organized and was starting to encroach on Dulles and the corridor between Dulles and Manassas. Decision time was easy: hightail it home. I came back to Manassas and they had me land from the north to the south with the thunderstorm just behind my tail. Wheels down, taxi clear, into the chocks, shut down, debrief in the cockpit — all of that with the sky behind me turning increasingly serious.

Maybe one or two minutes after engine shutdown I opened the cabin door. The gust front hit exactly then. It took everything Harry and I had between us to keep the cabin door from being ripped off the hinges by the wind, and then it took everything we had to push the airplane back into the hangar against the gusts. The RV-7’s tow bar lives in the other hangar; we made it work, but N997CZ needs its own tow bar. Added to the parts list.

Headline result of the actual test, OAT-adjusted, F9 → F10: Cyl 1 max CHT dropped 33 °F. About 23 °F of that drop is attributable to the air-dam change beyond the cooling the other cylinders got on the same flight. Strong, clean signal. The downside, also predicted: Cyl 5 max went UP +9 °F — that’s the rear cylinder on the right bank, downstream of the redirected airflow. It’s a “canary” reading on whether the air dam was protecting Cyl 5’s climb cooling. F11 will tell us whether F10 was noise on a small sample, or whether we need a partial air dam to keep Cyl 5 happy.

Full CHT trend analysis across all 10 flights is its own dedicated post (the short version: the cylinder ranking has held invariant across all 10 flights, real break-in is visible in the climb maxes but essentially absent in cruise, and I was leaning too early per Lycoming’s SI 1427C).


Where We Are Now

12.4 engine hours in, with plenty of Phase 1 test cards still to fly. The headline open items going into F11 and beyond:

  • AHRS still tumbling on the takeoff roll every flight. CAN bus is clean, vibration is essentially eliminated (0.01 IPS), so the GSU 25C hardware itself is the leading suspect. I’ve just sent Garmin a fresh writeup closing the loop on the CAN bus rewire result and the prop balance result, alongside a 10-flight analysis showing the AHRS tumble pattern is identical before and after both fixes — and asked them once again about Service Bulletin SB 2144 and the potential need to swap or recall the two GSU 25C units on N997CZ. Waiting to hear back.
  • Cabin CO investigation continues. Firewall heat doors are the leading hypothesis; tape-test still to fly.
  • Cyl 5 climb cooling — F11 will tell us whether the air-dam removal was a free win or whether we owe Cyl 5 a partial fix.
  • Airspeed calibration at slow-flight speeds (~80, 100, 120 KIAS) — only the cruise point has been mapped so far.
  • Right fuel-tank float still stuck up. To-do.
  • Pitch autopilot tuning — roll is settled; pitch gains are next.
  • Flight 5 dedicated post — never going to happen at this point; consider this paragraph the substitute.

Next post will probably be the CO investigation, depending on which one closes out first. As always, thanks for following along.

— Jim