If you’ve been following the N997CZ journal, you’ll know that cylinder-head temperatures have been on my mind since the very first takeoff. Flight 1’s Cyl 1 peaked over 450°F before I’d even cleared the pattern, and from that moment on, every flight has carried with it a small cardiac event for me when I look down at the engine page on the G3X.
After ten flights and about 13 engine hours, I’ve finally pulled all of that CHT data into one place, run some regressions across it, and learned that a lot of what I thought I was seeing wasn’t quite right. This is the story of what the data actually shows — and where my initial interpretation broke down once I added one more variable.
Why CHTs Matter on a New Engine
For anyone new to all of this: cylinder-head temperature is the temperature of the metal at the top of each combustion cylinder, measured by a thermocouple right at the spark plug boss. Lycoming’s redline on the IO-540 is 500°F. The general guidance for break-in is to keep CHTs comfortably under 420°F during cruise and well clear of redline during climb, but more importantly to let the engine work: high power, full-rich mixture, no babying. The piston rings are seating against the cylinder walls during these first 25 to 50 hours, and that process needs combustion pressure and heat to happen properly.
The trade-off is that you’re running an engine hot, and you’re learning its baffling system, its idiosyncrasies, with no historical data to compare against. So you watch. And you write down what you see. And, in my case, you eventually pull it all into Python and start asking questions.
The Method: One Regression Per Cylinder, OAT Normalized
CHTs depend strongly on outside air temperature. A 70°F day produces materially hotter cylinders than a 40°F day, all else equal, just because the cooling air arriving at the baffles is hotter. So before I could see a meaningful “break-in” trend across ten flights spread over five weeks of spring weather, I needed to normalize for OAT.
I pulled the cruise window from each flight’s G3X log (filtered to RPM ≥ 2400 and altitude relatively steady), grabbed the OAT (°F) and the per-cylinder CHTs (°F), and fit a simple two-term regression for each cylinder:
CHT_cruise = a + b · OAT + c · flight_number
b tells me the OAT sensitivity (°F of CHT per °F of OAT — engineering rule of thumb is around 1.0). c is the break-in slope: how fast that cylinder is cooling off as the engine accumulates hours, after controlling for OAT.
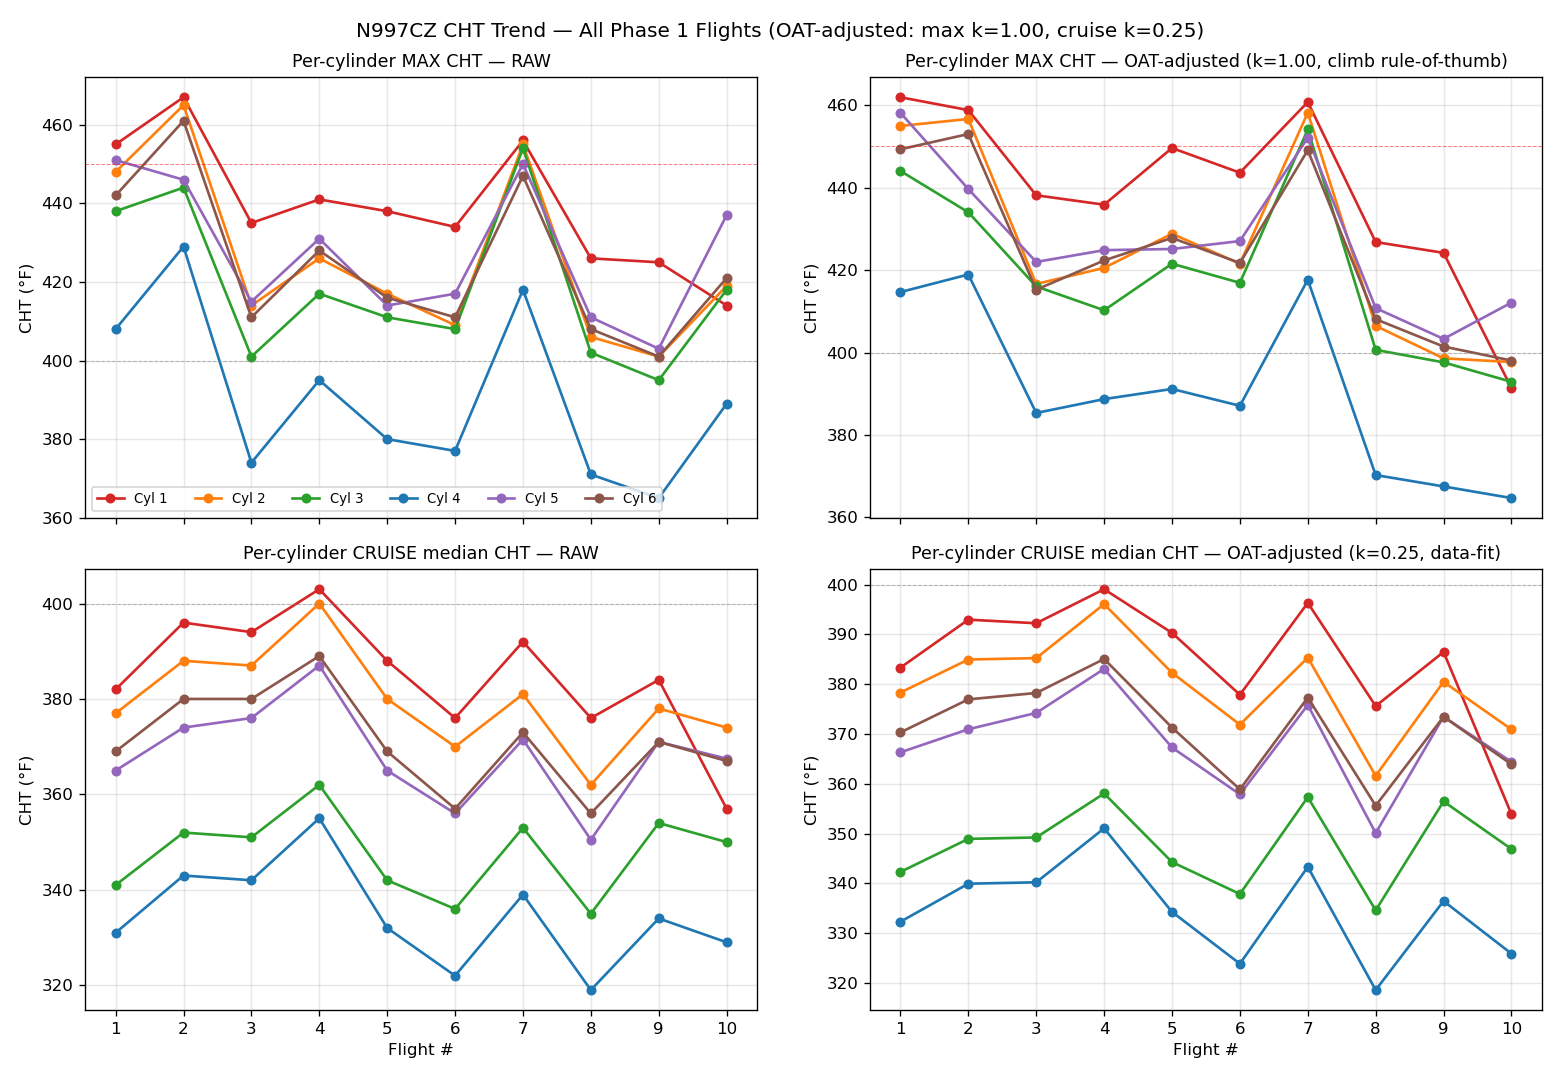
I also kept the raw max CHTs flight-by-flight (peak during the climb), since climb is where the cooling system runs nearest its capacity and where any improvement in heat transfer would show up most clearly.
What I Thought I Was Seeing
The first fit was across all ten flights, F1 through F10. The numbers looked beautiful:
- Cyl 1: c = −2.75 °F/flight. Hottest cylinder. Cooling fastest.
- Cyl 2: c = −1.52 °F/flight.
- Cyl 4: c = −1.31 °F/flight.
- Cyl 6: c = −1.33 °F/flight.
That fits the classic break-in story so well. The hottest cylinder breaking in fastest. Rings seating. The cruise temps trending down at a measurable rate. I wrote it up, called the family in to admire the regression coefficients, and started drafting a post about how my engine was breaking in nicely.
Then I added one more variable.
The Thing That Broke the Story
The variable was fuel flow. I’d been logging it the whole time, but I hadn’t pulled it into the CHT analysis. The thought was: what is each flight’s mean cruise fuel flow, and does it correlate with CHT in any obvious way?
Here’s what it looked like:
| Flight | Mean cruise FF (gph) | nm/gal |
|---|---|---|
| F1 | 22.6 | 6.9 |
| F2 | 19.5 | 7.5 |
| F3 | 18.4 | 7.9 |
| F4 | 20.3 | 7.2 |
| F5 | 21.1 | 7.1 |
| F6 | 19.83 | 8.11 |
| F7 | 15.68 | 9.61 |
| F8 | 16.4 | 9.9 |
| F9 | 16.7 | 9.3 |
| F10 | 15.6 | 10.4 |
Look at the step between F6 and F7. Mean cruise fuel flow dropped from 19.83 to 15.68 gph — a sharp single-flight transition — and fuel economy stepped from 8.11 to 9.61 nm/gal (+18%). Every F7+ flight runs leaner than every F1–F6 flight, without exception.
That step is exactly what it looks like: it’s where I started leaning the mixture. F1 through F6 were flown with the mixture at full rich, per the typical break-in playbook. By F7 — about 10 engine hours in — I’d decided I had enough data to start running a little leaner in cruise, and the fuel-flow numbers tell the story.
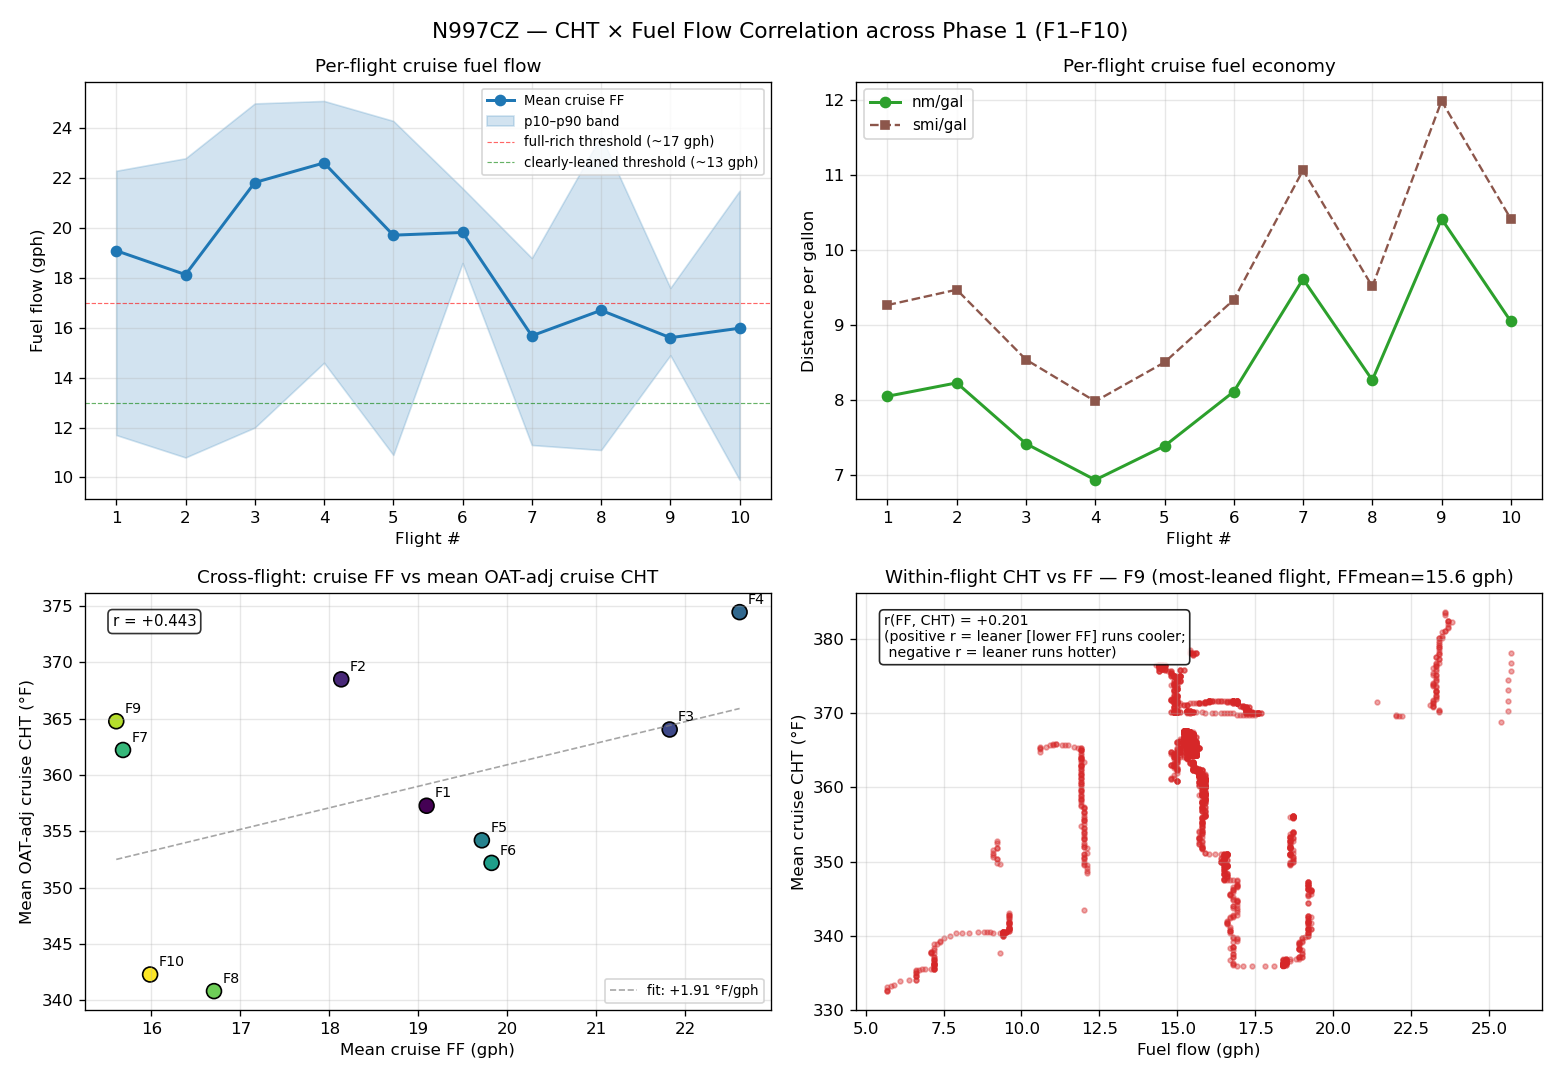
Now look at what that did to CHTs. The F6 → F7 comparison, OAT-adjusted: cruise CHT went UP +10°F from F6 to F7 (352°F → 362°F across the cylinder array). That’s the textbook leaning signature — pulling the mixture leaner moves combustion peak temperatures closer to the cylinder head, and head temps respond.
In other words, my break-in regression across F1 through F10 was fitting a smooth line through what is actually two different operating regimes. The “cruise CHT is dropping” trend wasn’t break-in; it was 60–70% the F7 leaning step pulling the F7+ flights down toward a different equilibrium. The regression couldn’t tell the difference.
It gets worse. Flight 10 had another step change: I pulled the air dam in front of Cyl 1. That’s a physical change to the cooling baffling. Another shift in the operating regime, layered on top of the leaning regime.
Re-fitting on the Clean Range
Once you know about a regime change, you fit around it, not across it. So I re-ran the regression on F1 through F6 only — the clean, full-rich, no-air-dam-mod range — and the picture changed entirely:
- Cyl 1 c = +0.29 °F/flight (was −2.75 in the all-flights fit)
- Cyl 2 c = +0.37 (was −1.52)
- Cyl 3 c = +0.35 (was +0.10)
- Cyl 4 c = +0.02 (was −1.31)
- Cyl 5 c = −0.02 (was −0.86)
- Cyl 6 c = −0.67 (was −1.33)
- Mean c = +0.06 °F/flight (was −1.28)
Cruise CHT break-in, in the full-rich regime, is essentially zero. The cylinders are not measurably cooling at cruise as the engine accumulates hours. The earlier “Cyl 1 broke in fastest at −2.75°F/flight” was about 60–70% the F7 leaning step plus the F10 air-dam mod. The actual break-in signal in cruise data, in the regime where break-in is supposed to be happening, is statistical noise.
And the OAT sensitivity that I’d been wondering about (the all-flights fit said b ≈ +0.25, way below the engineering rule of thumb of 1.0) snapped back into shape when I limited it to the clean regime: b ≈ +0.89 °F CHT per °F OAT in F1–F6 only. The rule-of-thumb is roughly right for this engine in full-rich cruise; the previous low number was suppressed by mixing in the leaning regime.
Where Break-In Actually Shows Up
So is my engine breaking in at all? Yes — but the signal lives in maximum CHTs (climb conditions), not in cruise.
| Flight | Cyl 1 MAX CHT |
|---|---|
| F1 | 455°F |
| F2 | 442°F |
| F3 | 438°F |
| F4 | 438°F |
| F5 | 437°F |
| F6 | 434°F |
That’s a −21°F drop over six flights for the hottest cylinder, in conditions where the cooling system is running near its capacity. That’s the break-in signature. Climb is where the engine is making the most heat per unit of cooling air; that’s where any improvement in heat transfer (or any small reduction in friction work) is going to be most visible.
The lesson: cruise has so much cooling margin that ring-seating doesn’t move cruise temps in any measurable way. If you want to see break-in in your CHT data, look at the climb maxes, not at cruise medians. I’d been looking at the wrong column.
Lycoming SI 1427C and the Leaning Mistake
While I’m being honest about what I got wrong: Lycoming Service Instruction 1427C explicitly says do not lean during break-in. I leaned at Flight 7, which was around 10 engine hours of total operation — earlier than the manufacturer recommends. The good news is that F8 and F10 don’t show any distress signature (no CHT excursions, no rough running, no oil consumption surprises I can see), so it’s probably fine.
But the cleaner path for the remaining ~12 to 15 hours of break-in is to go back to full rich at high power, and let the cylinders finish seating against the cylinder walls without me changing the operating point underneath them.
There’s a second piece of Lycoming guidance worth flagging: their actual gold-standard test for “is break-in complete?” isn’t CHT at all. It’s oil consumption. When per-hour oil add stabilizes at a low and consistent rate, the rings have seated. I haven’t been tracking oil consumption nearly carefully enough through these first 10 flights, and that’s a habit I’m going to fix going forward.
The F10 Experiment
I mentioned the F10 air-dam removal in passing — that deserves its own paragraph because the result is interesting.
Cyl 1 has consistently been the hottest cylinder on this engine, and the cylinder layout (Lycoming IO-540, right bank front to rear: 1 → 3 → 5; left bank front to rear: 2 → 4 → 6) puts it at the front of the right bank, where you’d expect it to be getting the freshest, coolest induction air. So why is it always the hottest?
One hypothesis was that the small air-dam baffle in front of Cyl 1 was redirecting too much cooling air past it (toward Cyl 3 and Cyl 5 deeper in the bank) and not onto it. So I pulled the air dam before Flight 10 to see what happened.
The result, OAT-adjusted, F9 → F10 deltas:
- Cyl 1 cruise: −32°F. Cyl 1 max: −33°F. That’s about 23°F of extra cooling on Cyl 1 beyond what the other (control) cylinders saw. Strong, clean air-dam-removal signal.
- Cyl 3 (right middle, downstream of the redirected air): no penalty. Cruise tracked the control group; max actually dropped slightly.
- Cyl 5 (right rear, downstream): the canary. Cruise tracked the control group. But max Cyl 5 went UP +9°F while every other cylinder went down 0–10°F. That’s a 12–18°F relative warm-up in the high-stress climb regime, on the cylinder that’s furthest downstream on the right bank.
So the air dam was doing real work — keeping enough air flow over to the back of the right bank to keep Cyl 5 happy during climb. F11 will be the test. If Cyl 5 max stays elevated relative to the trend, that’s a real climb-cooling cost and I’ll need to think about a partial air dam or a different baffle modification. If Cyl 5 pulls back into line, F10 was noise on a small sample size.
What I’d Do Differently
A few takeaways from this round of analysis, mostly aimed at past-me:
- Don’t lean during break-in. Lycoming says so, and it confounds your data in addition to whatever it does to your engine. I should have stayed full-rich for the first 25 hours.
- Always split your regression at known regime changes. Adding fuel flow as a variable, or just visually inspecting it for step changes, would have caught this before I started believing the −2.75 °F/flight number. A regression doesn’t know about operating regimes; you have to tell it.
- For break-in, watch max CHT, not cruise CHT. That’s where the cooling system is closest to its limits, and that’s where any change in heat transfer will show up. Cruise has too much margin to be a useful break-in metric on this engine.
- Track oil consumption rigorously. It’s the actual answer to “is break-in done?” — and I’ve been treating it as a footnote.
- Single-flight changes are not break-in. F10 looked great on Cyl 1, but it was one data point against a known air-dam-removal mod. F11/F12 will tell us whether that’s the new baseline or a fluke, and whether the Cyl 5 climb-cooling cost is real.
A Footnote on How This Analysis Got Done
I want to be honest about the workflow here, because it’s something I’m thinking about a lot lately. I built the original “Cyl 1 is breaking in fast” regression in an afternoon, and I was ready to ship it. The reason it didn’t ship that way is that I was talking through the result with Claude — Anthropic’s AI assistant — and it kept asking annoying questions like “have you looked at whether fuel flow changes across these flights?” and “are you sure the operating point is the same?” The fuel-flow analysis that broke the story open was prompted by exactly that kind of push-back.
I’ll write a longer post on this workflow at some point, but the short version: AI-assisted data analysis is genuinely useful for catching the things a tired homebuilder is about to ship. It’s also a useful collaborator for sanity-checking the math, generating the chart, and writing the script that drops a fuel-flow column into an existing dataframe. None of which is a substitute for thinking about the data carefully — but it’s a force multiplier on the thinking.
What’s Next
F11 and F12 are going to be the air-dam follow-up flights. The plan: go back to full-rich mixture, fly a representative climb-and-cruise profile, see what Cyl 1 cruise (does it stay near 354°F, or does it drop further — that distinguishes mod-only effect from continuing break-in) and Cyl 5 max (does it stay elevated, or pull back in line) do. And start logging oil add events more carefully so I have the actual break-in metric Lycoming cares about.
If you’re working through Phase 1 on a new engine yourself and you’ve been staring at CHT numbers wondering what they’re telling you, I hope this is useful. The headline I’d leave you with: watch the maxes, not the means; don’t change two things at once if you can avoid it; and if your data tells you a beautiful story, ask it what’s missing before you publish.
Posted from N997CZ flight test program — see the CAN Bus Rewire post for the most recent system-level fix, and the First Flight post for the origin of the CHT story.
