Flight 2 took place a week after the first flight, on April 17, 2026. If you haven’t read the first flight post, that’s probably the right place to start — it covers the aircraft, the context, and the CHT spike that set the stage for everything that followed.
This one was shorter, more stressful, and ended with a maintenance discovery that turned out to be both the cause of the problem and a straightforward fix. Here’s what happened.
The Setup
The original plan for Flight 2 was the same as Flight 1: west side of the field, 1,800 feet MSL, north-south legs in the practice area. But when I made the coordination call to Manassas tower that morning, the picture changed.
The controller asked me to keep my pattern on the east side of the field. On the east side, they could give me 1,400 feet MSL — 400 feet lower than Flight 1, and on the side of the field with less room to work in. For a second Phase 1 experimental flight, that wasn’t ideal. But it was what was available that day, so that’s what we did.
Full fuel on both sides — 30 gallons left, 30 gallons right.
The Flight
Takeoff was unremarkable except for two things that repeated from Flight 1: the AHRS-1 attitude indicator tumbled on the takeoff roll (same behavior as before — isolated to PFD1, PFD2 and the G5 standby both remained stable), and CHTs spiked above the warning limits during climb. This time all six cylinders went over 435°F, peaking somewhere in the 460–475°F range before settling down. Higher than Flight 1’s peak, which was unwelcome, and attributable to the later time of day and warmer ambient temperatures.
We were at 1,400 feet MSL with a compact pattern on the east side of the field. Not exactly the relaxed cruise conditions you’d want for watching CHTs settle, but the temperatures did come down as we moved out of the climb and into cruise power.
Then the Oil Temperature Started Misbehaving
Flight 1 had shown clean, stable oil temperature throughout. Flight 2 did not.
Partway through the flight, the oil temperature gauge spiked suddenly to an obviously unrealistic reading — well above what oil temperature can physically reach in a few seconds. I knew it wasn’t a real temperature (temperature can’t rise that fast), but an erratic gauge is still an erratic gauge. I noted it and kept flying.
It happened again. Then a third time — and this time the gauge didn’t just spike, it went dark. No reading at all for a minute or two.
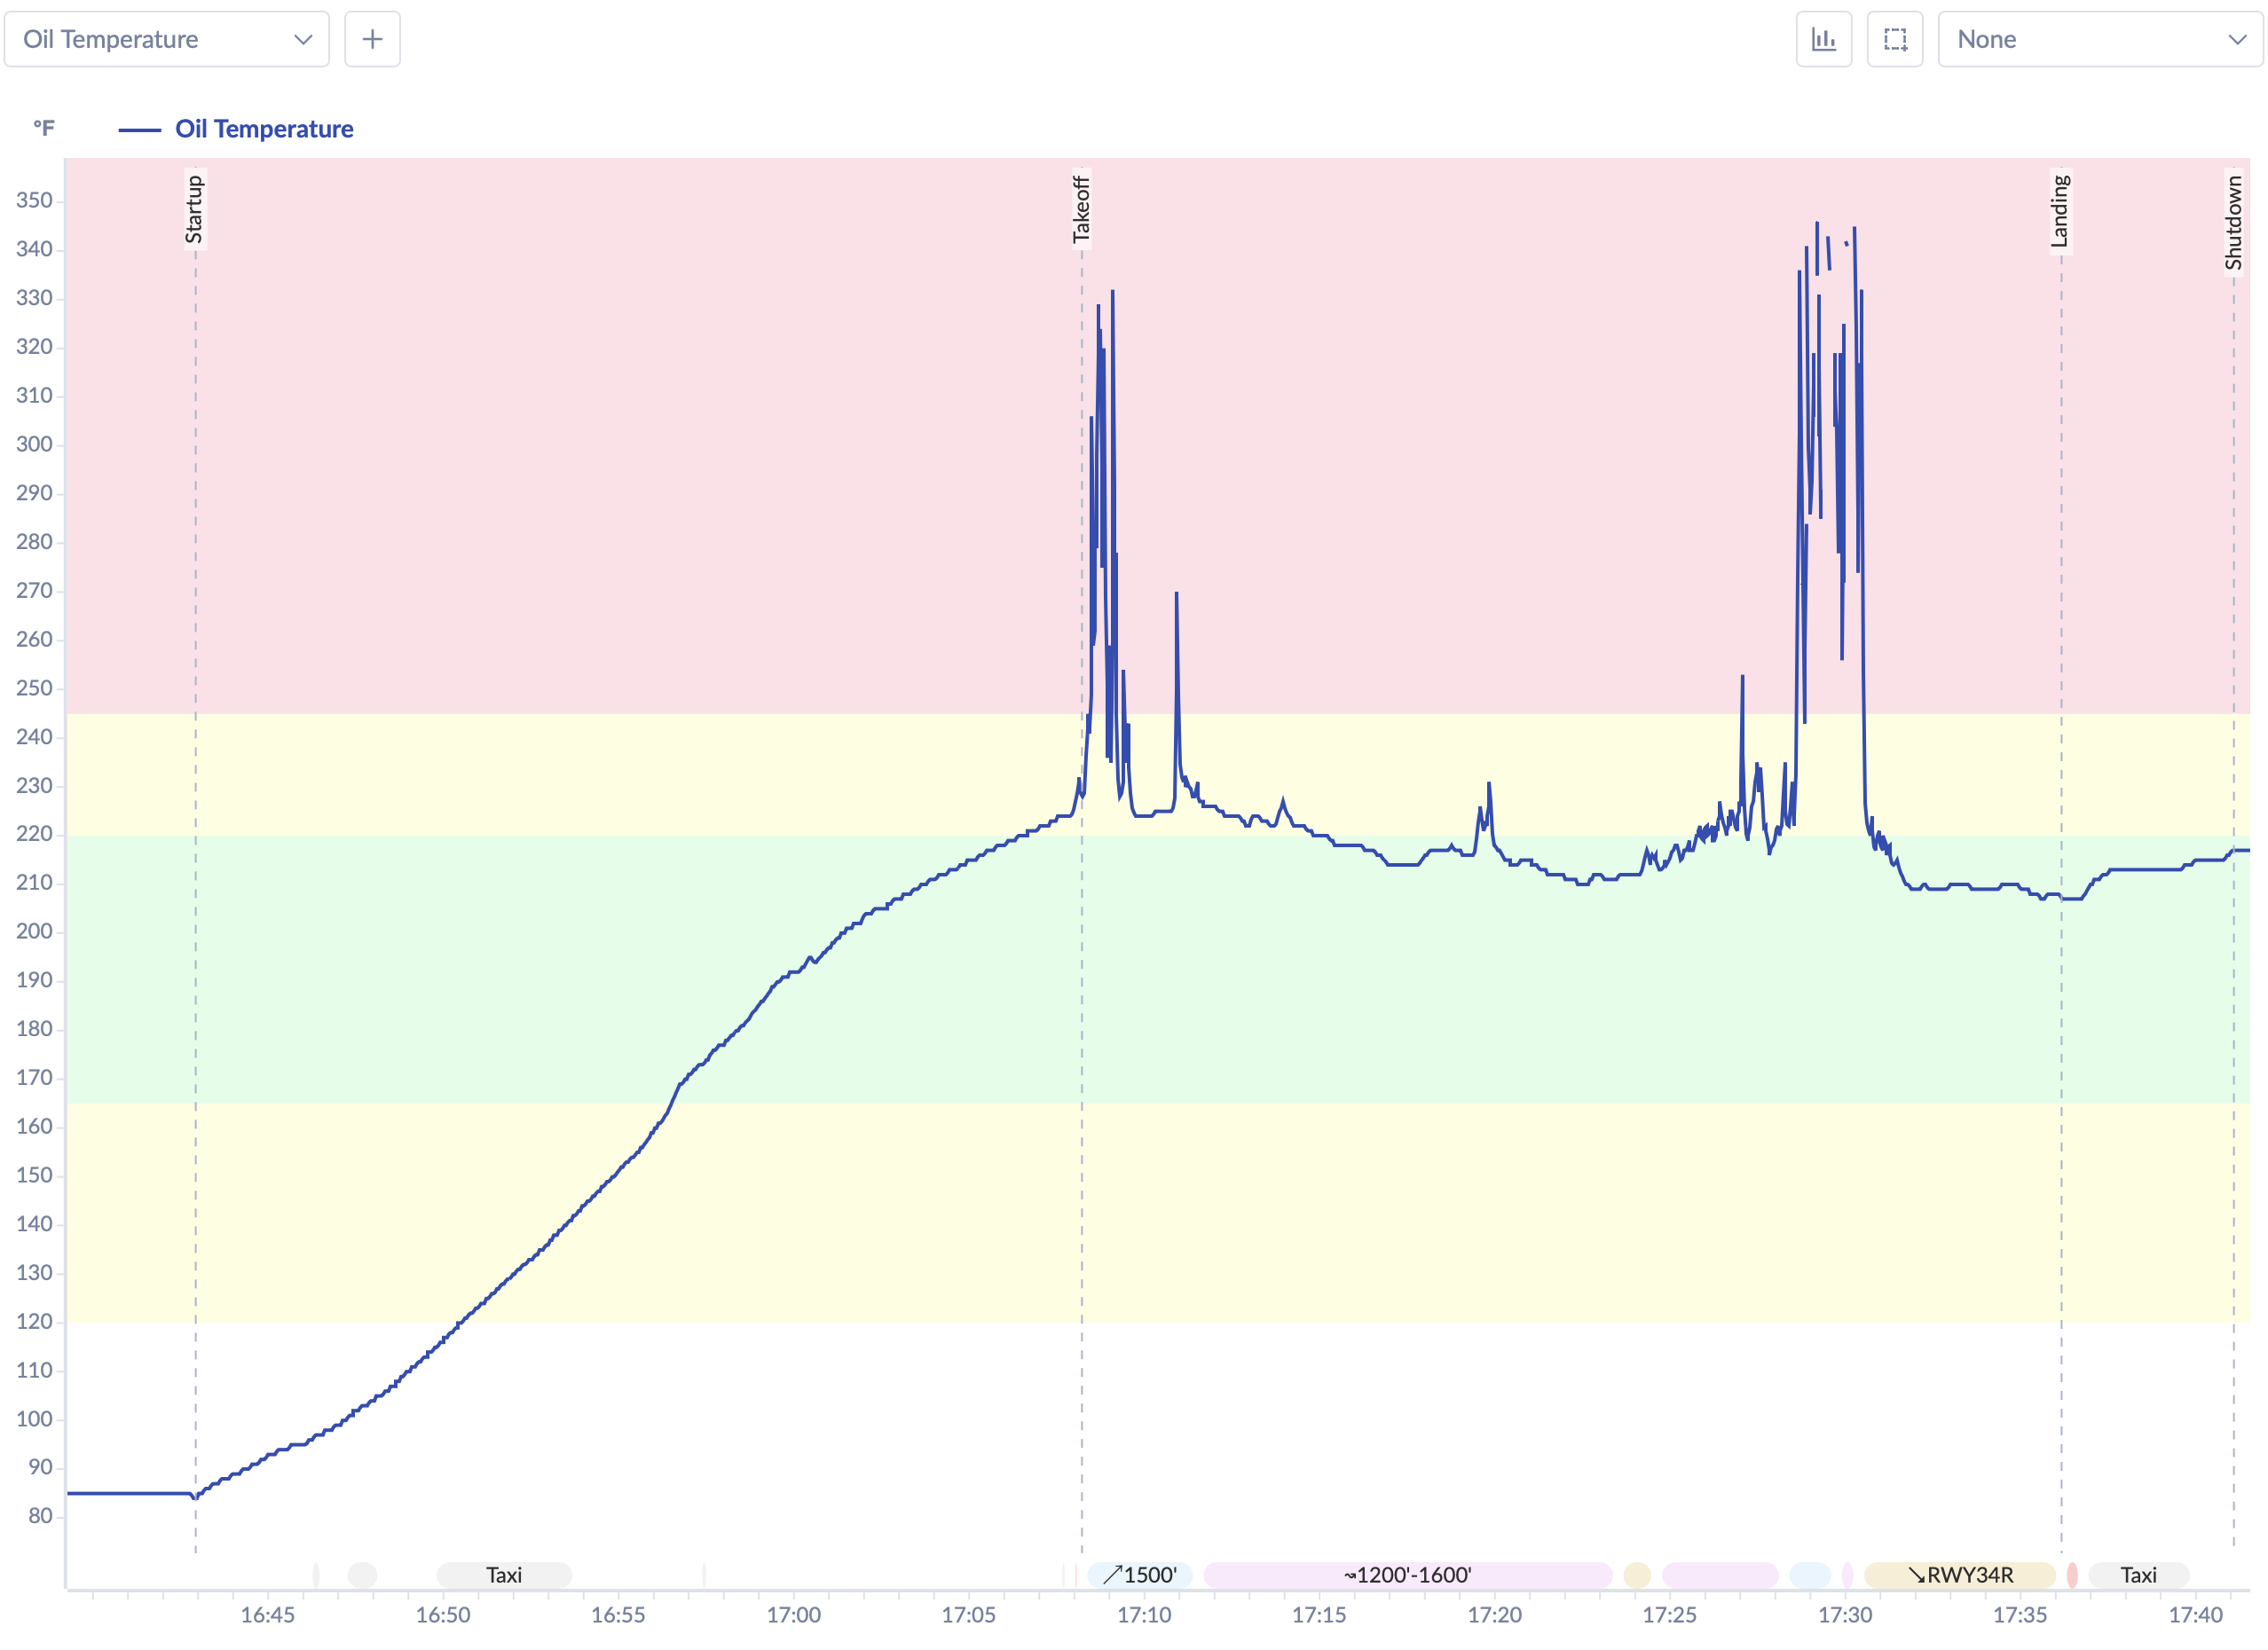
Oil pressure was steady the entire time — 75–80 psi, never wavering. That was reassuring. A failed oil system shows up in the pressure first; the pressure was fine. But flying with no oil temperature indication, in a tight pattern at 1,400 feet, on a second experimental flight, with CHTs that had already been high — that was enough. I made the call to land early and figure it out on the ground.
Total flight time: approximately 28 minutes. Fuel burned: 9.5 gallons from the left tank (confirmed by both the totalizer and the fuel truck, which put exactly 9.5 gallons back in).
The Diagnosis
Post-flight, we went looking for the cause. It didn’t take long.
In the firewall-forward wiring, near the oil temperature probe, we found a crimp connector that hadn’t grabbed the wire properly. When we unwrapped the bundle and pulled on the wire, it came free by hand — zero resistance. That was the culprit: an intermittent connection that would open under vibration, spike the reading to an implausible value, then reconnect. The third time it disconnected, it stayed disconnected long enough to drop the gauge entirely.
I’d actually noticed some finickiness with these wires before the first flight — wiggling the bundle in the hangar had produced erratic gauge readings on the ground. I wasn’t able to reproduce it consistently enough to isolate the cause before Flight 1, and it didn’t manifest during Flight 1. It clearly manifested during Flight 2.
The fix: re-do the crimp, properly this time. Wrap the bundle back up. Done.
Flight 3 would show whether the fix held.
What I Took Away
Flight 2 was short and more stressful than I’d planned. But the outcome was fine—nothing broke, I made a conservative decision to land when my instrumentation became unreliable, and we found and fixed the actual problem before the next flight. That’s the process working as it should.
A few things I’m carrying forward:
- Known issues need abort criteria before departure. If something is behaving oddly on the ground, decide in advance what you’ll do if it shows up in the air. Don’t leave that decision for the moment.
- Airspace coordination is worth doing ahead of time—and worth holding firm on. Getting assigned the east side at 1,400 feet added unnecessary pressure to an already-demanding flight. For subsequent flights, I’ve made a point to coordinate specifically for the west side of the field. Until I have full confidence in the aircraft and it’s ready to venture further outside the Class Delta for the remaining flight test program, having the more open, higher-altitude practice area on the west side is genuinely important—not just a preference. I’d encourage any experimental builder doing early Phase 1 testing at a busy Class D airport to have that conversation with the tower in advance, and be clear about what you need and why.
- The fuel totalizer appears accurate. Having the refueled quantity match the totalizer reading exactly was a genuinely useful data point—I’m more confident in that system now.
As always, if you’ve been through something similar—erratic instrumentation on an early test flight, a wiring issue that surfaced at an inconvenient time, or a tricky judgment call about when to land—I’d really like to hear about it in the comments. I don’t have all the answers on this airplane yet, and the conversations here have been more useful than I expected.
Up next: Flight 3: N997CZ — Two Hours West of the Field, Flaps for the First Time →
Please join the discussion or send feedback here: VAF Thread — RV10 N997CZ Takes to the Skies
